Featured Trade:
(WEDNESDAY, OCTOBER 17, 2018, HOUSTON GLOBAL STRATEGY LUNCHEON), (DON’T MISS THE SEPTEMBER 5 GLOBAL STRATEGY WEBINAR),
(THE MARKET OUTLOOK FOR THE WEEK AHEAD, or
THE WAR WITH CANADA STARTS ON TUESDAY),
(MSFT), (VXX), (TLT), (AAPL), (KO), (GM), (F)
I have spent all weekend sitting by the phone, waiting for the call from Washington D.C. to re-activate my status as a Marine combat pilot.
Failure of the administration to reach a new NAFTA trade agreement by the Friday deadline makes such a conflict with Canada inevitable.
And while you may laugh at the prospect of an invasion from the North, the last time this happened Washington burned. You can still see the black scorch marks inside the White House today.
This is all a replay for me, when in 1991, I enjoyed an all-expenses paid vacation courtesy of Uncle Sam. That’s when I spent a year shuttling American fighter pilots from RAF Lakenheath to forward bases at Ramstein, Aviano, Cyprus, and Dharan, Saudi Arabia.
It may seem unlikely that our nation’s military would require the services of a decrepit 66-year-old. However, in my last conflict I ran into another draftee who was then 66. It seems that the Air Force then had a lot of F-111 fighter bombers left over from Vietnam that no one knew how to fly.
That’s the great thing about the military. It never throws anything away. Not even me. The life of our remaining B-52 Stratofortress bombers at their final retirement in 2050 will be 100 years.
Perhaps Canada will decide that discretion is the better part of valor, and simply wait for the World Trade Organization to declare the Trump tariffs illegal, which they obviously all are.
That would then force the administration to withdraw from the organization the U.S. created at the end of WWII to regulate fair trade and go rogue. But then what else is new?
And while there was immense media time devoted to the NAFTA talks, which only oversees trade with partners with around $2 trillion each, China, the 800-pound gorilla, is still lurking out there. It has a $12.2 trillion GDP and Trump is imposing tariffs on another $200 billion of their imports there today.
The corner that Trump has painted himself into is that he has made himself SO unpopular abroad, insulting virtually everyone but Russia, that no leader is willing to risk doing a deal with him lest they get kicked out of office.
I certainly felt this in Europe this summer where the discussion was all about Trump all of the time. When you insult a nation’s leader you insult everyone in that country. I haven’t received that kind of treatment since the Vietnam War was running hot and heavy in 1968.
I’ll tell you, I’d much rather be flying combat missions over enemy territory without a parachute than trading a market like we had last week. For months now, it has been utterly devoid of low risk/high return entry points for all asset classes.
It’s been a slow-motion melt-up virtually every day against the most horrific news backdrop imaginable. Such is the wonder of massive global excess liquidity. It Trumps everything.
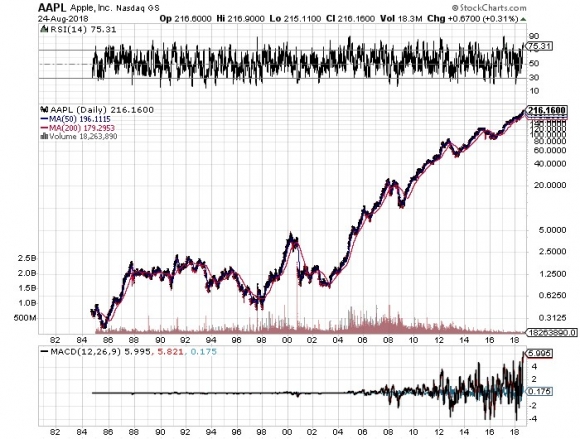
NASDAQ topped 8,000, proving that if you aren’t loaded to the gills with technology stocks, as I have been pleading all year, you are out of your freaking mind. If you don’t own Apple, you are doubly screwed.
I doubt that such data is available, but I bet the illiterate and the uneducated have been beating more literate types in performance by a huge margin.
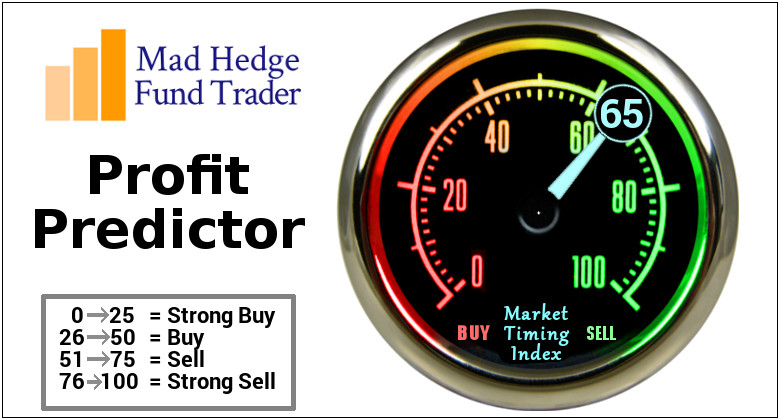
The unresponsiveness to news isn’t the only thing afflicting this market. As the summer coughs and sputters its way to a close, we enter September, notorious as the most horrific trading month of the year. And we are launching into it with the Mad Hedge Market Timing Index stuck in the 70s, overbought territory, for weeks now.
Blockbuster earnings, the principal impetus for rising share prices in 2018, are now firmly in the rearview mirror, and won’t make a reappearance for another month. Then they die completely in 2019.
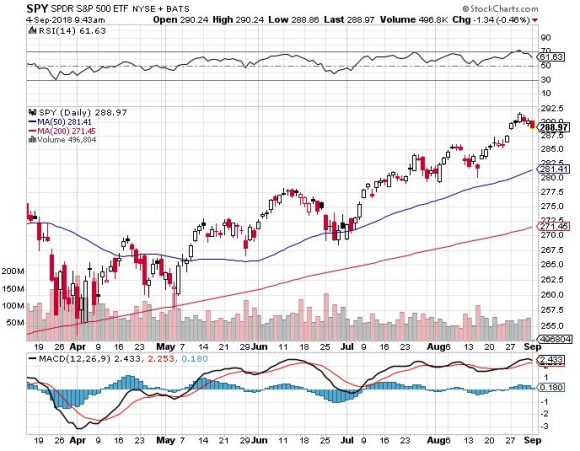
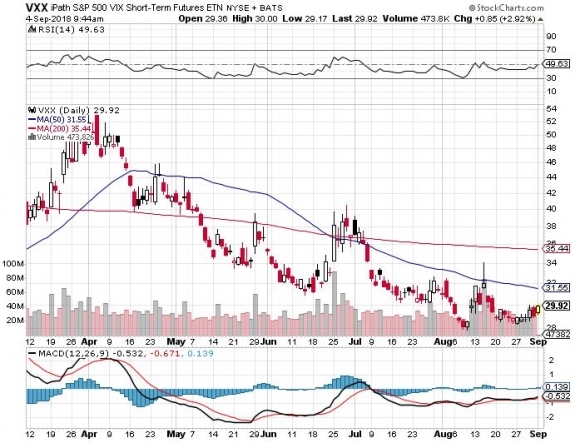
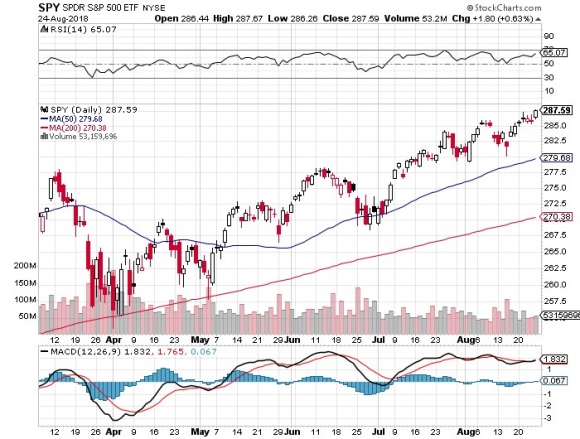
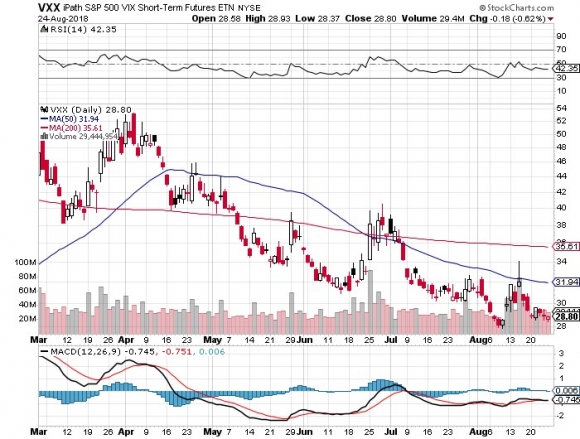
Perhaps this is why my long volatility position in the (VXX) is doing moderately well, even though the indexes have been hitting new all-time highs, with the S&P 500 briefing kissing $292. I rather practice my golf swing rather than try to outtrade this market, even though I don’t play golf.
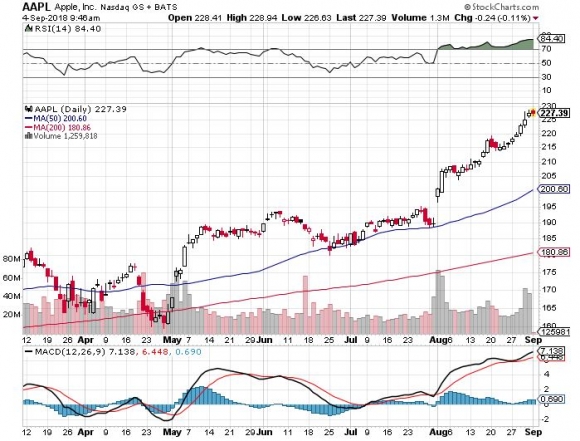
Other than NAFTA, there was little to trade off of last week. Apple (AAPL) shares continue to break new records, hitting an incredible $228, in front of their big iPhone launch this month. Trump announced he was freezing wages on 1 million-plus federal employees next year. That will solve their tax problems for sure.
Coca-Cola (KO) bought British owned Costa for $5 billion, where I regularly breakfast while traveling abroad, in the hopes that perhaps its 501st new drink launch this year will be successful.
Amazon (AMZN) is within sofa change of becoming the next $1 trillion market cap company, making the parents of founder Jeff Bezos the most successful angel investors in history, worth $30 billion.
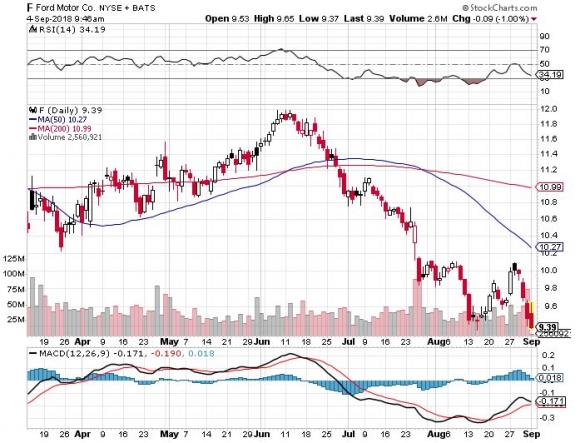
U.S. auto sales are in free fall. Car company shares (GM), (F) continued their slide as they are pummeled on every side by administration economic policies. One has to ask the question of how long the American economy can survive after losing a major leg like this one. Home sales, another vital component, are also suddenly awful.
Trump attacked big tech. The market yawned.
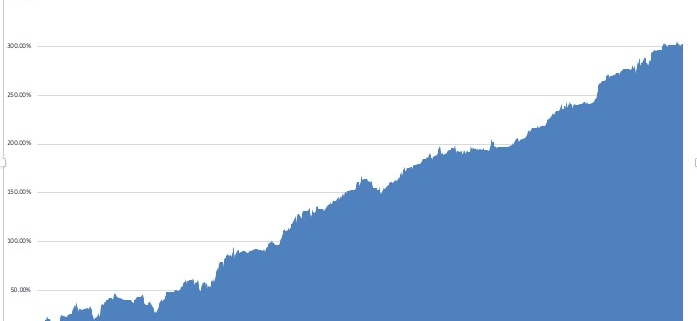
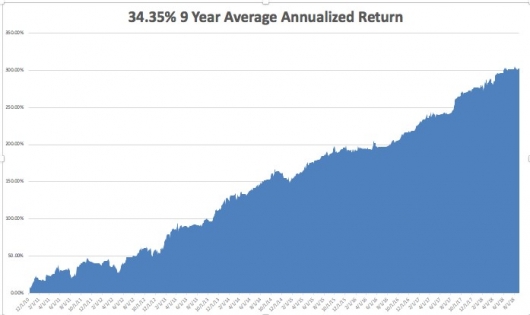
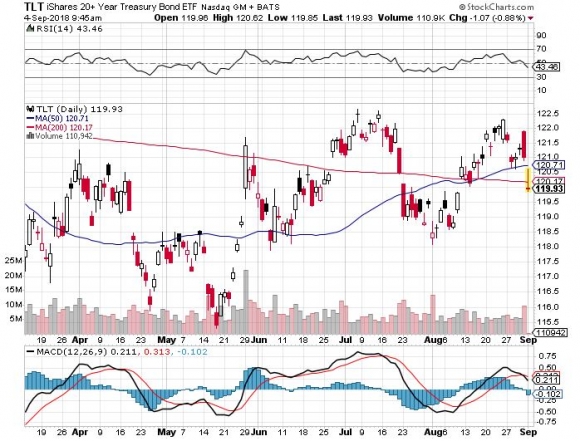
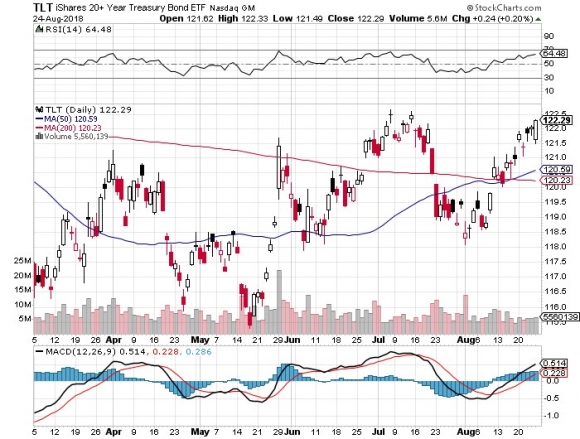
With the Mad Hedge Market Timing Index at 71 and bounces around in the 70s all week, I am not inclined to reach for trades here. All three of my current positions are making money, my longs in Microsoft (MSFT) and volatility (VXX) and my short in the U.S. Treasury bond market (TLT). August finally brought in a performance burst in the final days, leaving us with a respectable return of 2.13%. My 2018 year-to-date performance has clawed its way back up to 25.30% and my nine-year return appreciated to 303.48%. The Averaged Annualized Return stands at 34.35%. The more narrowly focused Mad Hedge Technology Fund Trade Alert performance is annualizing now at an impressive 28.59%.
This coming week housing statistics will give the most important insights on the state of the economy. On Monday, September 3, there was a national holiday, Labor Day.
On Tuesday, September 4, at 9:45 AM the PMI Manufacturers Index is out. August Construction Spending is out at 10:00 AM.
On Wednesday, September 5 at 7:00 AM, we learn MBA Mortgage Applications for the previous week.
Thursday, September 6 leads with the Weekly Jobless Claims at 8:30 AM EST, which saw a rise of 3,000 last week to 213,000. Also announced at 9:45 AM are the August PMI Services Index.
On Friday, September 7 the Baker Hughes Rig Count is announced at 1:00 PM EST.
As for me, the high point of my weekend was the funeral services for Senator John McCain. Boy, the Squids really know how to put on a ceremony. I suspect it may market a turning point for our broken American politics.
In the meantime, King Canute sits in his throne at the seashore ordering the tide not to rise.
Good luck and good trading.
https://www.madhedgefundtrader.com/wp-content/uploads/2018/09/average-annualized-image-2-e1536069988463.jpg315530MHFTRhttps://madhedgefundtrader.com/wp-content/uploads/2019/05/cropped-mad-hedge-logo-transparent-192x192_f9578834168ba24df3eb53916a12c882.pngMHFTR2018-09-04 14:29:162018-09-04 14:29:16The Market Outlook for the Week Ahead, or The War with Canada Starts on Tuesday
Last week saw senior-level felony convictions, the real estate and auto industries rolling over and playing dead, rising inflation, escalating trade wars, sagging exports. It’s as if an entire flock of black swans landed on the markets.
And what did stocks do? Rocket to new all-time highs, Of course! What, are you, some kind of dummy? Didn’t you get the memo? With $50 trillion of global excess liquidity spawned by a decade of quantitative easing, of course stocks will go straight up, forever!
Until they don’t.
Even my favorite, Apple (AAPL) blasted through to new highs at $219 after an analyst raised his target to $245. You may recall me loading the boat with Apple calls during the February meltdown when the shares hit $150.
My target for Apple this year was $200, which I then raised to $220. Am I going to raise my target again? No. As my late mentor, Barton Biggs used to say, “Always leave the last 10% for the next guy.”
It kind of makes my own split adjusted cost of Apple shares of 50 cents, which I picked up in 1998, look pretty good. Yup. That double bottom on the charts at 40 cents said it all.
I used the strength to increase my cash position from 80% to 90%, unloading my long position in Walt Disney options at cost. That leaves me with a single short position in bonds (TLT), which have to see yield on the 10-year U.S. Treasury bond market to fall below 2.67% in three weeks before I lose money.
I am even focusing a sharp eye on the Volatility Index (VIX) for a trade alert this week. If you buy the January 2019 (VXX) $40 calls at $2.90 and the ETF rises 25 points to its April high of $54, these calls would rocket by 382% to $14.00. Sounds like a trade to me! Then I can say thank you very much to Mr. Market, thumb my nose at him, and then take off for the rest of the year. TA-TA!
In the meantime, much of industrial America is getting ready to shut down. Tariffs on 50% of all Chinese imports come into force in September. It turns out that you can’t make anything in the U.S. without the millions of little Chinese parts you’ve never heard of, which also have no U.S. equivalent.
Factories will have to either pass their costs on to consumers in a deflationary economy or shut down. What the administration has done is offset a tax cut with a tax increase in the form of higher import taxes. It was not supposed to work out like that.
The bond rally has pared back my August performance to a dead even at 0.02%. My 2018 year-to-date performance has pulled back to 24.84% and my nine-year return appreciated to 301.31%. The Averaged Annualized Return stands at 34.76%. The more narrowly focused Mad Hedge Technology FundTrade Alert performance is annualizing now at an impressive 32.24%.
This coming week will be real estate dominated on the data front. On Monday, August 27, at 10:30 AM EST, we obtain the Dallas Fed Manufacturing Survey.
On Tuesday, August 28, at 9:00 AM EST, we get the June S&P CoreLogic Case-Shiller National Home Price Index. Will we start to see the price falls that more current data are already showing?
On Wednesday, August 29, at 10:00 AM EST, we learn July Pending Home Sales, which lately have been weak.
Thursday, August 30, leads with the Weekly Jobless Claims at 8:30 AM EST, which saw a fall of 2,000 last week to 210,000.
On Friday, August 31, at 10:00 AM EST, we get Chicago Purchasing Managers Index for July. Then the Baker Hughes Rig Count is announced at 1:00 PM EST.
As for me, I think I’ll pop over to the Pebble Beach Concours d'Elegance vintage car show this weekend and place a bid on Ferris Bueller’s red 1962 Ferrari GT California. It’s actually a Hollywood custom chassis built around a Ford engine. I can’t afford a real vintage Ferrari GTO, one of which is expected to sell for an eye-popping $60 million this weekend.
Good luck and good trading.
https://www.madhedgefundtrader.com/wp-content/uploads/2018/08/Vinage-car-story-1-image-5-e1535147811707.jpg345580MHFTRhttps://madhedgefundtrader.com/wp-content/uploads/2019/05/cropped-mad-hedge-logo-transparent-192x192_f9578834168ba24df3eb53916a12c882.pngMHFTR2018-08-27 01:07:252018-08-24 21:59:39The Market Outlook for the Week Ahead
Featured Trade:
(WHY BONDS CAN'T GO DOWN),
(TLT), (TBT), ($TNX), (TUR), (TSLA),
(HOW TO MAKE MORE MONEY THAN I DO),
(AMZN), (LRCX), (ABX), (AAPL), (TSLA), (NVDA)
Ho Hum. Another week, another financial crisis. And why did I rush back from the bucolic mountain pastures of Zermatt? To come back to the smoke-laden skies from the Northern California forest fires? It all must be an early sign of dementia.
Trump's foreign policy now seems crystal clear; to destroy the economies of all our allies. That's what he accomplished with NATO member Turkey today by doubling tariffs, triggering an instant 20% devaluation of the Turkish Lira. Turkey has been at war with Russia for 600 years.
Most Turkish companies have their debts in U.S. dollars or Euros (FXE), so you can write them off. That puts European banks at risk of another crisis, which could quickly turn global in nature. The flip side of this move was to take the U.S. dollar (UUP) to a new high for the year, thus crushing our own exporters even further.
Did our stock market care? Well. Actually yes, taking the Dow Average down 300 points. Will it care more than today? Probably not. All we are seeing is profit taking in some of the most overbought high fliers.
That is, unless, you are a soybean farmer, who saw prices collapse yet again. I watch bean prices closely these days, as it is an indicator of the market's expectation of intensifying trade wars.
After four decades of efforts to develop the Chinese markets, those efforts are going up in flames. And that business is not coming back now that the U.S. has proved itself an unreliable partner. As anyone in business will tell you, you only get to offend a customer once.
Markets generally believe that the U.S. trade war against the rest of the world is nothing more than a negotiating ploy. If that is not the case and they go on and on, you can move up the next recession and bear market by a year, like to tomorrow.
Perhaps the most important news of the week was the July Consumer Price Index leaping to 2.9%, a decade high. This is on the heels of the 2.7% pop in Average Hourly Earnings that came with the July Nonfarm Payroll Report.
Yes, ladies and gentlemen, this is called inflation. And while bonds normally get destroyed by such a data point, fixed income markets instead decided to focus on the strong U.S. dollar.
That was enough to entice me to sell short the U.S. Treasury bonds (TLT) for the first time in three months. With the Fed raising interest rates on September 25 by 25 basis points, what could go wrong?
Tesla (TSLA) sucked a lot of the air out of the room this week with its mooted buyout at $420 a share. I think it will happen. There is a global capital glut right now, with trillions of dollars of capital looking for a home. Ownership of Tesla would be a great hedge for Saudi Arabia against falling oil prices, which already owns 4% of the company. And guess who the world's largest per capita buyer of Tesla's is? Norway, which has a $1 trillion sovereign wealth fund of its own. The proposed $82 billion price tag for Tesla would look like pennies on the dollar.
Tip toeing back into the market with two cautious positions has boosted my August performance to 1.32%. My 2018 year-to-date performance has clawed its way up to 26.14% and my nine-year return appreciated to 302.61%. The Averaged Annualized Return stands at 34.91%. The more narrowly focused Mad Hedge Technology Fund Trade Alert performance is annualizing now at an impressive 32.24%.
This coming week will be a very boring week on the data front. On Monday, August 13, there will be nothing of note to report. It will just be another boring summer day.
On Tuesday, August 14, at 6:00 AM EST, we get the weekly NFIB Small Business Optimism Report.
On Wednesday, August 15, at 9:15 AM, we learn July Industrial Production.
Thursday, August 16, leads with the Weekly Jobless Claims at 8:30 AM EST, which saw a fall of 13,000 last week to 222,000. Also announced are July Housing Starts. At 4:30 PM, we learn the July Money Supply, which we might have to start paying attention to, now that inflation is on the rise.
On Friday, August 17, at 10:00 AM EST, we get Leading Economic Indicators. Then the Baker Hughes Rig Count is announced at 1:00 PM EST.
As for me, I will be stuck indoors this weekend and the government has warned me not to go outside unless absolutely necessary because the air quality is so bad. Maybe I can sneak out to Costco at some point to replenish my empty refrigerator.
Good luck and good trading.
https://madhedgefundtrader.com/wp-content/uploads/2019/05/cropped-mad-hedge-logo-transparent-192x192_f9578834168ba24df3eb53916a12c882.png00MHFTRhttps://madhedgefundtrader.com/wp-content/uploads/2019/05/cropped-mad-hedge-logo-transparent-192x192_f9578834168ba24df3eb53916a12c882.pngMHFTR2018-08-13 01:07:302018-08-13 01:07:30The Market Outlook for the Week Ahead, or Coming Home to Trouble
Featured Trade:
(JOIN US AT THE MAD HEDGE LAKE TAHOE, NEVADA
CONFERENCE, OCTOBER 26-27, 2018),
(WHY YOU MISSED THE TECHNOLOGY BOOM
AND WHAT TO DO ABOUT IT NOW), ($INDU), (TLT), (GLD), (GOOGL), (FB),
(AAPL), (NVDA), (MSFT), (AMZN)
Featured Trade:
(FRIDAY, AUGUST 3, 2018, AMSTERDAM, THE NETHERLANDS
GLOBAL STRATEGY DINNER), (THE MARKET OUTLOOK FOR THE WEEK AHEAD,
or IT'S SUDDENLY BECOME CRYSTAL CLEAR),
(SPY), (TLT), (QQQ),
(AMZN), (MSFT), (MU), (LRCX),
(REPORT FROM THE ORIENT EXPRESS)
Maybe it's the calming influence of the sound of North Atlantic waves crashing against the hull outside my cabin door for a week. Maybe it was the absence of an Internet connection for seven days, which unplugged me from the 24/7 onslaught of confusing noise.
But suddenly, the outlook for financial markets for the rest of 2018 has suddenly become crystal clear.
I'll give you the one-liner: Nothing has changed.
Some nine years and four months into this bull market, and the sole consideration in share pricing is earnings. Everything else is a waste of time. That includes the Greece crisis, the European debt crisis that drove MF Global under, two presidential elections, the recent trade wars, even the daily disasters coming out of the White House.
Keep your eye focused on earnings and everything else will fade away into irrelevance. It that's simple.
As I predicted, the markets are stair-stepping their way northward ahead of each round of quarterly earnings reports.
And now that we know what to look at, the future looks pretty good.
The earnings story, led by big tech, is alive and well. After a torrid Q1, which saw corporate earnings grow by a heart palpitating 26%, we are looking for a robust 20% for Q2, 23% in Q3, and another 20% in Q4.
The sushi hits the fan when Q1 2019 earnings grow by a mere 5% YOY as the major elixir of tax cuts wear off, leaving us all with giant hangovers.
Amazon (AMZN), Netflix (NFLX), and Microsoft (MSFT), all Mad Hedge recommendations over the past year, account for 70% of the total market gains this year.
Look at the table below and you see there has only been ONE trade this year and that has been to buy technology stocks. Everything else, such as oil, the S&P 500 (SPY), the U.S. dollar (UUP) has been an also-ran, or an absolute disaster. And we nailed it. Some 80% of our Trade Alerts this year have been to buy technology stocks.
The gasoline poured on the fire by the huge corporate tax cuts are only now being felt by the real economy. Q2 GDP growth could run as hot as 4%. But there is a sneaking suspicion in the hedge fund industry that these represent peak earnings for the entire economic cycle.
Corporate stock buybacks hit a new all-time high in Q2, as companies repatriate cash hoards from abroad at extremely preferential tax rates to buy back their own shares.
Trade wars are certainly a worry. But retaliation is directed only at Trump supporting red states, which accounts for only a tiny share of U.S. corporate profits. Technology stocks, which account for half of all American profits, have largely been immune, except for the chip sector (MU), (LRCX), which has its own cyclical problems.
Yes, we know this will all end in tears. The yield curve will invert in a year, taking short-term interest rates higher than long-term ones, triggering a recession and a bear market. But the final year of a bull market is often the most profitable as prices go ballistic. You would be a fool to stay scared out of stocks by headline risk and an uncertain Twitter feed.
Yes, early leading indicators of a coming recession are popping up everywhere now. A stunning 12.3% drop in June Housing Starts has to be at the top of anyone's worry list, as rising home mortgage rates and disappearing tax deductions take their pound of flesh. It was the worst report in nine months.
The trade wars promise to leave the Detroit auto industry in substantially reduced form, or at least, the stock market believes so. And a 10-year U.S. treasury bond yield that has been absolutely nailed in a 2.80% to 2.90% range for three months is another classic marketing topping indicator.
I'll let you know when it is time to pull up stakes and head for higher ground. Just keep reading the Diary of a Mad Hedge Fund Trader.
As I have been at sea and out of the markets, my 2018 year-to-date performance remains unchanged at an eye-popping 24.82%, and my 8 1/2-year return sits at 301.29%. The Averaged Annualized Return stands at 35.10%. The more narrowly focused Mad Hedge Technology Fund Trade Alert performance is annualizing now at an impressive 38.69%.
This coming week will be a very boring week on the data front.
On Monday, July 23, there will be nothing of note to report.
On Tuesday, July 24 at 8:30 AM EST, the May Consumer Price Index is released, the most important indicator of inflation.
On Wednesday, July 25 at 7:00 AM, the MBA Mortgage Applications come out. At 2:00 PM EST the Fed is expected to raise interest rates by 25 basis points. At 2:30 Fed governor Jerome Powell holds a press conference.
Thursday, July 26, leads with the Weekly Jobless Claims at 8:30 AM EST, which saw a fall of 13,000 last week to 222,000. Also announced are May Retail Sales.
On Friday, July 27 at 9:15 AM EST we get May Industrial Production. Then the Baker Hughes Rig Count is announced at 1:00 PM EST.
As for me, I am going to attempt to think of more great thoughts this afternoon while hiking up to the Hornli Hut at 11,000 feet on the edge of the Matterhorn, a climb of about 5,000 feet out the front door of my chalet. I always seem to think of my best ideas while hiking uphill. The liter of Cardinal beer and a full plate of bratwurst with rosti potatoes will make it all worth it.
Good luck and good trading.
0
https://madhedgefundtrader.com/wp-content/uploads/2019/05/cropped-mad-hedge-logo-transparent-192x192_f9578834168ba24df3eb53916a12c882.png00MHFTRhttps://madhedgefundtrader.com/wp-content/uploads/2019/05/cropped-mad-hedge-logo-transparent-192x192_f9578834168ba24df3eb53916a12c882.pngMHFTR2018-07-23 01:07:392018-07-23 01:07:39The Market Outlook for the Week Ahead, or It's Suddenly Become Crystal Clear
Featured Trade:
(THE MARKET OUTLOOK FOR THE WEEK AHEAD, OR THE FUTURE IS HAPPENING FAST),
(HOG), (TLT), (ROM), (MU), (NVDA), (LRCX),
(SPY), (AMZN), (NFLX), (EEM), (UUP), (WBA),
(THE WORST TRADE IN HISTORY), (AAPL)
There is a very high degree of risk involved in trading. Past results are not indicative of future returns. MadHedgeFundTrader.com and all individuals affiliated with this site assume no responsibilities for your trading and investment results. The indicators, strategies, columns, articles and all other features are for educational purposes only and should not be construed as investment advice. Information for futures trading observations are obtained from sources believed to be reliable, but we do not warrant its completeness or accuracy, or warrant any results from the use of the information. Your use of the trading observations is entirely at your own risk and it is your sole responsibility to evaluate the accuracy, completeness and usefulness of the information. You must assess the risk of any trade with your broker and make your own independent decisions regarding any securities mentioned herein. Affiliates of MadHedgeFundTrader.com may have a position or effect transactions in the securities described herein (or options thereon) and/or otherwise employ trading strategies that may be consistent or inconsistent with the provided strategies.