• support@madhedgefundtrader.com
  • Member Login
Mad Hedge Fund Trader
  • Home
  • About
  • Store
  • Luncheons
  • Testimonials
  • Contact Us
  • Click to open the search input field Click to open the search input field Search
  • Menu Menu

Tag Archive for: (TLT)

Mad Hedge Fund Trader

Time to Sell the Treasury Market Short

Newsletter

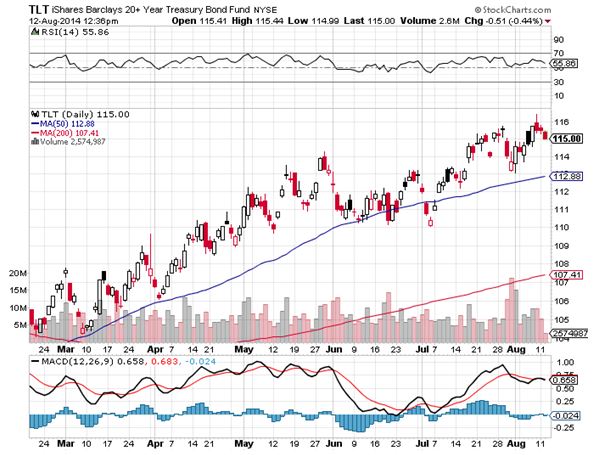
There is a layup of a trade setting up here in the wake of the escalating crisis in the Ukraine. Since January 2, the Treasury bond market (TLT) has enjoyed a massive 8 point rally, taking the ten year yield from 3.05% to 2.60%.

By shorting Treasury bonds here, you are betting that the yield doesn?t drop below 2.48% by March 21, an eight month low. That is only 13 trading days away.

Given a synchronized global economic recovery and rising US corporate earnings across a broad range of industries, the chances of this are minimal.

To get below this level in yields, you really need an out and out shooting war in the Ukraine, a complete nonstarter. Don?t forget that we have a February nonfarm payroll on Friday, which in recent months have been relentlessly disappointing. Therefore, I expect bonds to go nowhere for the rest of the week.

This is all a warm up for a much bigger trade that I am planning, a 10% weighting in the (TLT) June $108 puts outright, which last traded at $2.75. If the (TLT) returns to the $101 bottom, this could be an easy triple, and one of our biggest trades of the year. But you don?t want to consider this until we go over the top on the (TLT) on the charts, and the downside momentum resumes.

TLT 3-3-14

Vladimir PutinSee You a Division, and Raise You a Division

https://www.madhedgefundtrader.com/wp-content/uploads/2014/03/Vladimir-Putin.jpg 315 473 Mad Hedge Fund Trader https://madhedgefundtrader.com/wp-content/uploads/2019/05/cropped-mad-hedge-logo-transparent-192x192_f9578834168ba24df3eb53916a12c882.png Mad Hedge Fund Trader2014-03-04 01:03:002014-03-04 01:03:00Time to Sell the Treasury Market Short
Mad Hedge Fund Trader

All Asset Class Risk Reversal at Hand

Newsletter

I believe that we are on the verge of seeing major reversals across all asset classes. Get this one right, and you will make a fortune. Screw it up, and you will soon be looking for your next job on Craig?s List.

I understand that there is a desperate need for code writers in the cloud.

As always, I am taking my cue from the bond market. The great anomaly in the financial markets during February was the big divergence between the stock and bond markets.

While it was off to the races for stocks, the S&P 500 rocketing an impressive 7%, bonds didn?t believe it for a nanosecond.

If you had asked any global strategist a month ago where the ten year Treasury yield would be if the (SPX) posted a new all time high at 1,865, to a man they would have said 3.05%. Instead, bonds closed the week at a parsimonious 2.65%.

Something is desperately wrong with this picture.

If it were just bonds blowing a raspberry at this stock rally, I wouldn?t be so concerned. However, both the Euro (FXE) and the Japanese yen (FXY), (YCS) moved from strength to strength. They should be falling in a real bull market for stocks.

Precious metals have also been calling foul. If shares were the new risk free investment, why did gold pop by 9% last month? Better yet, why is silver up a sparkling 18%?

The gold producers have done even better. When Barrick Gold (ABX) soars by 26% in s single month, you?ve got to be worried about the stock market.

So here?s what happens next. With an assist from the Russian takeover of the Ukraine (wasn?t it so polite of them to wait a full week after the Sochi Olympics ended?), bonds take a run at the highs for prices and the low for yields, in the mid 2.50%?s.

This is why Mad Day Trader, Jim Parker, shot out a quick, opportunistic long play in the (TLT) last week. There, they will fail once again, as we are now in the early stages of a multi decade bear market.

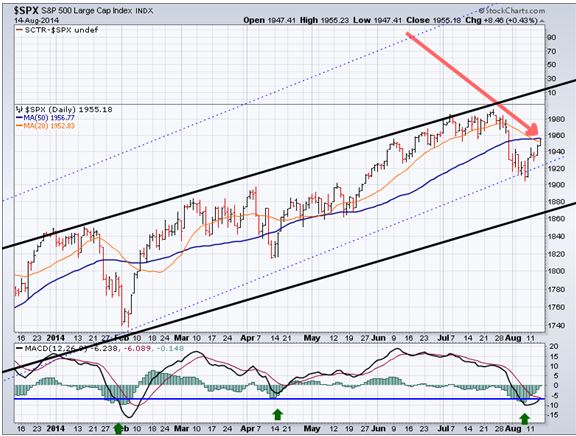
This will prompt stocks (SPX) to give up a third to a half of the recent rally, taking it to the bottom of an ascending channel at 1,800 (see below). Volatility (VXX) will spike from the current $12 handle back up to $20. This is why I bought the (SPY) $189 - $192 bear put spread on Thursday, which expires on March 21.

When the bond rally gives up the ghost, shares will resume their 2014 surge. Avoid emerging markets (EEM), because another dump in the bond market knocks the stuffing out of them one more time.

What will the currencies do? This will be the starting gun for great short plays on the yen, which returns to a ten-year bear market, and the Euro, which is just tweaking a three-year high.

In the meantime, the dollar basket ETF (UUP) launches into a multi month rally after putting in a double bottom. I shouldn?t need to draw lurid drawings for you on how to trade this.

As for gold? Sorry in advance to the hard money crowd, the inflationistas, and conspiracy theorists (who cares if Germany wants its gold reserves back from the Federal Reserve?). I think the 2014 rally in the barbarous relic dies a sudden, horrible death, and goes back to retest the $1,200 low one more time, possibly breaking it.

This scenario opens up great entry points across virtually all of the many asset classes that I track. When it?s time to strap on a position, I?ll shoot out Trade Alerts as fast as the speed of electricity permits (186,000 miles per second, or 300 meters per second in Europe).

Yes, I think we will finally get a real 10% correction in stocks going into the summer. But you better be nimble to trade it. My experience tells me that too many of you are selling at market bottoms, not buying.

I just thought you?d like to know.

spy 2-28-14

RSP 2-28-14

TLT 2-28-14

TNX 2-28-14

John Thomas - SnorkelJust Thought You?d Like to Know

https://www.madhedgefundtrader.com/wp-content/uploads/2014/03/John-Thomas-Snorkel.jpg 340 447 Mad Hedge Fund Trader https://madhedgefundtrader.com/wp-content/uploads/2019/05/cropped-mad-hedge-logo-transparent-192x192_f9578834168ba24df3eb53916a12c882.png Mad Hedge Fund Trader2014-03-03 01:05:232014-03-03 01:05:23All Asset Class Risk Reversal at Hand
Mad Hedge Fund Trader

Three Charts That Will Turn the Markets

Newsletter

I wrote at length yesterday about why this is not a new bear market, but a traditional 7%-10% correction instead. Now, I?ll show you three charts that will call the exact turnaround.

The ten-year Treasury bond (TLT), (TBT) is clearly the lead contract. It has, far and away, been the most accurate in anticipating the future direction of all asset classes. Get this one right, and everything else falls into line.

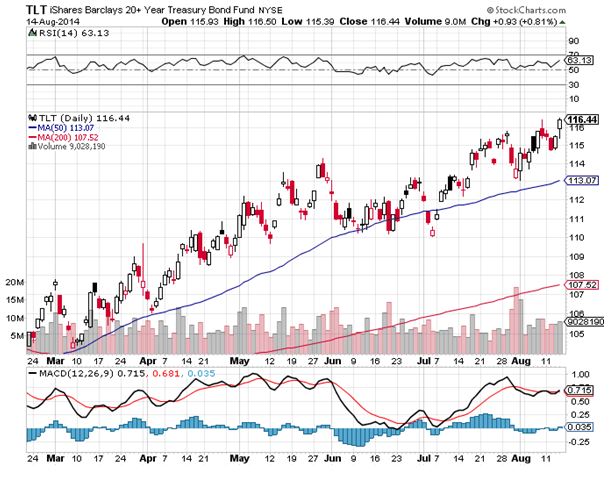
Take a look at the chart for the (TLT) below, which has clearly broken the 200 day moving average. I think that this is a false breakout, and that we are not trading in a new $108-$112 trading range that prevailed last spring. Note that while the 200-day average is busted, the 200-week is still putting up fierce resistance. This may well be the line in the sand that counts.

Next, take a look at the chart for the Japanese yen (FXY), (YCS). This is crucial because the yen is the world?s funding currency, thanks to its zero interest rates. When traders are in ?RISK OFF? MODE, they dump their positions in all asset classes and buy yen to repay their broker loans. This forces the yen to appreciate against the US dollar, something the Japanese government is loathe to seeing. This occurs on a scale of trillions of dollars.

When investors throw caution to the wind and pile back into ?RISK ON? portfolios, the reverse happens. They borrow yen and sell them to finance new positions, sending the yen down. Weakness in the yen is therefore the first place you will see a recovery in global markets.

The yen chart bellows shows that it is taking a run at its 200 day moving average at $97.91. That is only $1.70 up from here, and in line with ?100 to the dollar in the cash market, another important resistance level.

My expectation is that the yen will fail here and return to its longer-term downtrend, bringing a major 6% rally against the greenback to an end. That will send a great flashing green light to traders that the buyers strike is over and that its time to get back to work.

You see a very similar inverse chart with the S&P 500 (SPX). The bottom here also appears to be the 200 day moving average at 1,708, a mere 32 points below today?s low. That is only one bad day away. Watch for a rally from here to trigger simultaneous sell offs in the Treasury bond and yen markets.

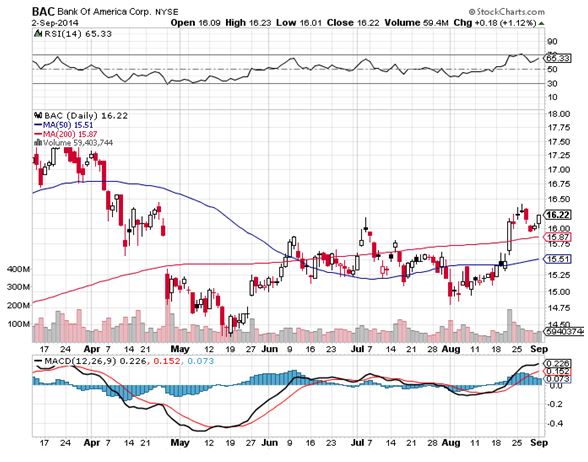
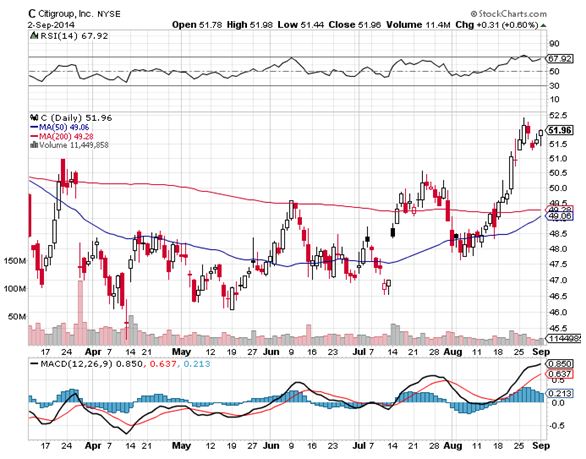
You can play this game all day long. A confirming move of a top in interest rates would be a big rally in bank shares, which need higher interest rates to make more money. So keep a laser focus on Bank of America (BAC) and Citigroup (C). At the same time, gold (GLD) will once again get thrown out with the trash, since higher rates punish holders here with a greater opportunity cost.

This all may happen sooner than you think. The Friday January nonfarm payroll neatly sets up a double top in the volatility index at $21. Get a good number, like over 200,000, and see substantial back month revisions up, and volatility will collapse back to the mid teens. Everything else I described above will come to pass.

However, I won?t find out what transpired until Saturday. When the Department of Labor releases the anxiously awaited report, I should be fast asleep in my first class cabin somewhere over French Polynesia on my way to New Zealand. Send me an email on what happens.

TLT 2-4-14 a

TLT 2-4-14 b

FXY 2-4-14

SPX 2-4-14

VIX 2-4-14

Hula GirlsThe Nonfarm What?

https://www.madhedgefundtrader.com/wp-content/uploads/2014/02/Hula-Girls.jpg 269 409 Mad Hedge Fund Trader https://madhedgefundtrader.com/wp-content/uploads/2019/05/cropped-mad-hedge-logo-transparent-192x192_f9578834168ba24df3eb53916a12c882.png Mad Hedge Fund Trader2014-02-05 01:05:332014-02-05 01:05:33Three Charts That Will Turn the Markets
Mad Hedge Fund Trader

Three Corrections for the Price of One

Newsletter

I love this market action. For me, it means that we are setting up ideal entry points for a broad range of asset classes that will deliver another +67% year.

It will set up for you too, if you continue to read this letter.

What the market is in fact doing is giving us three corrections for the price of one. Remember the traditional September swoon that never happened, the worst trading month of the year? How about the forgotten ritual October crash? And the November dip that always precedes the December yearend rally?

Well guess what? After forgetting how to go down for the longest period of time, we are getting all three downturns compressed into a single big one. That will give us a start finish decline of 7.2% in the (SPX) down to 1730, in line with every correction of the past two years (see chart below), and worst case the proverbial 10% textbook correction.

If my assumptions are correct, then in a worst-case scenario we are already 75% through this pullback on a price basis, and 65% on a time basis. Needless to say, selling short stocks here is out of the question. That train left the station at New Years.

After sitting on my hands, shuffling the papers around my desk several times, and going for my umpteenth coffee refill, I finally pulled the trigger on my iShares Barclays 20+ Year Treasury Bond Fund June, 2014 $106 puts trade. It finally entered no brainer territory.

It hit me what had been driving markets this year, but it took a ten-pound sledgehammer to do it.

Bonds have had it absolutely right this year. They took off right out of the gate on January 2 and never looked back.

Stocks on the other hand have been much more confused and disoriented, like an airplane pilot doing aerobatics on Instrument Flight Rules. They initially rose a little bit, right along with bonds, which almost never happens. You knew that wasn?t going to last.

Then they flat lined for two weeks. It took almost a month before traders realized that the punch bowl was gone and it was time to head into ?RISK OFF? mode. The tardy call can be traced to the fact that you calculate your average stock traders? IQ by taking a bond trader?s and then dividing by two.

What all this means is that the bond market has been correctly calling market direction two weeks before the stock market has. This is bound to continue.

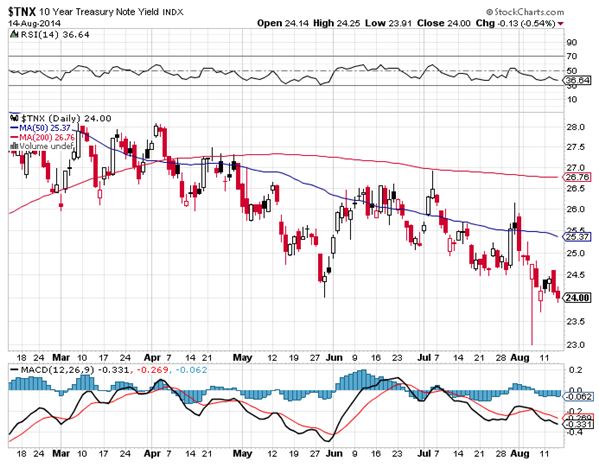
There is another factor to consider here. Bond traders have now seen a whopping great eight point rally in a month, taking the yield on the ten year Treasury bond down a massive 45 basis points, from 3.05% to 2.61%. That is just too much profit to sit on.

That is a world ending performance for bonds. Except that Armageddon, it is not. So the pros that got this one right are increasingly going to be sellers on rallies from here on.

Don?t forget that the Federal Reserve will probably continue to knock $10 billion off of its quantitative easing program every six weeks if the economic data continues to come in, as I expect. That could drop its monthly bond purchases from $85 billion a month in December to only $35 billion by June. This is not good for the (TLT). It?s nice to see all of those lunches at the Federal Reserve Bank of San Francisco with the new chairman, Janet Yellen, finally paying off.

If I am wrong on this one, it will be only by a couple of basis points, with the ten year possibly making it to the high 2.50%?s. The global synchronized economic recovery is still on schedule. The economic data and corporate earnings are just too good to see yields drop to 2.50% or lower.

Bull markets don?t die of old age, they die from recessions, and there is absolutely none on the horizon. The weakness in emerging markets is happening because some of their growth is moving back to the US. That is bad for them and great for us. I never liked their food anyway.

Markets also don?t peak at the middle of historic valuation range of 9-22. We are now at 14.5 if the $120/share earnings forecast for 2014 is good.

Profit margins are at all time highs, and rising (see chart below). The heart-rending volatility we have seen so far in 2014 is therefore technical in nature, and not fundamentally driven. It is just a matter of a few days or weeks until the fundamentals reassert themselves, as they always do.

Strip out the drag of government spending, and the private sector is growing at a positively meteoric 5.1% annual rate.

That could happen as early as Friday, when a blockbuster nonfarm payroll is expected to hit. The shocking 84,000 December number reported in January was a weather driven anomaly. Expect this week?s January figure to come in strong, as well as providing big upward revisions to the December report.

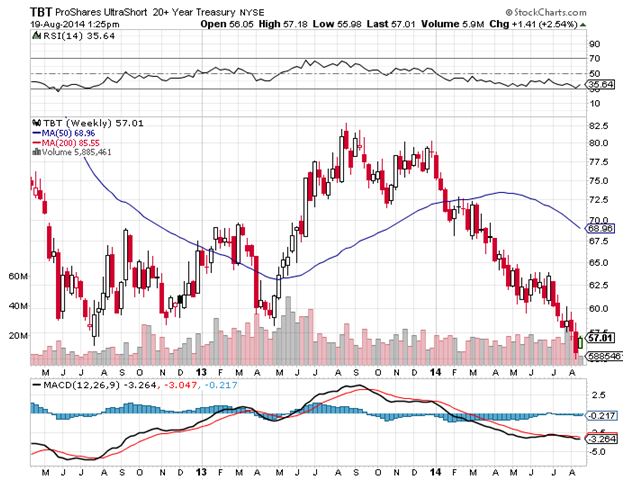
Which brings me to the iShares Barclays 20+ Year Treasury Bond Fund June, 2014 $106 put. Only a global synchronized recession would prevent the (TLT) from trading below $103.58, my breakeven point on an expiration basis, over the next five months. Those who can?t buy options can substitute the ProShares Ultra Short 20+ Treasury ETF (TBT) instead.

If the (TLT) makes it back to unchanged on the year at $101 by the June 20 expiration, this position will be up $5,418, or $5.41% for our notional $100,000 portfolio. If it makes it down to $101 sooner, we will make even more money, as there will still put some remaining time value in the put option.

That is up 108% from my initial cost. For that I am willing to take a few basis points of heat for a few days or weeks. It is an ideal buy and hold position, like, for example, you were just about to take a long trip to New Zealand and Australia.

Sounds like a no brainer to me!

Markets Chart of the Day 1-30-14

SPX 1-31-14

TLT 2-3-14

TBT 2-3-14

fat+lady+singsThe Fat Lady is Singing for the Bond Market

0 0 Mad Hedge Fund Trader https://madhedgefundtrader.com/wp-content/uploads/2019/05/cropped-mad-hedge-logo-transparent-192x192_f9578834168ba24df3eb53916a12c882.png Mad Hedge Fund Trader2014-02-04 01:05:212014-02-04 01:05:21Three Corrections for the Price of One
Mad Hedge Fund Trader

A few Thoughts on Trading Strategy

Newsletter

After one of the wildest rides in recent memory, the stock market has ground to a complete halt. So have virtually all other asset classes as well.

You can see this in the activity of my Trade Alert service as well. After sending out Alerts as fast as I could write them for the past three months, some three or four a day, the action has slowed to a snails pace. What gives?

I think that the sudden, universal optimism we saw break out all over in November and December ended up pulling performance out of 2014 back into 2013. Traders were picking up positions not only for the yearend rally, but the January one as well.

As a result, there is nothing for us to do in January. Our New Year asset reallocation rally happened last month. The net result has been one of the most boring starts to a new year in history, with trading confined to tortuous, frustrating low volume ranges.

What have been the best performing assets so far in 2014? Gold (GLD), gold miners (GDX), (ABX), and bonds (TLT), (TBT), the worst performing ones of 2013. Don?t get your hopes up. These are only dead cat bounces prompted by short covering with broader, longer term bear markets.

In the meantime, the stars of last year have become the dogs of this year, like consumer cyclicals and banks. Suddenly, it has become an upside-down world, with the good becoming bad, and the bad good. Don?t expect this to last. It never does.

It gets worse. What if we didn?t pull forward only in January and the end of last year, but February and March as well? We could be sitting back on our haunches for quite a long time. Sounds like a good time to catch up on those old back issues of Diary of a Mad Hedge Fund Trader that we didn?t have time to read because trading was too frenetic.

As for me, I am getting an early start on my tax returns this year so I can figure out how much my Obamacare is going to cost me. Thanks to my spectacular, once in a lifetime performance in 2013, Uncle Sam and I have quite a lot to talk about. What? You mean a $2,000 bottle of wine purchased in Portofino on the Italian Riviera (the seaside resort featured in The Wolf of Wall Street) is not deductible? If it is for Morgan Stanley, why not me?

Another reason for the sudden silence is that investors have suddenly become very cautious. We have just had a run for the ages. From my June 14 low I made a staggering 41.15% profit for my followers. My last 14 consecutive Trade Alerts have been profitable, as has every one so far in 2014. Those are serious numbers. While almost no one else matched these numbers, quite a few traders did well too.

Suddenly protecting performance has become far more important than catching that next marginal trade. When everyone else is in the same boat, markets go very quiet, until the boat tips over.

Things aren?t going to remain this dead forever. It reminds me of a witticism voiced by President Nixon?s chairman of the Council of Economic Advisors, Herbert Stein: ?If something cannot go on forever, it will stop.?

When the Trade Alert traffic dies down, I get barraged by daily complaints from readers that I?ve gotten lazy, I?ve gotten too rich to focus on this anymore, and that I ought to be doing more. Can you blame them? With an 85% success rate with my Alerts, who wouldn?t want more?

One of the reasons that my success rate is one of the highest in the industry is that I know when to quit trading. Some 45 years trading the markets has taught me one thing. If you chase a trade that?s not there it?s a perfect formula for losing money. There is no law stating that you always must have a position. That?s what brokers want you to do, a mug?s game at best.

My advice to you? Go out and spend some of the hard earned money you made last year from my Trade Alert Service. I understand there are great deals to be had on large screen HD TV?s at Best Buy. Unfortunately, my hometown San Francisco 49ers blew a playoff game in the last 22 seconds, depriving me from a trip to New York for Super Bowl XLVIII. But if you?re from Seattle or Denver, you definitely have something better to do for the week leading up to February 2.

Out With the Old?

INDU 1-23-14

XLY 1-23-14

And In With The New...

ABX 1-23-14

TLT 1-23-14

Football-49er-SeahawksThere Goes My Super Bowl Trip

https://www.madhedgefundtrader.com/wp-content/uploads/2014/01/Football-49er-Seahawks.jpg 400 388 Mad Hedge Fund Trader https://madhedgefundtrader.com/wp-content/uploads/2019/05/cropped-mad-hedge-logo-transparent-192x192_f9578834168ba24df3eb53916a12c882.png Mad Hedge Fund Trader2014-01-24 01:04:402014-01-24 01:04:40A few Thoughts on Trading Strategy
Mad Hedge Fund Trader

Why I?m Keeping My Bond Shorts

Newsletter

The Department of Labor took the punch bowl away from the party on Friday, reporting that the December nonfarm payroll came in at an anemic 74,000. Analyst forecasts had been running in the 200,000-250,000 range.

What was even more interesting was that the labor participation rate dropped to a 1978 low, with nearly 400,000 workers disappearing from the rolls. This is what took the headline unemployment rate down to 6.7%, off a whopping 0.3% from November. The Fed 6.5% target looms.

It was happy days again for the bond market, which had been beaten like a red headed stepchild since the summer. The relief rally spread to the entire high yield space, including corporates (LQD), munis (MUB), Junk bonds (HYG), (JNK), master limited partnerships (LINE), and even construction stocks (ITB).

The weather seems to be a big factor. When consumers and employers are sitting at home, freezing their keisters off, they aren?t hiring. This was not just a one off storm. It appears that this will be one of the coldest winters in history, except on the west coast, which is facing a 100 year drought. For proof, look no further than the price of natural gas (UNG), which appears to have broken out of a multiyear torpor.

The calendar was also an issue. Thanks to the compressed placement of the Thanksgiving, Christmas, and New Years holidays, this was one of the shortest shopping seasons in history. This would especially impact the retail sector, which is big on seasonal hiring around then.

As for the participation rate, this is clearly an effect of the 80 million retiring baby boomers. Some 10,000 a day are now collecting their gold watches and hitting the golf course. This drain of workers will continue until we are all dead in 2030. Once people retire, they tend to never reenter the labor force again. Can you blame them?

The bottom line here is that you need to look at the headline unemployment rate, which is fabulous, and not the gross nonfarm payroll numbers, which are dire. Whatever we lost in the nonfarm this month we will make back in large upward revisions next month. This has been the pattern of the past year. So mark February 7 on you calendar with bold red ink.

In fact, all of the recent employment numbers have been behaving as if they are still on their New Year?s Eve drinking binge, exhibiting extraordinary volatility. These could be just statistical outliers. More likely is that the epochal changes now besetting the long-term structure of the US economy, such as the simultaneous implementation of Obamacare and the lurch towards US energy independence, can?t be captured by traditional data collection means. Combined, these account for 24% of American GDP.

All of this leads me to believe that the current pop in bond prices and dip in yields will be a temporary affair. I?m sorry, but I?m just not buying the world that the bond market is currently anticipating, that of a massive shift of money out of stocks into bonds, and the return of inflation moving out another decade. The truth is that there still is no other decent place to put your money than large cap us stocks, thanks to the efforts of the Federal Reserve.

The stock market is not buying this scenario either. It barely budged, and closed up on Friday. More importantly, the volatility index (VIX) plunged to a new six month low at an amazing 11.5% on Monday. This instrument at these prices is betting that stocks will be sideways to up for the next 30 days.

As for my own model-trading portfolio, I would be selling short bonds here with both hands if that I did not already have a position. The problem is that I do, owning the iShares Barclays 20+ Year Treasury Bond Fund January, 2014 $104-$107 bear put spread, which expires at the close in four days on January 17. This is what remains from a $106-$109 put spread, which I profitably rolled down on December 27.

In a perfect world, I would have taken profits on this position on January 3, when it was showing a 0.53% profit. It would have been prudent to take the belated Christmas gift, given that a nonfarm payroll was due a week later. But I didn?t. Everyone got it wrong. But that seems to be par for the course these days, continuing with the golf analogy.

I do have the luxury of carrying my losing bond short against a portfolio of nine other positions, some of which I have already taken profits on, which will still leave me up big on the month. This is why they have the term ?hedge? in hedge fund. So I am relaxed.

However, it is proof once again that even after spending 45 years mastering the art of trading, I can still make mistakes typical of a first year summer intern.

Markets Chart of the Day

TNX 1-10-14

TLT 1-13-14

TLT 1-10-14

ITB 1-10-14

Shorts on Clothes lineLong May They Wave

https://www.madhedgefundtrader.com/wp-content/uploads/2014/01/Shorts-on-Clothes-line.jpg 338 449 Mad Hedge Fund Trader https://madhedgefundtrader.com/wp-content/uploads/2019/05/cropped-mad-hedge-logo-transparent-192x192_f9578834168ba24df3eb53916a12c882.png Mad Hedge Fund Trader2014-01-14 01:04:092014-01-14 01:04:09Why I?m Keeping My Bond Shorts
Mad Hedge Fund Trader

My Market Take for the Rest of 2014

Newsletter

I can?t believe how fast the year has gone by. It seems like only yesterday that I was riding the transcontinental railroad from Chicago to San Francisco, writing my 2013 All Asset Class Review. Now 2014 is at our doorstep.

As usual, the market has got it all wrong. There is not going to be a taper by the Federal Reserve next week. If there is, it will be only $5-$10 billion, which means that $70-$75 billion a month in Fed bond buying continues. Either way it is a win-win.

However, managers are eternally loath to trade against an unknown, hence the weakness we are seeing this week. I think that we have entered another one of those sideways corrections that has been a hallmark of the market all year, and that there is a reasonable chance that we saw the low of the entire move down this morning at 1,780 in the S&P 500.

That sets up a dead, range trading market into the Fed decision next Wednesday afternoon. Once their Solomon like choice is out, it will be off to the races for the markets once again, probably all the way until 2014.

However, we are heading in the Christmas holidays, when volume and volatility shrivel to a shadow of its former selves, with daily ranges often falling within 50 Dow points. So it is important to have a large short volatility element to your portfolio.

That way, you will make money on every flat day, of which there should be many. That?s why I have 70% of my current model-trading portfolio invested in call spreads.

My current holding in the (SPY) has me profitable at all points above $175.68. If we move below that, any losses should be more than offset by profits thrown off by the rest of the portfolio. The same is true for my call spread in the financial ETF (XLF).

The Japanese yen is clearly in free fall, probing new lows almost every day. That should take the (FXY) to $95, and explains my triple weight 30% holding in the area. Bonds (TLT) just can?t get a break, failing to rally over $105 for the third time. Lower levels beckon, making my bear put spread look pretty good, my second one this month.

With a dramatically weakening yen, you have to add to Japanese equities, which will benefit hugely. That?s why I doubled up on my position in Masayoshi Son?s Softbank (SFTBY) this morning. The day they announce the Ailibaba IPO, probably early next year, these shares should be up 10%-20%.

To summarize, this portfolio is perfectly set up for the following: ?A sideways move for four more trading days, then an upside breakout after the Fed decision, then going to sleep inside a slow grind up over Christmas and New Years.

The grand finale should come on January 2, the first trading day of 2014, when I expect the value of the portfolio to pop a full 5% or more. This will be delivered by a massive new wave of capital into the markets, which for calendar and legal reasons couldn?t be invested until this day.

What will they buy? Everything that worked last year. After all, that?s why these managers were hired. Why not start the New Year with a bang, and then spend the rest of the year trading against that profit.

It certainly worked this year.

PerfChart

MHFT Trading Book

SPY 12-12-13

TLT 12-12-13

FXY 12-12-13

AAPL 12-12-13

SFTBY 12-12-13

Zephyr

JT & conductor

JT at workHas It Been That Long?

https://www.madhedgefundtrader.com/wp-content/uploads/2013/01/Zephyr.jpg 342 451 Mad Hedge Fund Trader https://madhedgefundtrader.com/wp-content/uploads/2019/05/cropped-mad-hedge-logo-transparent-192x192_f9578834168ba24df3eb53916a12c882.png Mad Hedge Fund Trader2013-12-13 01:05:282013-12-13 01:05:28My Market Take for the Rest of 2014
Mad Hedge Fund Trader

Selling Bonds Again

Newsletter

You all know well my antipathy to the bond market, which I believe hit a 60-year peak on August 18, 2012 at 10:32 AM EST. I managed to catch the exact top of the one-month post taper bond market rally, and sent the Trade Alerts to sell bonds showering upon you. I quickly closed all of those out for nice profits.

We have since seen a $2.24 dead cat bounce in the (TLT) that took the yield on the ten year Treasury bond back down to 2.68%, off of the recent 2.77% top. That is enough for me to sell into.

Take a look at the chart below, and you will see that we are probably setting up an interim head and shoulders top that presages much larger moves lower to come.

The rocket fuel for this break will be the yearend selling where money managers attempt to minimize their bond exposure that appears in their annual reports so as not to appear too stupid to their customers. Then we have the ?Great Reallocation? trade out of bonds into stocks, which should get some real legs in 2014.

This all promises to take the (TLT) down from today?s $104.51 to $98 or lower over the next six months. If I am wrong on this, then we should hit major resistance for the (TLT) on the upside at $106.80, where you would expect the right shoulder formation to begin that will carry us safely into the December 20 expiration. This could be the trade that keeps on giving.

If you can?t do the options, you can buy the ProShares Ultra Short 20+ Year Treasury leveraged short ETF (TBT) on the dip. My very long-term target for this baby is $200, up from today?s $76.70.

TLT 11-15-13

TBT 11-15-13

Girl-SadBonds Have Suddenly Become Unloved

https://www.madhedgefundtrader.com/wp-content/uploads/2013/11/Girl-Sad.jpg 329 527 Mad Hedge Fund Trader https://madhedgefundtrader.com/wp-content/uploads/2019/05/cropped-mad-hedge-logo-transparent-192x192_f9578834168ba24df3eb53916a12c882.png Mad Hedge Fund Trader2013-11-18 01:03:272013-11-18 01:03:27Selling Bonds Again
Mad Hedge Fund Trader

You Just Can?t Keep America Down

Newsletter

You just can?t keep America down. That is the overwhelming message from Friday?s blockbuster October nonfarm payroll showing that 204,000 jobs were added, double the industry forecasts. The headline unemployment rate ratcheted back up from 7.2% to 7.3%, the first gain in many months.

August and September were revised up by an eye popping 60,000 jobs. October private sector job growth came in at a stunning 212,000. Apparently, the prospect of an imminent default by the US government prompted many corporate managers to rush out and hire! Go figure.

Without the Washington shutdown we probably would have seen a 300,000 print. It appears that 223,000 federal workers were temporarily laid off, but later received back pay, so they weren?t counted as jobless.

Leisure and hospitality was up an unbelievable 53,000. Retail added 44,000. Professional and technical services tacked on 21,000. Health care increased by 12,000 jobs, anticipating an onslaught of 30 million new customers with government guaranteed payments, thanks to Obamacare.

It confirms what I have been arguing since the summer, that the US economy is far stronger than anyone suspects, and that we are accelerating with an upward trajectory. This is the recurring theme that I get from speaking to dozens of CEO?s every month, whose views on the health of their own business usually beat the government data releases by 3-6 months. Believe me, I don?t talk to these guys because they wear snappy suits.

Of course, the initial market reaction was negative, since the good news is seen as advancing the Federal Reserve?s tapering of its quantitative easing program. This certainly was the read by the stock market on Thursday, when a surprise interest cut in the Euro and a blistering 2.8% Q3 GDP report triggered a 150 sell off in the Dow. Gold took it on the nose again, dropping $25. But we made it all back, and more, the next day, disproving this analysis, for everything, except gold.

Bonds really took it in the keister, the (TLT) dropping two and a half full points, bumping ten year Treasury yield up from 2.60% to 2.77%, one of the most extreme pops of the year in the fixed income markets. I came within a hair?s breadth of doubling my bond shorts the previous day, but decided to wait for the payroll report. This time, discretion was not the better part of valor.

If anyone had any doubts about the extreme, but underestimated strength of the economy, better take a look at the chart below of growth of the broader monetary aggregates. We are running at a nearly white hot 40% YOY growth rate.

This reflects a huge increase that is occurring in the velocity of money, a number that almost no one tracks, in addition to the Federal Reserve?s never ending monetary expansion. This is because more people everywhere are doing more business with each other. Despite what you hear in the media, confidence is rocketing. This eventually has to feed into higher reported GDP growth rates and will justify ever-higher share prices.

How many individual investors believe this? Almost no one. This year, $114 billion has trickled back into equity mutual funds. That is only a dent in the $600 billion this group tore out of equity mutual funds over the last five years. That fact alone should be worth another 25% of upside in the indexes.

For more depth on the rapidly evolving fundamentals in the economy, click here for my recent piece on ?The Rising Risk of a Market Melt Up?.

TLT 11-8-13

Adjusted Monetary Base

Uncle Sam - FistIn Better Shape Than He Looks

0 0 Mad Hedge Fund Trader https://madhedgefundtrader.com/wp-content/uploads/2019/05/cropped-mad-hedge-logo-transparent-192x192_f9578834168ba24df3eb53916a12c882.png Mad Hedge Fund Trader2013-11-12 01:04:322013-11-12 01:04:32You Just Can?t Keep America Down
Mad Hedge Fund Trader

Mad Hedge Fund Trader Blasts to new All Time High

Diary, Newsletter

The Trade Alert service of the Mad Hedge Fund Trader has posted a new all time high in performance, taking in 46.05% so far in 2013. The three-year return is an eye popping 101.7%, taking the averaged annualized return to 35%. That compares to a far more modest increase for the Dow Average during the same period of 19%.

This has been the profit since the groundbreaking trade mentoring service was launched 35 months ago. These numbers place me at the absolute apex of all hedge fund managers, where the year to date gains have been a far more pedestrian 3%.

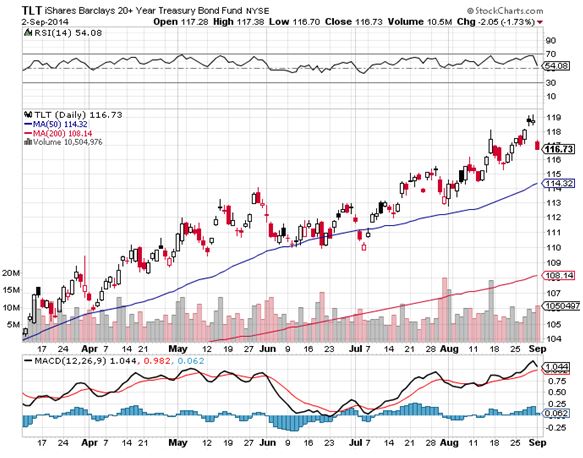
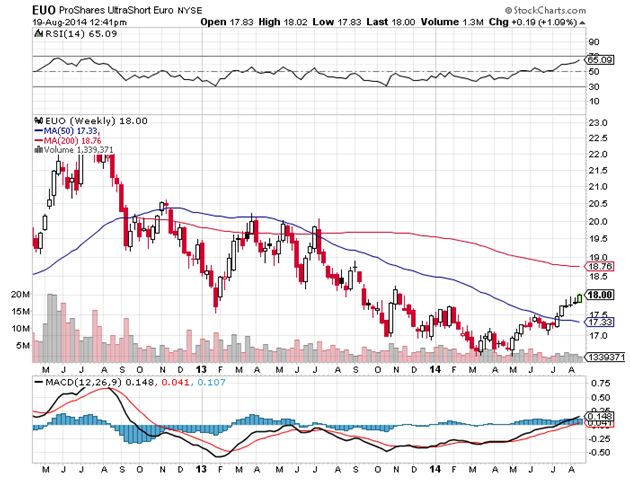
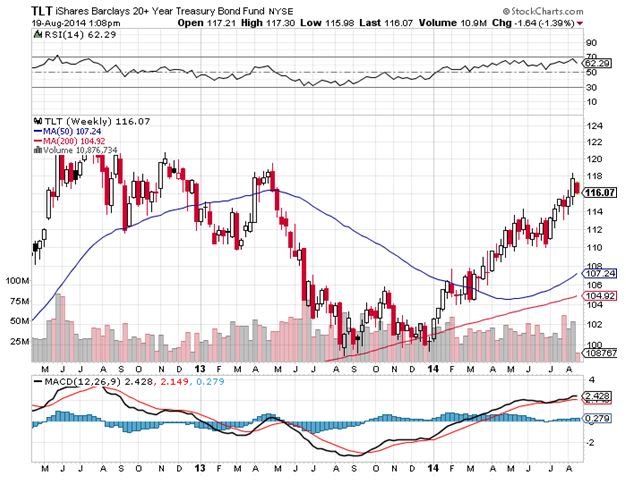
These numbers come off the back of a blistering week in the market where I added 5% in value to my model-trading portfolio. I called the top in the bond market on Monday, shorted the Treasury bond ETF (TLT), and bought the short Treasury ETF (TBT). Prices then collapsed, taking the ten-year Treasury bond yield from 2.47% to 2.63%.

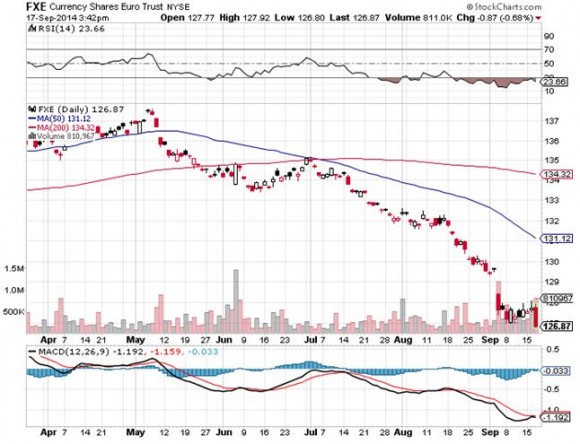
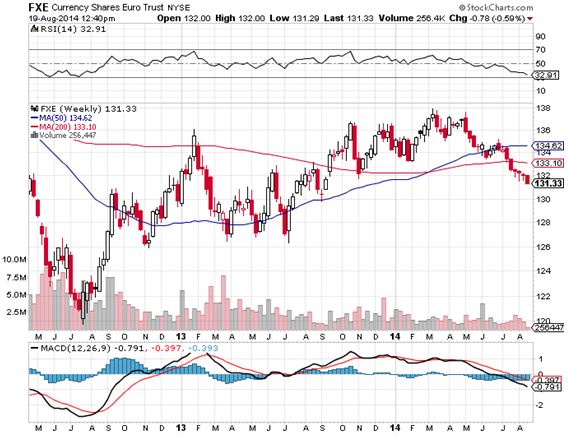
I then pegged the top of the Euro (FXE) against the dollar, betting that the European Central Bank would have to cut interest rates to head off another recession. Since then, the beleaguered continental currency has plunged from $1.3700 to $1.3350 to the buck.

I then bet that the stock market would enter another tedious sideways correction going into the Thanksgiving holidays. I bought an in the money put spread on the S&P 500, and then bracketed the index through buying an in the money call spread.

Carving out the 2013 trades alone, 57 out of 71 have made money, a success rate of 80%. It is a track record that most big hedge funds would kill for.

This performance was only made possible by correctly calling the near term direction of stocks, bonds, foreign currencies, energy, precious metals and the agricultural products. It all sounds easy, until you try it.

My esteemed colleague, Mad Day Trader Jim Parker, has also been coining it. He caught a spike up in the volatility index (VIX) by both lapels. He also was a major player on the short side in bonds.

The coming winter promises to deliver a harvest of new trading opportunities. The big driver will be a global synchronized recovery that promises to drive markets into the stratosphere in 2014. The Trade Alerts should be coming hot and heavy.

Global Trading Dispatch, my highly innovative and successful trade-mentoring program, earned a net return for readers of 40.17% in 2011 and 14.87% in 2012. The service includes my Trade Alert Service and my daily newsletter, the Diary of a Mad Hedge Fund Trader. You also get a real-time trading portfolio, an enormous trading idea database, and live biweekly strategy webinars, order?Global Trading Dispatch PRO?adds Jim Parker?s?Mad Day Trader?service.

To subscribe, please go to my website at www.madhedgefundtrader.com, find the ?Global Trading Dispatch? or "Mad Hedge Fund Trader PRO" box on the right, and click on the blue ?SUBSCRIBE NOW? button.

TA Performance YTD

FXE 11-1-13

TLT 11-1-13

TBT 11-1-13

SPY 11-1-13

Jim ParkerMad Day Trader Jim Parker

https://www.madhedgefundtrader.com/wp-content/uploads/2013/11/TA-Performance-YTD.jpg 699 490 Mad Hedge Fund Trader https://madhedgefundtrader.com/wp-content/uploads/2019/05/cropped-mad-hedge-logo-transparent-192x192_f9578834168ba24df3eb53916a12c882.png Mad Hedge Fund Trader2013-11-08 10:10:562013-11-08 10:10:56Mad Hedge Fund Trader Blasts to new All Time High
Page 99 of 102«‹979899100101›»

tastytrade, Inc. (“tastytrade”) has entered into a Marketing Agreement with Mad Hedge Fund Trader (“Marketing Agent”) whereby tastytrade pays compensation to Marketing Agent to recommend tastytrade’s brokerage services. The existence of this Marketing Agreement should not be deemed as an endorsement or recommendation of Marketing Agent by tastytrade and/or any of its affiliated companies. Neither tastytrade nor any of its affiliated companies is responsible for the privacy practices of Marketing Agent or this website. tastytrade does not warrant the accuracy or content of the products or services offered by Marketing Agent or this website. Marketing Agent is independent and is not an affiliate of tastytrade. 

Legal Disclaimer

There is a very high degree of risk involved in trading. Past results are not indicative of future returns. MadHedgeFundTrader.com and all individuals affiliated with this site assume no responsibilities for your trading and investment results. The indicators, strategies, columns, articles and all other features are for educational purposes only and should not be construed as investment advice. Information for futures trading observations are obtained from sources believed to be reliable, but we do not warrant its completeness or accuracy, or warrant any results from the use of the information. Your use of the trading observations is entirely at your own risk and it is your sole responsibility to evaluate the accuracy, completeness and usefulness of the information. You must assess the risk of any trade with your broker and make your own independent decisions regarding any securities mentioned herein. Affiliates of MadHedgeFundTrader.com may have a position or effect transactions in the securities described herein (or options thereon) and/or otherwise employ trading strategies that may be consistent or inconsistent with the provided strategies.

Copyright © 2025. Mad Hedge Fund Trader. All Rights Reserved. support@madhedgefundtrader.com
  • Privacy Policy
  • Disclaimer
  • FAQ
Scroll to top