While the Diary of a Mad Hedge Fund Trader focuses on investment over a one week to six-month time frame, Mad Day Trader, provided by Jim Parker, will exploit money-making opportunities over a brief ten minute to three day window. It is ideally suited for day traders, but can also be used by long-term investors to improve market timing for entry and exit points. Read more
Global Market Comments
January 16, 2015
Fiat Lux
Featured Trade:
(SWISS SURPRISE RATTLES MARKETS)
(FXF), (FXE), (EUO)
(FRIDAY, APRIL 3 HONOLULU, ALASKA, WASHINGTON, OREGON, BRITISH COLUMBIA, JAPAN, AND CHINA STRATEGY LUNCHEON)
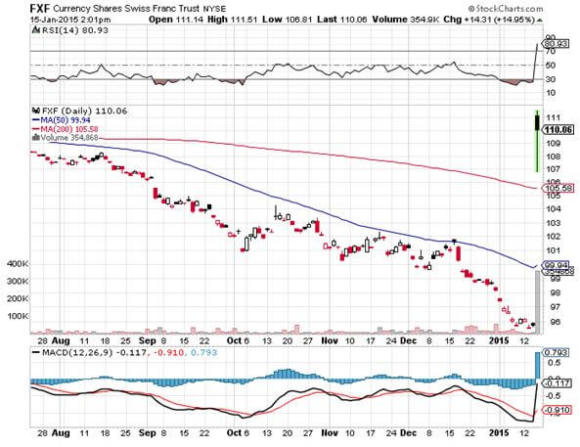
CurrencyShares Swiss Franc ETF (FXF)
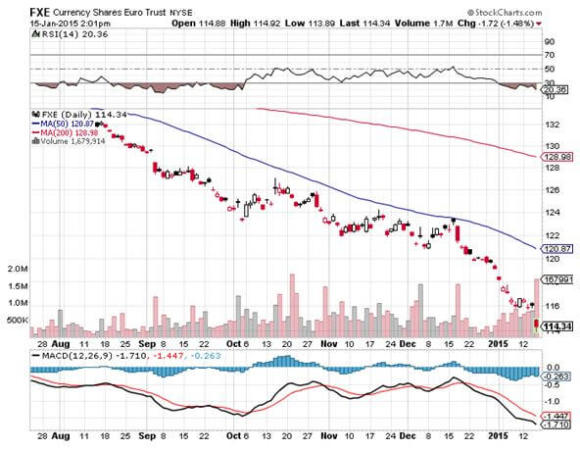
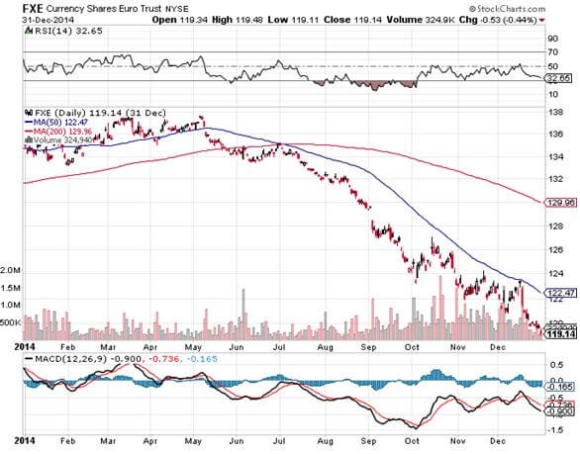
CurrencyShares Euro ETF (FXE)
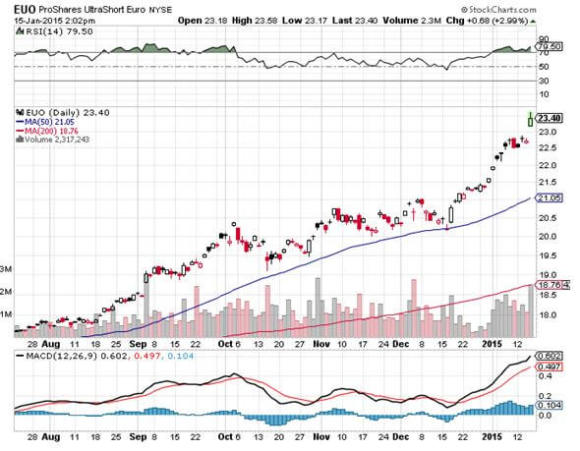
ProShares UltraShort Euro (EUO)

It was one of those moves that appeared so gigantic and so unreal that you had to blink, while checking the cables on the back of your computer and your broadband connection.
The Swiss franc has just skyrocketed by 17% against the dollar in one tick.
First the bad news: the rent on my summer chalet in Zermatt, Switzerland had just risen by 17%.
And the good news? Holders of the ProShares Ultra Short Euro ETF (EUO), which I have been pounding the table on for the past seven months, just instantly appreciated by nearly 10%.
In a market that rarely sees moves of more than 1% a day, 17% is positively earth shaking, if not unbelievable.
A quick scan of my Bloomberg revealed that the Swiss National Bank had eliminated its cap against the Euro. Until now, the central bank had been buying Euros and selling Swiss francs to keep its own currency from appreciating.
This was to subsidize domestic exports of machinery, watches, cheese, and chocolate with an artificially undervalued currency.
The SNB?s move essentially converts the country to a free float with its currency, hence the sudden revaluation. Switzerland has thus run up the white flag in the currency wars, the inevitable outcome for small countries in this game.
One wonders why the Swiss made the move. Their emergency action immediately knocked 10% off the value of the Swiss stock market (which is 40% banks), and 20% off some single names.
I was kind of pissed when I heard the news. Usually I get a heads up from someone in a remote mountain phone booth when something is up in Switzerland. Not this time. There wasn?t even any indication that they were thinking of such a desperate act. Even IMF Director, Christine Lagarde, confessed a total absence of advance notice.
Apparently, the Swiss knew that eliminating the cap would have such an enormous market impact that they could not risk any leaks whatsoever.
This removes the world?s largest buyer of Euro?s (FXE) from the market, so the beleaguered currency immediately went into free fall. The last time I checked, the (FXE) had hit a 12 year low at $114, and the (EUO) was pawing at an all time high.
My prediction of parity for the Euro against the greenback, made only a few weeks ago in my 2015 Annual Asset Review (click here) were greeted as the ravings of a Mad man. Now it looks entirely doable, sooner than later.
The Germans have to be thinking ?There but for the grace of God go I?. If the European Community?s largest member exited the Euro, which has been widely speculated, the new Deutschmark would instantly get hit with a 20% appreciation, then another, and another.
Your low end, entry level Mercedes would see its price jump from $40,000 to $80,000. Kiss the German economy goodbye. Political extremism to follow.
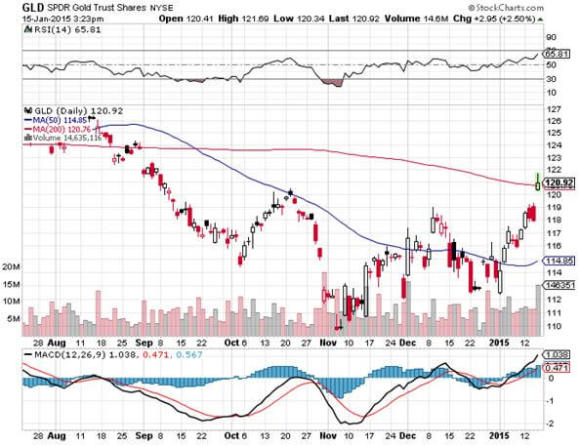
There was another big beneficiary of the Swiss action today. Gold (GLD) had its best day in years, at one point popping a gob smacking $40. After losing its way for years, the flight to safety bid finally found the barbarous relic.
It seems there is nowhere else to hide.
By the way, the rent on my Swiss chalet may not be going up that much. My landlord has already emailed me that whatever increase I suffer in the currency will be offset by a decline in the cost in local currency terms.
It seems that the almost complete disappearance of Russians from the European tourism market during the coming summer, thanks to the oil induced collapse of their economy, is emerging as a major drag on Alpine luxury rentals.
That?s the way it is in the currency world. What you make in one pocket, gets picked out of the other.
![John Thomas - Switzerland]() That Bratwurst is Suddenly More Expensive
That Bratwurst is Suddenly More Expensive

While the Diary of a Mad Hedge Fund Trader focuses on investment over a one week to six-month time frame, Mad Day Trader, provided by Jim Parker, will exploit money-making opportunities over a brief ten minute to three day window. It is ideally suited for day traders, but can also be used by long-term investors to improve market timing for entry and exit points. Read more
While the Diary of a Mad Hedge Fund Trader focuses on investment over a one week to six-month time frame, Mad Day Trader, provided by Jim Parker, will exploit money-making opportunities over a brief ten minute to three day window. It is ideally suited for day traders, but can also be used by long-term investors to improve market timing for entry and exit points. Read more
Global Market Comments
January 15, 2015
Fiat Lux
Featured Trade:
(2014 TRADE ALERT REVIEW),
(FXE), (EUO), (SPY), (AAPL), (GILD),
?(F), (GM), (TLT), (UNG), (VIX), (VXX)
CurrencyShares Euro ETF (FXE)
ProShares UltraShort Euro (EUO)
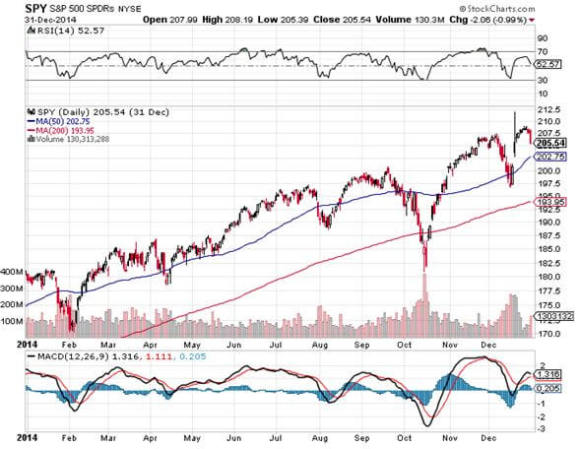
SPDR S&P 500 ETF (SPY)
Apple Inc. (AAPL)
Gilead Sciences Inc. (GILD)
Ford Motor Co. (F)
General Motors Company (GM)
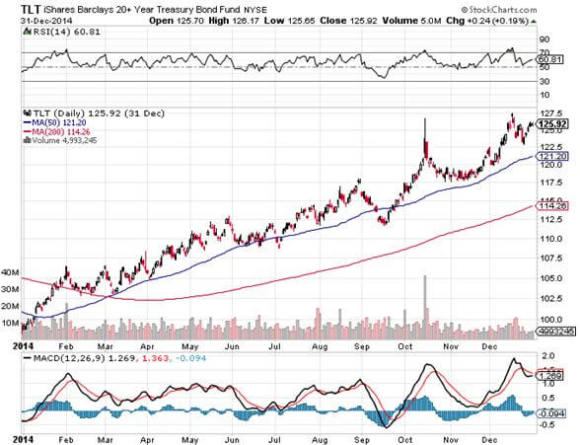
iShares 20+ Year Treasury Bond (TLT)
United States Natural Gas ETF (UNG)
VOLATILITY S&P 500 (^VIX)
iPath S&P 500 VIX ST Futures ETN (VXX)

When is the Mad Hedge Fund Trader a genius, and when is he a complete moron?
That is the question readers have to ask themselves whenever their smart phones ping, and a new Trade Alert appears on their screens.
I have to confess that I wonder myself sometimes.
So I thought I would run my 2014 numbers to find out when I was a hero, and when I was a goat.
The good news is that I was a hero most of the time, and a goat only occasionally. Here is the cumulative profit and loss for the 75 Trade Alerts that I closed during calendar 2014, listed by asset class.
Profit by Asset Class
Foreign Exchange 15.12%
Equities 12.52%
Fixed Income 7.28%
Energy 1.4%
Volatility -1.68%
Total 37.64%
Foreign exchange trading was my big winner for 2014, accounting for nearly half of my profits. My most successful trade of the year was in my short position in the Euro (FXE), (EUO).
I piled on a double position at the end of July, just as it became apparent that the beleaguered European currency was about to break out of a multi month sideway move into a pronounced new downtrend.
I then kept rolling the strikes down every month. Those who bought the short Euro 2X ETF (EUO) made even more.
The fundamentals for the Euro were bad and steadily worsening. It helped that I was there for two months during the summer and could clearly see how grotesquely overvalued the currency was. $20 for a cappuccino? Mama mia!
Nothing beats on the ground, first hand research.
Stocks generated another third of my profits last year and also accounted for my largest number of Trade Alerts.
I correctly identified technology and biotech as the lead sectors for the year, weaving in and out of Apple (AAPL) and Gilead Sciences (GILD) on many occasions. I also nailed the recovery of the US auto industry (GM), (F).
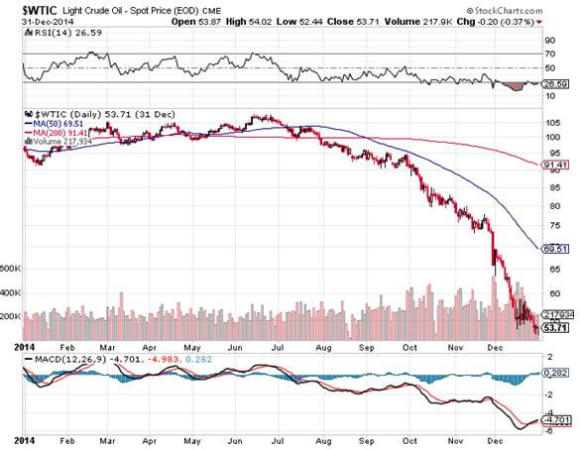
I safely stayed away from the energy sector until the very end of the year, when oil hit the $50 handle. I also prudently avoided commodities like the plague.
Unfortunately, I was wrong on the bond market for the entire year. That didn?t stop me from making money on the short side on price spikes, with fixed income chipping a healthy 7.28% into the kitty.
It was only at the end of the year, when the prices accelerated their northward trend that they started to cost me money. My saving grace was that I kept positions small throughout, doubling up on a single occasion and then coming right back out.
My one trade in the energy sector for the year was on the short side, in natural gas (UNG), selling the simple molecule at the $5.50 level. With gas now plumbing the depths at $2.90, I should have followed up with more Trade Alerts. But hey, a 1.4% gain is better than a poke in the eye with a sharp stick.
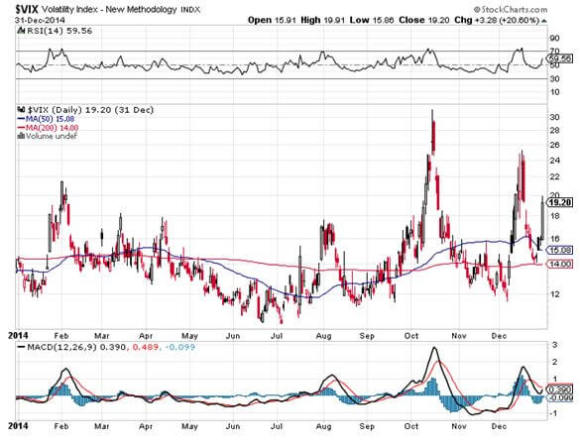
In which asset class was I wrong every single time? Both of the volatility (VIX) trades I did in 2014 lost money, for a total of -1.68%. I got caught in one of many downdrafts that saw volatility hugging the floor for most of the year, giving it to me in the shorts with the (VXX).
All in all, it was a pretty good year.
What was my best trade of 2014? I made 2.75% with a short position in the S&P 500 in July, during one of the market?s periodic 5% corrections.
And my worst trade of 2014? I got hit with a 6.63% speeding ticket with a long position in the same index. But I lived to fight another day.
After a rocky start, 2015 promises to be another great year. That is, provided you ignore my advice on volatility.
Here is a complete list of every trade I closed last year, sorted by asset class, from best to worse.
|
Date |
Position |
Asset Class |
Long/short |
? |
? |
? |
? |
? |
? |
|
7/25/14 |
(SPY) 8/$202.50 - $202.50 put spread |
equities |
long |
? |
? |
? |
? |
? |
2.75% |
|
10/16/14 |
(GILD) 11/$80-$85 call spread |
equities |
long |
? |
? |
? |
? |
? |
2.57% |
|
5/19/14 |
(TLT) 7/$116-$119 put spread |
fixed income |
long |
? |
? |
? |
? |
? |
2.48% |
|
4/4/14 |
(IWM) 8/$113 puts |
equities |
long |
? |
? |
? |
? |
? |
2.38% |
|
7/10/14 |
(AAPL) 8/$85-$90 call spread |
equities |
long |
? |
? |
? |
? |
? |
2.30% |
|
2/3/14 |
(TLT) 6/$106 puts |
equities |
long |
? |
? |
? |
? |
? |
2.27% |
|
9/19/14 |
(IWM) 11/$117-$120 put spread |
equities |
long |
? |
? |
? |
? |
? |
2.26% |
|
10/7/14 |
(FXE) 11/$127-$129 put spread |
foreign exchange |
long |
? |
? |
? |
? |
? |
2.22% |
|
9/26/14 |
(IWM) 11/$116-$119 put spread |
equities |
long |
? |
? |
? |
? |
? |
2.21% |
|
4/17/14 |
(TLT) 5/$114-$117 put spread |
fixed income |
long |
? |
? |
? |
? |
? |
2.10% |
|
8/7/14 |
(FXE) 9/$133-$135 put spread |
foreign exchange |
long |
? |
? |
? |
? |
? |
2.07% |
|
10/2/14 |
(BAC) 11/$15-$16 call spread |
equities |
long |
? |
? |
? |
? |
? |
2.04% |
|
4/9/14 |
(SPY) 5/$191-$194 put spread |
equities |
long |
? |
? |
? |
? |
? |
2.02% |
|
10/15/14 |
(DAL) 11/$25-$27 call spread |
equities |
long |
? |
? |
? |
? |
? |
1.89% |
|
9/25/14 |
(FXE) 11/$128-$130 put spread |
foreign exchange |
long |
? |
? |
? |
? |
? |
1.86% |
|
6/6/14 |
(JPM) 7/$52.50-$55.00 call spread |
equities |
long |
? |
? |
? |
? |
? |
1.81% |
|
4/4/14 |
(SPY) 5/$193-$196 put spread |
equities |
long |
? |
? |
? |
? |
? |
1.81% |
|
3/14/14 |
(TLT) 4/$111-$114 put spread |
fixed income |
long |
? |
? |
? |
? |
? |
1.68% |
|
10/17/14 |
(AAPL) 11/$87.50-$92.50 call spread |
equities |
long |
? |
? |
? |
? |
? |
1.56% |
|
10/15/14 |
(SPY) 11/$168-$173 call spread |
equities |
long |
? |
? |
? |
? |
? |
1.51% |
|
7/3/14 |
(FXE) 8/$138 put spread |
foreign exchange |
long |
? |
? |
? |
? |
? |
1.51% |
|
10/9/14 |
(FXE) 11/$128-$130 put spread |
foreign exchange |
long |
? |
? |
? |
? |
? |
1.48% |
|
9/19/14 |
(FXE) 10/$128-$130 put spread |
foreign exchange |
long |
? |
? |
? |
? |
? |
1.45% |
|
10/22/14 |
(SPY) 11/$179-$183 call spread |
equities |
long |
? |
? |
? |
? |
? |
1.44% |
|
5/29/14 |
(TLT) 7/$118-$121 put spread |
fixed income |
long |
? |
? |
? |
? |
? |
1.44% |
|
2/24/14 |
(UNG) 7/$26 puts |
energy |
long |
? |
? |
? |
? |
? |
1.40% |
|
2/24/14 |
(BAC) 3/$15-$16 call spread |
equities |
long |
? |
? |
? |
? |
? |
1.39% |
|
6/23/14 |
(SPY) 7/$202 put spread |
equities |
long |
? |
? |
? |
? |
? |
1.37% |
|
9/29/14 |
(SPY) 10/$202-$205 Put spread |
equities |
long |
? |
? |
? |
? |
? |
1.29% |
|
5/20/14 |
(AAPL) 7/$540 $570 call spread |
equities |
long |
? |
? |
? |
? |
? |
1.22% |
|
9/26/14 |
(SPY) 10/$202-$205 Put spread |
equities |
long |
? |
? |
? |
? |
? |
1.22% |
|
5/22/14 |
(GOOGL) 7/$480-$520 call spread |
equities |
long |
? |
? |
? |
? |
? |
1.16% |
|
5/19/14 |
(FXY) 7/$98-$101 put spread |
foreign exchange |
long |
? |
? |
? |
? |
? |
1.14% |
|
1/15/14 |
(T) 2/$35-$37 put spread |
equities |
long |
? |
? |
? |
? |
? |
1.08% |
|
3/3/14 |
(TLT) 3/$111-$114 put spread |
fixed income |
long |
? |
? |
? |
? |
? |
1.07% |
|
1/28/14 |
(AAPL) 2/$460-$490 call spread |
equities |
long |
? |
? |
? |
? |
? |
1.06% |
|
4/24/14 |
(SPY) 5/$192-$195 put spread |
equities |
long |
? |
? |
? |
? |
? |
1.05% |
|
6/6/14 |
(CAT) 7/$97.50-$100 call spread |
equities |
long |
? |
? |
? |
? |
? |
1.04% |
|
7/23/14 |
(FXE) 8/$134-$136 put spread |
foreign exchange |
long |
? |
? |
? |
? |
? |
0.99% |
|
8/18/14 |
(FXE) 9/$133-$135 put spread |
foreign exchange |
long |
? |
? |
? |
? |
? |
0.94% |
|
11/4/14 |
(BAC) 12/$15-$16 call spread |
equities |
long |
? |
? |
? |
? |
? |
0.88% |
|
4/9/14 |
(SPY) 6/$193-$196 put spread |
equities |
long |
? |
? |
? |
? |
? |
0.88% |
|
7/25/14 |
(SPY) 8/$202.50 -205 put spread |
equities |
long |
? |
? |
? |
? |
? |
0.88% |
|
6/6/14 |
(MSFT) 7/$38-$40 call spread |
equities |
long |
? |
? |
? |
? |
? |
0.87% |
|
10/23/14 |
(FXY) 11/$92-$95 puts spread |
foreign exchange |
long |
? |
? |
? |
? |
? |
0.86% |
|
7/23/14 |
(TLT) 8/$117-$120 put spread |
fixed income |
long |
? |
? |
? |
? |
? |
0.81% |
|
3/5/14 |
(DAL) 4/$30-$32 Call spread |
equities |
long |
? |
? |
? |
? |
? |
0.76% |
|
4/10/14 |
(VXX) long volatility ETN |
equities |
long |
? |
? |
? |
? |
? |
0.76% |
|
1/30/14 |
(UNG) 7/$23 puts |
equities |
long |
? |
? |
? |
? |
? |
0.66% |
|
4/1/14 |
(FXY) 5/$96-$99 put spread |
foreign currency |
long |
? |
? |
? |
? |
? |
0.60% |
|
1/15/14 |
(TLT) 2/$108-$111 put spread |
equities |
long |
? |
? |
? |
? |
? |
0.47% |
|
3/6/14 |
(EBAY) 4/$52.50- $55 call spread |
equities |
long |
? |
? |
? |
? |
? |
0.24% |
|
10/14/14 |
(TBT) short Treasury Bond ETF |
fixed income |
long |
? |
? |
? |
? |
? |
0.22% |
|
3/28/14 |
(VXX) long volatility ETN |
equities |
long |
? |
? |
? |
? |
? |
0.20% |
|
7/17/14 |
(TBT) short Treasury Bond ETF |
fixed income |
long |
? |
? |
? |
? |
? |
0.08% |
|
3/26/14 |
(VXX) long volatility ETN |
equities |
long |
? |
? |
? |
? |
? |
0.06% |
|
7/8/14 |
(TLT) 8/$115-$118 put spread |
fixed income |
long |
? |
? |
? |
? |
? |
-0.18% |
|
4/28/14 |
(SPY) 5/$189-$192 put spread |
equities |
long |
? |
? |
? |
? |
? |
-0.45% |
|
3/5/14 |
(GE) 4/$24-$25 call spread |
equities |
long |
? |
? |
? |
? |
? |
-0.73% |
|
4/28/14 |
(VXX) long volatility ETN |
volatility |
long |
? |
? |
? |
? |
? |
-0.81% |
|
4/24/14 |
(TLT) 5/$113-$116 put spread |
fixed income |
long |
? |
? |
? |
? |
? |
-0.87% |
|
4/28/14 |
(VXX) long volatility ETN |
volatility |
long |
? |
? |
? |
? |
? |
-0.87% |
|
6/6/14 |
(IBM) 7/$180-$185 call spread |
equities |
long |
? |
? |
? |
? |
? |
-1.27% |
|
9/30/14 |
(SPY) 11/$185-$190 call spread |
equities |
long |
? |
? |
? |
? |
? |
-1.51% |
|
10/9/14 |
(TLT) 11/$122-$125 put spread |
fixed income |
long |
? |
? |
? |
? |
? |
-1.55% |
|
9/24/14 |
(TSLA) 11/$200 call spread |
equities |
long |
? |
? |
? |
? |
? |
-1.62% |
|
2/27/14 |
(SPY) 3/$189-$192 put spread |
equities |
long |
? |
? |
? |
? |
? |
-1.67% |
|
3/6/14 |
(BAC) 4/$16 calls |
equities |
long |
? |
? |
? |
? |
? |
-2.01% |
|
10/14/14 |
(SPY) 10/$180-$184 call spread |
equities |
short |
? |
? |
? |
? |
? |
-2.13% |
|
11/14/14 |
(BABA) 12/$100-$105 call spread |
equities |
short |
? |
? |
? |
? |
? |
-2.38% |
|
10/20/14 |
(SPY) 11/$197-$202 call spread |
equities |
short |
? |
? |
? |
? |
? |
-2.72% |
|
7/3/14 |
(GM) 8/$33-$35 call spread |
equities |
long |
? |
? |
? |
? |
? |
-2.91% |
|
3/7/14 |
(GM) 4/$34-$36 call spread |
equities |
long |
? |
? |
? |
? |
? |
-2.96% |
|
11/25/14 |
(SCTY) 12/47.50-$52.50 call spread |
equities |
long |
? |
? |
? |
? |
? |
-3.63% |
|
10/20/14 |
(SPY) 11/$197-$202 call spread |
equities |
short |
? |
? |
? |
? |
? |
-4.22% |
|
4/14/14 |
(SPY) 5/$188-$191 put spread |
equities |
long |
? |
? |
? |
? |
? |
-6.63% |
![John Thomas - Beach]() What a Year!
What a Year!


?The central bank put is alive and well in Washington, Brussels, and Tokyo? said Michael Block, from Rhino Trading.

As a potentially profitable opportunity presents itself, John will send you an alert with specific trade information as to what should be bought, when to buy it, and at what price. Read more

As a potentially profitable opportunity presents itself, John will send you an alert with specific trade information as to what should be bought, when to buy it, and at what price. This is your chance to ?look over? John Thomas? shoulder as he gives you unparalleled insight on major world financial trends BEFORE they happen. Read more