Featured Trade: (APRIL 20 WASHINGTON DC GLOBAL STRATEGY LUNCHEON), (WHERE THE ECONOMIST BIG MAC INDEX FINDS CURRENCY VALUE), (FXF), (FXE), (CYB), (THE FALLING MARKET FOR KIDS), (HOLLYWOOD CASHES IN ON WALL STREET TROUBLES)
CurrencyShares Swiss Franc ETF (FXF) CurrencyShares Euro ETF (FXE) WisdomTree Chinese Yuan Strategy ETF (CYB)
Come join me for the Mad Hedge Fund Trader?s Global Strategy Luncheon which I will be conducting in Washington DC on Wednesday, April 20, 2016.
A three-course lunch will be followed by an extended question and answer period.
I?ll be giving you my up to date view on stocks, bonds, foreign currencies, commodities, precious metals, and real estate.
And to keep you in suspense, I?ll be tossing a few surprises out there too. Enough charts, tables, graphs, and statistics will be thrown at you to keep your ears ringing for a week. Tickets are available for $227.
I?ll be arriving at 11:30 AM and leaving late in case anyone wants to have a one on one discussion, or just sit around and chew the fat about the financial markets.
The lunch will be held at an exclusive private club in the downtown area of the city near Farragut Square, the location of which will be emailed with your purchase confirmation.
I look forward to meeting you, and thank you for supporting my research.
To purchase tickets for the luncheons, please?click here.
https://www.madhedgefundtrader.com/wp-content/uploads/2015/04/Washington-DC-e1429195716994.jpg246400DougDhttps://madhedgefundtrader.com/wp-content/uploads/2019/05/cropped-mad-hedge-logo-transparent-192x192_f9578834168ba24df3eb53916a12c882.pngDougD2016-04-07 01:09:302016-04-07 01:09:30April 20 Washington DC Global Strategy Luncheon
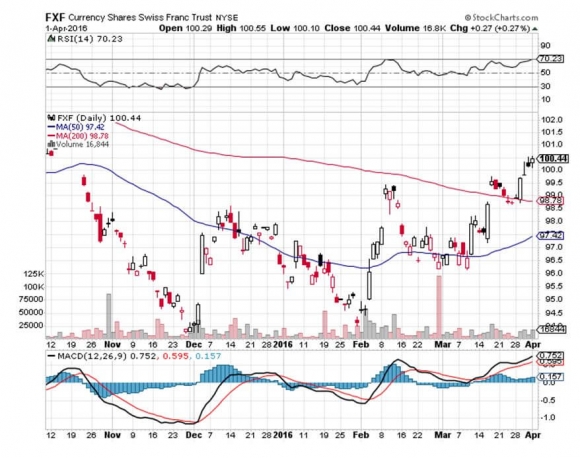
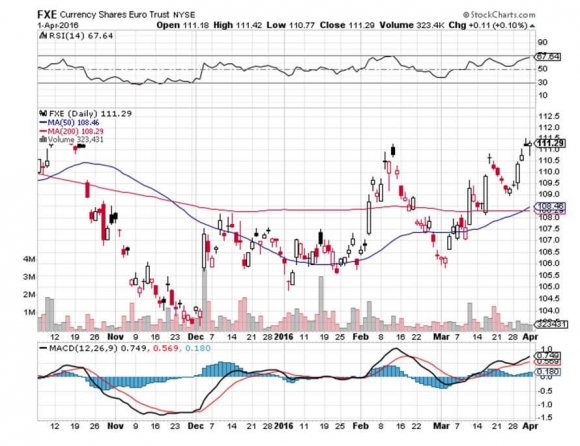
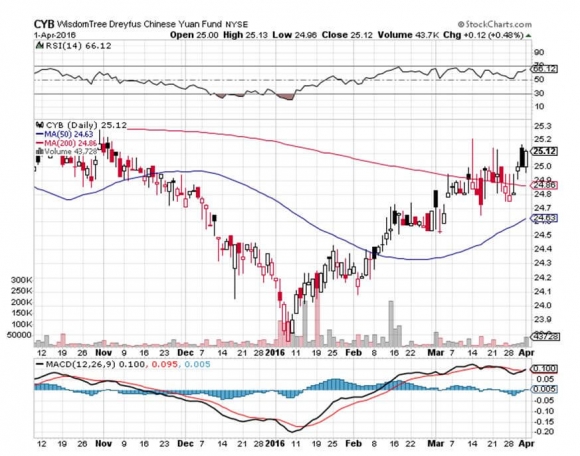
My former employer, The Economist, once the ever tolerant editor of my flabby, disjointed, and juvenile prose (Thanks Peter and Marjorie), has released its ?Big Mac? index of international currency valuations.
Although initially launched by an imaginative journalist as a joke three decades ago, I have followed it religiously and found it an amazingly accurate predictor of future economic success.
The index counts the cost of McDonald?s (MCD) premium sandwich around the world, ranging from $7.20 in Norway to $1.78 in Argentina, and comes up with a measure of currency under and over valuation.
What are its conclusions today? The Swiss franc (FXF), the Brazilian real, and the Euro (FXE) are overvalued, while the Hong Kong dollar, the Chinese Yuan (CYB), and the Thai Baht are cheap.
I couldn?t agree more with many of these conclusions. It?s as if the august weekly publication was tapping The Diary of the Mad Hedge Fund Trader for ideas.
I am no longer the frequent consumer of Big Macs that I once was, as my metabolism has slowed to such an extent that in eating one, you might as well tape it to my ass. Better to use it as an economic forecasting tool, than a speedy lunch.
The Big Mac in Yen is Definitely Not a Buy
https://www.madhedgefundtrader.com/wp-content/uploads/2011/12/mcdonaldsJapan.jpg240320Mad Hedge Fund Traderhttps://madhedgefundtrader.com/wp-content/uploads/2019/05/cropped-mad-hedge-logo-transparent-192x192_f9578834168ba24df3eb53916a12c882.pngMad Hedge Fund Trader2016-04-07 01:08:232016-04-07 01:08:23Where The Economist ?Big Mac? Index Finds Currency Value
Until the 19th century, children used to provide income and security for their parents as they worked on the family farm. That dynamic continued when industrialization brought families into the cities and kids into the factories.
Since then, children have been a great short.
A hundred years of state mandated education and child labor laws increased the cost of raising children while reducing their income potential. Today many offspring stay in increasingly expensive schools until their mid-twenties without earning a dime of income.
A century ago, 10 children were a godsend. Today they would be ruinous. Spending on children has flipped from an investment to conspicuous consumption. I count myself in the latter category, as I have five kids of my own.
The cost of children is proving to be the most effective form of birth control. The problem is that it is working too well, as fertility rates are collapsing in all parts of the globe, except in the Islamic world.
Many nations have fertility rates that during 2005-2010 plunged far below the 2.1 replacement rate, like Taiwan (1.14) Italy (1.18), Japan (1.27), and Russia (1.34). The US is nearly at breakeven at 2.05, versus a world average of 2.55, and an amazing 7.19 in the sub Saharan nation of Niger.
This is partially being offset by lifespans that have doubled since 1800 in the industrialized world from 40 to 80, and are now quickly ratcheting up in emerging nations.
The World Bank expects the global population to jump by 2 billion, from 7 to 9 billion by 2050, and then flatten out. The big question for all of us: what does a zero population growth mean for the economy, which until now has always been driven on an endlessly rising number of consumers?
How soon will financial markets start to discount its implications, whatever they are? Expect to hear a lot more about this issue.
https://www.madhedgefundtrader.com/wp-content/uploads/2013/04/Kids.jpg333465Mad Hedge Fund Traderhttps://madhedgefundtrader.com/wp-content/uploads/2019/05/cropped-mad-hedge-logo-transparent-192x192_f9578834168ba24df3eb53916a12c882.pngMad Hedge Fund Trader2016-04-07 01:07:452016-04-07 01:07:45The Falling Market for Kids
I have done many things in my life: hedge fund manager, pilot, cowboy, journalist, stockbroker, mountain climber, translator, guide, etc, etc. etc.
Now add technical consultant to Hollywood to the list.
According to the New York Times, Simon Baker, star of the TV show ?The Mentalist?, is using the Diary of a Mad Hedge Fund Trader as a resource to humanize Wall Street traders in the recent film entitled ?Margin Call? (click here?to read the review).
This is not an easy task, as the public generally considers denizens of the pit as greedy, soulless, money-grubbing monsters, difficult to empathize with, in any setting.
The star-studded thriller includes Kevin Spacey, Demi Moore, and Jeremy Irons, and focuses on a 24-hour period during the height of the financial crisis at a fictional Wall Street bank. No doubt, the producers hoped to ride on the coattails of Oliver Stone?s sequel to the classic film, Wall Street.
As with the last film, the great industry guessing game is identifying who and which institutions in real life are being portrayed. The film was released to mixed reviews.
Hey Kevin, baby, have your people call my people and let?s do lunch! To buy the DVD on Amazon, please?click here.
Demi?s Looking to Make Some New Investments
https://www.madhedgefundtrader.com/wp-content/uploads/2013/06/Demi-Moore.jpg234320Mad Hedge Fund Traderhttps://madhedgefundtrader.com/wp-content/uploads/2019/05/cropped-mad-hedge-logo-transparent-192x192_f9578834168ba24df3eb53916a12c882.pngMad Hedge Fund Trader2016-04-07 01:06:402016-04-07 01:06:40Hollywood Cashes in on Wall Street?s Troubles
Featured Trade: (APRIL 19 ATLANTA GLOBAL STRATEGY LUNCHEON), (SEEING RED FLAGS EVERYWHERE), (FXY), (YCS), (TLT), (USO), (T), (PCG), (FCX) (THE TWO CENTURY DOLLAR SHORT), (UUP)
CurrencyShares Japanese Yen ETF (FXY) ProShares UltraShort Yen (YCS) iShares 20+ Year Treasury Bond (TLT) United States Oil (USO) AT&T, Inc. (T) PG&E Corporation (PCG) Freeport-McMoRan Inc. (FCX) PowerShares DB US Dollar Bullish ETF (UUP)
During Operation Desert Storm in 1991, Central Command asked me to fly a top secret mission to Lebanon in my twin engine Cessna 340.
Mission accomplished, I flew home on a 270-degree heading over the Eastern Mediterranean at an altitude of 200 feet, in order to stay under the radar.
It was a warm, hazy day, and I had the plane on autopilot, enjoying myself passing the time looking out for fishing boats, private yachts with bathing beauties, and cargo ships.
Suddenly, I saw an F-18 fighter jet come straight at me, pass a few feet overhead, do a 180, then come up right alongside my port wingtip. A minute later a second F-18 joined me on my starboard wingtip, and a third followed directly behind me at a safe distance.
I thought, ?This is not good.?
The planes had US markings. So I reached into my pilot?s case and pulled out a small American flag and held it up against the cockpit window.
They ignored me, stonily staring straight ahead.
Then I took off my New York Yankees baseball cap, held it up to the window and pointed at it.
Still no response.
Then they gradually started edging towards me, eventually holding course TEN FEET off each wingtip at 220 MPH. I was unable to change course.
I put out a Mayday call.
Five minutes later I received a call from a listening station at a British Army base in Cyprus. He said he was relaying a message from a US Navy helicopter from an undisclosed location.
Right at that moment the cause of my predicament became clear.
An American aircraft carrier loomed out of the haze, surrounded by 25 grey support ships. As I passed overhead, the cockney accent informed me ?Don?t worry, they only think you?re a suicide bomber.?
The second I passed over the enormous ship, it's deck chock a block with waiting aircraft and hustling sailors, the F-18?s suddenly peeled away.
Observing the disjointed market action over the past few days, that queasy feeling that I was about to be shot down in flames has returned.
Let me list the red flags I am seeing for this market.
1) The yen is appreciating. With a weak economy, exploding national debt, tottering government, demographic nightmare, and a 10-year JGB yielding negative -10 basis points, it should be falling. The yen (FXY), (YCS) only goes up for one reason: hedge funds around the world are covering their short positions because they plan to dump long positions in all other asset classes, especially stocks.
2) The bond market is remarkably healthy. Ten-year US Treasuries (TLT) hit a 1.70% yield today. Investors are not buying bonds because they love these fabulous 170 basis point yields. They are soaking them up because they want to hide their cash from the greater harm they could suffer elsewhere.
3) Defensive stocks have been roaring. Utilities (PGE) and telephone companies (T) have some of the best performing stocks of 2016. This is despite the fact that they are burdened by ancient business models and literally rusting assets. But they have high dividend payouts and low stock volatility that is attracting investors. This means said investors believe the rest of the market is going to suck for the foreseeable future. Not good, not good.
4) Oil is going down again. Remember that perfect correlation between oil and stocks (USO)? It will return with a vengeance, and oil now has a head start. The world is still drowning in surplus oil, and a wave of bankruptcies is about to hit us big time.
5) You know those monster moves in oil and commodities (FCX) we saw since January? 100% of it was short covering. There was almost no new net cash pouring into the sector. And what is all that cash waiting to do again? Sell short the next momentum driven market breakdown.
6) The calendar is about to turn savagely against us. Heard of ?Sell in May and Go Away?? It?s April. What follows April? May. We are about to enter a period of historic stock market weakness (SPY) which is really tough to beat, unless you are short or hedged.
7) The Republican Convention in July could be a nightmare. Remember the Democratic Convention in 1968, when the police were found to have rioted? The upcoming brawl in Cleveland could make that affair look like a cakewalk. Anyone with a predilection for civil disobedience has already made their travel plans for the summer. Markets everywhere will shudder.
Don?t get me wrong here. I am convinced that the bull market in stocks still has several years to run. I just think that the last rally was too much, too fast, and that we could be in for another hickey. This is why I am running one of my smallest trading books in years, with just a small long in gold.
By the way, parachutes don?t work at 200 feet. I doubt that would have been a concern of mine, as sidewinder missiles rarely have a problem hitting their target at 100 feet.
I?m still pissed at the squids in the Navy.
?Why Insurance Companies Hate Me
https://www.madhedgefundtrader.com/wp-content/uploads/2016/04/Crashed-Plane-e1459909961483.jpg280400DougDhttps://madhedgefundtrader.com/wp-content/uploads/2019/05/cropped-mad-hedge-logo-transparent-192x192_f9578834168ba24df3eb53916a12c882.pngDougD2016-04-06 01:07:522016-04-06 01:07:52Seeing Red Flags Everywhere
?We?ve seen the S&P 500 drop 50% twice in the last 17 years. That is the new normal?, said Richard Kang of Emerging Global Advisors.
https://www.madhedgefundtrader.com/wp-content/uploads/2012/07/monks.jpg186183Mad Hedge Fund Traderhttps://madhedgefundtrader.com/wp-content/uploads/2019/05/cropped-mad-hedge-logo-transparent-192x192_f9578834168ba24df3eb53916a12c882.pngMad Hedge Fund Trader2016-04-06 01:05:162016-04-06 01:05:16April 6, 2016 - Quote of the Day
Featured Trade: (APRIL 18 MIAMI GLOBAL STRATEGY LUNCHEON), (GUESS WHO?S BEEN BUYING GOLD?), (GLD), (GDX), ($SSEC), (MY BRIEFING FROM THE JOINT CHIEFS OF STAFF), (PANW), (PHO), (HACK), (FXI), (RSX), (TESTIMONIAL)
SPDR Gold Shares (GLD) Market Vectors Gold Miners ETF (GDX) Palo Alto Networks, Inc. (PANW) PowerShares Water Resources ETF (PHO) PureFunds ISE Cyber Security ETF (HACK) iShares China Large-Cap (FXI) Market Vectors Russia ETF (RSX)
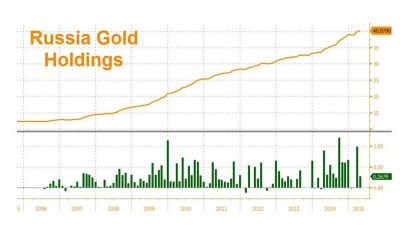
Gold bugs, conspiracy theorists, and perma bears had some unfamiliar company last year.
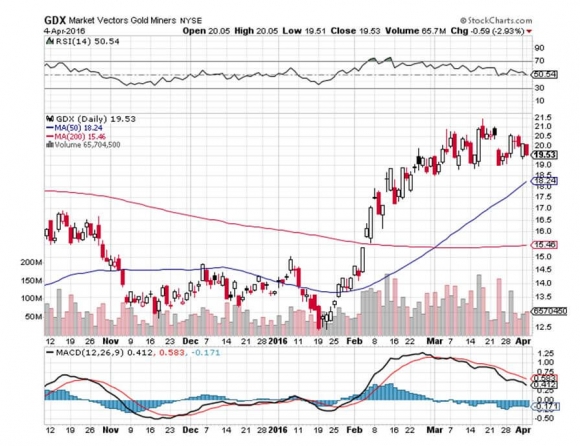
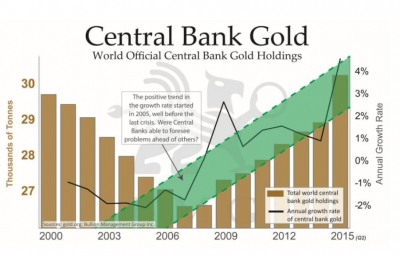
While traders, individuals, and ETF?s have been unloading gold for the past five years, central banks have been steady buyers.
Who had the biggest appetite for the barbarous relic? Russia, which has been accumulating the yellow metal to avoid economic sanctions imposed by the United States in the wake of their invasion of the Ukraine.
Hot on their heals was China, which has flipped to a large net importer of gold to meet insatiable demand from domestic investors.
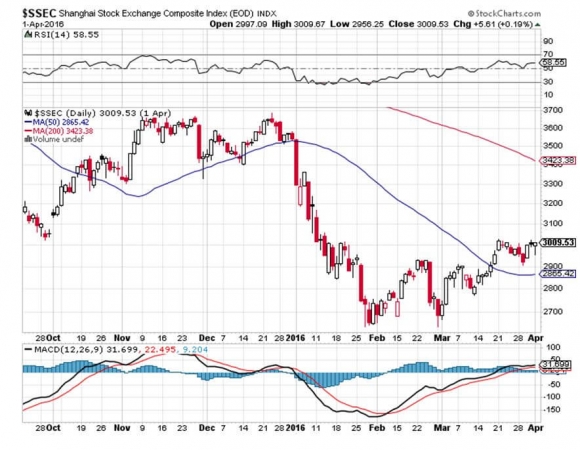
It seems the Chinese stocks markets ($SSEC) were not the great trading opportunity they were hyped to be, which plunged 30% during the first two months of 2016, and is now 60% off its all time high. That?s a big deal in a country that has no social safety net.
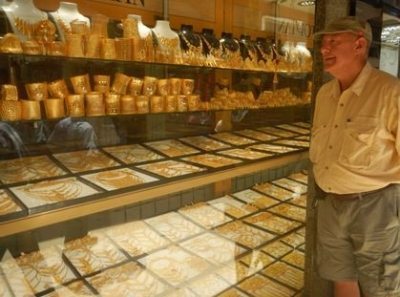
Many Chinese now prefer to buy gold instead of stocks, which are now considered too risky for a personal nest egg. They are facilitated by the ubiquitous precious metal coin stores, which have recently sprung up like mushrooms in every city.
Only a few years ago, private ownership of gold resulted in China having your organs harvested by the government.
Central bank sellers have been few and far between. Venezuela has dumped about half its reserve to head off a recurring liquidity crisis. Middle Eastern sovereign wealth funds cashed in some chips to deal with the oil price crash.
Canada has also been selling for reasons unknown to us south of the border.
All of this poses a really interesting question. Gold fell for the four consecutive years that central banks were buying, and the rest of the world was selling.
What happens when the rest of the world flips to the buy side?
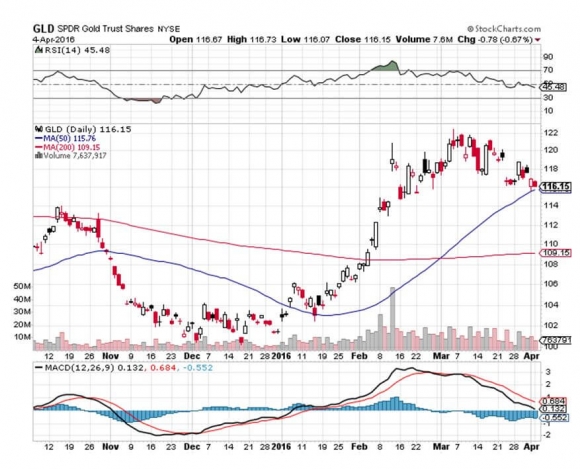
My guess is that it goes up, which is why I have issued long side trade Alerts on gold every month this year.
Depending on who you talk to, the magical support level were you get back in for another visit to the trough is $1,199 or, $1,200.
In the meantime, I think I?ll run my (GLD) April 15 $$109-$112 vertical bull call spread into expiration in eight trading days.
https://www.madhedgefundtrader.com/wp-content/uploads/2014/07/John-Thomas-Gold-e1455831491219.jpg297400DougDhttps://madhedgefundtrader.com/wp-content/uploads/2019/05/cropped-mad-hedge-logo-transparent-192x192_f9578834168ba24df3eb53916a12c882.pngDougD2016-04-05 01:08:492016-04-05 01:08:49Guess Who?s Been Buying Gold?
Legal Disclaimer
There is a very high degree of risk involved in trading. Past results are not indicative of future returns. MadHedgeFundTrader.com and all individuals affiliated with this site assume no responsibilities for your trading and investment results. The indicators, strategies, columns, articles and all other features are for educational purposes only and should not be construed as investment advice. Information for futures trading observations are obtained from sources believed to be reliable, but we do not warrant its completeness or accuracy, or warrant any results from the use of the information. Your use of the trading observations is entirely at your own risk and it is your sole responsibility to evaluate the accuracy, completeness and usefulness of the information. You must assess the risk of any trade with your broker and make your own independent decisions regarding any securities mentioned herein. Affiliates of MadHedgeFundTrader.com may have a position or effect transactions in the securities described herein (or options thereon) and/or otherwise employ trading strategies that may be consistent or inconsistent with the provided strategies.