Featured Trade: (TRADING DEVOID OF THE THOUGHT PROCESS), (SPY), (INDU), (TLT), (USO), (GOING BACK INTO GILEAD SCINECES), (GILD), (ON EXECUTING TRADE ALERTS)
SPDR S&P 500 ETF (SPY) Dow Jones Industrial Average ($INDU) iShares 20+ Year Treasury Bond (TLT) United States Oil ETF (USO) Gilead Sciences Inc. (GILD)
https://madhedgefundtrader.com/wp-content/uploads/2019/05/cropped-mad-hedge-logo-transparent-192x192_f9578834168ba24df3eb53916a12c882.png00Mad Hedge Fund Traderhttps://madhedgefundtrader.com/wp-content/uploads/2019/05/cropped-mad-hedge-logo-transparent-192x192_f9578834168ba24df3eb53916a12c882.pngMad Hedge Fund Trader2015-02-05 09:37:262015-02-05 09:37:26February 5, 2015
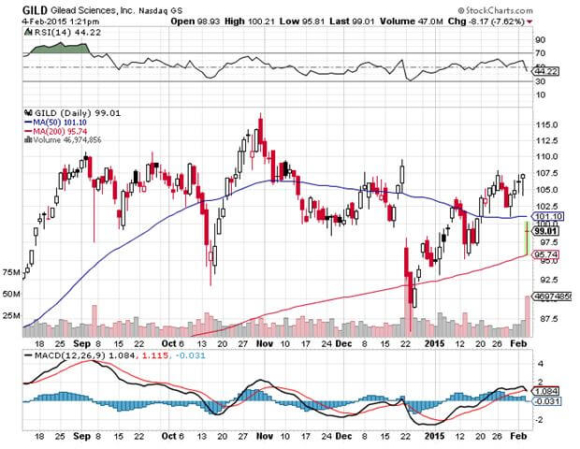
This is a stock that could double by the end of 2015. Buy a great performing stock in the top performing sector on a 10% dip.
The stock has over reacted to an earnings report that was fantastic; but carried conservative forward guidance, based on expected future pricing pressure on its blockbuster Hepatitis C drugs, Sovaldi and Harvini.
I am giving a nod to the current high risk, high volatility environment and being very cautious here buy going with strike prices for the options that are well below the 200-day moving average. A very short, 11 trading day expiration gives us some extra protection.
This position should be able to weather some pretty fierce storms.
If you want to be more aggressive and take a longer view, buy the (GILD) April, 2015 $110 calls at $2.20 or better. If we break to a new all time high by the April 17 expiration, as I expect, you could score a 3-5 bagger for these options.
If you don?t do options, just buy the shares and sit on them for the rest of the year.
I spoke to a friend of mine who works for a health care venture capital firm, and I thought I?d pass through a few tidbits.
Gilead Sciences (GILD) is basking in the glow of the most profitable drug launch in history. Its treatment for hepatitis C, launched in 2013, inhibits the RNA polymerase that the hepatitis C virus (HCV) uses to replicate its RNA. It traders? parlance, it kills the bug.
(GILD) has taken in $5.7 billion in sales of this drug during the first half of 2014, and could sell as much as $10-$12 billion for the full year.
The drug is so revolutionary, that it on the scale of medical miracles of decades past, such as Salk vaccine immunizations for polio and penicillin treatments for bacterial infections. So far, Gilead has cured a breathtaking 90% of patients.
Now the company is using various drug combinations that produce even higher success rates with fewer side effects, and may be expended to treat other life threatening diseases. These could take Hepatitis C drug sales as high as $15-$18 billion in 2015.
A big controversy has been its immense cost, which works out to $84,000-$135,000 per patient. This has become a bigger issue with the advent of Obamacare, now that the government is picking up much of the tab.
But, that?s a bargain compared to full treatment of the disease, which can run as high as $350,000 per patient. That is, unless you don?t care if you die.
Partly in response to these complaints, the company is making the drug available at deep discounts in 91 emerging nations that account for 50% of all Hepatitis C cases globally. What it loses on margins there it will make back in volume.
With any luck, we may see hepatitis C wiped out in my lifetime, as I have already seen with smallpox (I saw some of the last few live cases in kids in Nepal in 1976).
All of this makes the stock appear a bargain at its current $99.01 price. At a multiple of a subterranean 11X earnings, the stock should hit $140 next year.
You all know that health care is one of my three core industries to bet on for the long term (there others are energy and technology).
The short-term driver of the share price for (GILD) is obviously whether the health care sector is in, or out of vogue. But for the long term Gilead looks like a good bet to me.
And I don?t even have hepatitis, or Ebola.
Time for Another Dose of Gilead Sciences
https://www.madhedgefundtrader.com/wp-content/uploads/2014/10/Sovaldi-Pills.jpg298367Mad Hedge Fund Traderhttps://madhedgefundtrader.com/wp-content/uploads/2019/05/cropped-mad-hedge-logo-transparent-192x192_f9578834168ba24df3eb53916a12c882.pngMad Hedge Fund Trader2015-02-05 09:31:422015-02-05 09:31:42Going Back Into Gilead Sciences
Featured Trade: (SOLAR STOCKS GET A JOLT), (SCTY), (SUNE), (SPWR), (TAN), (IS THE REAL ESTATE MARKET CATCHING COLD?), (ITB), (KBE)
SolarCity Corporation (SCTY) SunEdison, Inc. (SUNE) SunPower Corporation (SPWR) Guggenheim Solar ETF (TAN) iShares US Home Construction (ITB) SPDR S&P Bank ETF (KBE)
https://madhedgefundtrader.com/wp-content/uploads/2019/05/cropped-mad-hedge-logo-transparent-192x192_f9578834168ba24df3eb53916a12c882.png00Mad Hedge Fund Traderhttps://madhedgefundtrader.com/wp-content/uploads/2019/05/cropped-mad-hedge-logo-transparent-192x192_f9578834168ba24df3eb53916a12c882.pngMad Hedge Fund Trader2015-02-04 01:05:502015-02-04 01:05:50February 4, 2015
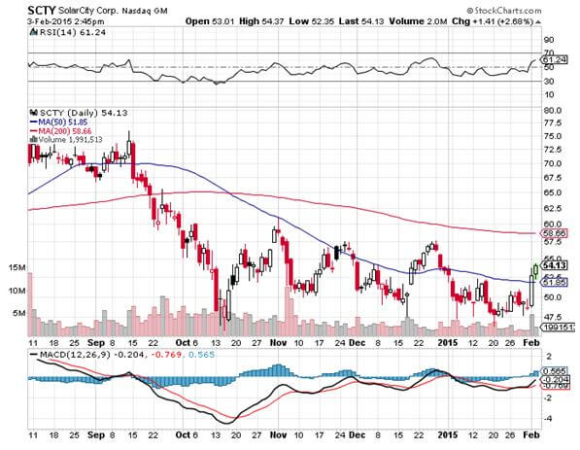
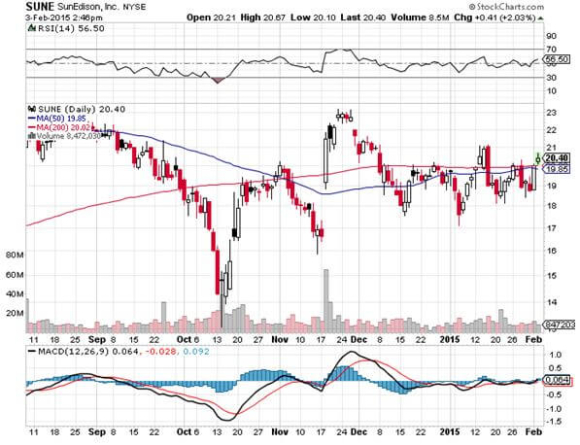
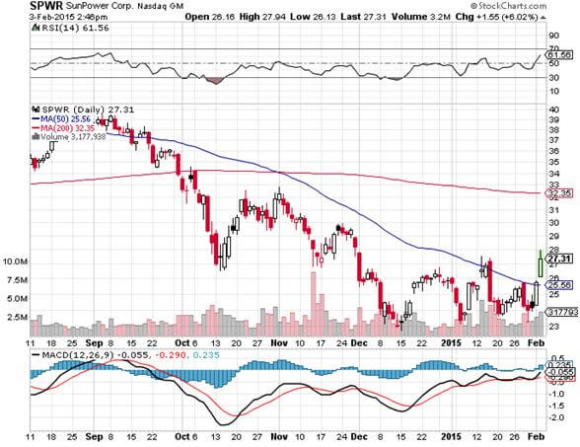
The blockbuster for me in President Obama?s budget speech on Monday was his suggestion that the 30% alternative energy investment tax credit be made permanent. All solar stocks, including front-runners Solar City (SCTY), Sun Edison (SUNE), and SunPower (SPWR), rocketed on the news.
Now slated to expire at the end of 2017, the tax break is credited with igniting a solar building boom in recent years. Solar panels are becoming commonplace on roofs in better off residential neighborhoods across the country.
They are becoming so pervasive that they are changing the market for electricity beyond all recognition in lead states like California. The afternoon demand spike, once a regular feature of power management, is rapidly disappearing as consumers now sell excess peak electricity back to utilities at favorable rates.
Of course, this is all wishful thinking on the part of Obama, who couldn?t get a Republican led congress to agree with him on what day it is. Still, it has been outlined a priority with the administration, and could be a bargaining chip used in some broader tax compromise with the opposition.
And where President Obama mail fail, a future President Hillary may succeed.
Indeed, there has recently been an onslaught of good news showering the solar industry. China has announced a 43% increase in its installed solar base, an increase of 15 gigawatts. At the very least, this will divert cheap Chinese made panels from flooding the US market, the recent punitive import duty notwithstanding.
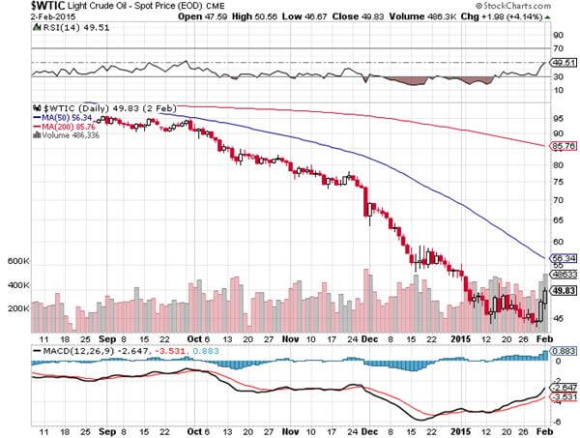
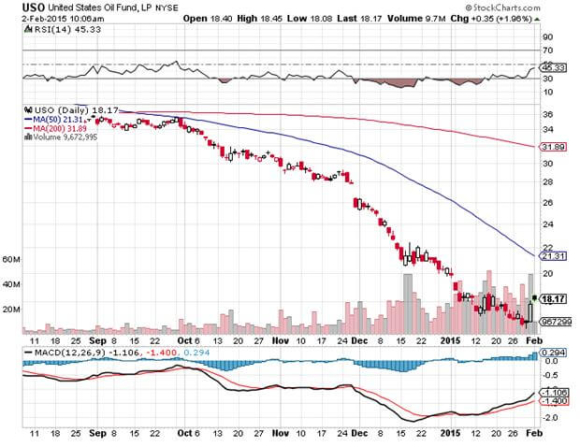
A 15% rally in the price of oil over the past three trading days has also provided a major assist. Solar actually has nothing to do with the price of oil. Its main competitor is the retail cost of electricity, which is driven by future capital spending budgets of local utilities. That has costs rising as far as the eye can see, as the industry replaces aging, 100 year old infrastructure.
The market sees it otherwise, which lumps all energy firms in the same category, be they oil, fracking, natural gas, coal, or even nuclear. Whether it makes sense or not, solar stocks are still tarred by the price of oil. Check out the charts below, and you find a correlation that is almost perfect.
The great irony in the president?s proposal is that solar is now profitable even without the tax breaks. They just provide the juice to accelerate widespread solar adoption.
I think solar is one of a handful of industries that could generate a tenfold return over the coming decade. Costs are plummeting, profit margins are expanding, and the overall market size is growing by leaps and bounds.
The fact that you can buy them now 40% off of their recent peaks is a gift. A $30 recovery in the price of oil could bring a 40% recovery in the shares of the oil majors. It could deliver a ten bagger for solar companies.
Let me pass on a little tidbit I picked up from Solar City a few weeks ago. By the end of this year, used Tesla Model S-1 batteries will become available in large numbers for the first time, including my own. (SCTY) plans to offer these for sale to their customers as backup batteries for home use. One battery can store three days worth of normal power consumption. This would make customers totally independent of the power grid.
No mention has been made of prices. My guess is that since these lithium ion batteries cost $30,000 new, a second hand one should come out at $10,000. These will still have 80% of their original capacity, not enough for a long-range car, but plenty for home storage.
For more depth on Solar City, please refer to my recent piece,?Loading the Boat with Solar City? by clicking here.
Meet the New Bull Market
https://www.madhedgefundtrader.com/wp-content/uploads/2015/02/Solar-Panel-Installation-e1423003212602.jpg238400Mad Hedge Fund Traderhttps://madhedgefundtrader.com/wp-content/uploads/2019/05/cropped-mad-hedge-logo-transparent-192x192_f9578834168ba24df3eb53916a12c882.pngMad Hedge Fund Trader2015-02-04 01:04:262015-02-04 01:04:26Solar Stocks Get a Jolt
I used to begin my pieces about residential real estate talking about the broker I found hanging from the showerhead at an open house.
That didn?t really happen. But from 2008-2012 conditions were so dire that it could have.
That is clearly not the case any more. The market has been on fire for the past three years. Private equity firms put a floor under the markets by pouring in massive amounts of cash. Once they chewed through a backlog of foreclosed homes, it was off to the races.
The gains in the lead markets have been nothing less than stunning. San Francisco saw prices rocket by 33% last year, floated by a tidal wave of technology IPO money. A home in Fog City is now 40% more expensive than the last peak in 2007.
If you want to work for a startup, you better count on spending some time in a garage, to live, not to work, as rents are now so stratospheric. Even the basket case states of Florida, Arizona, and Nevada have bounced back, although they are still well off their highs.
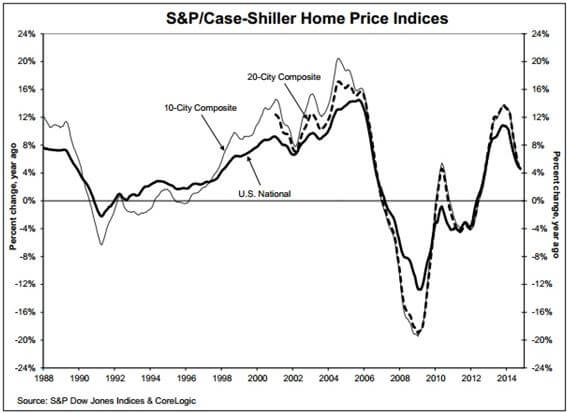
The S&P 500 Case Shiller Real Estate Index has been moving up in nearly a straight line since 2009. That is, until six months ago, when a noticeable softening began (it?s always published on a three month lag, as the market is so fragmented).
The most recent report said that homes were appreciating at a modest 4.7% year on year rate, a much slower rate than in the past. Given the onslaught of other negative data in recent months, you have to ask if the party is now over for homeowners.
It would be easy to blame the weather, last winter being one of the worst on record. My friends in Chicago threw empty beer cans at the TV sets whenever the weatherman appeared, for good reason. You can?t visit an open house if it is buried in snow and black ice has closed the roads. However, you have to ask if there is more going on here. We also learned today that the national homeownership rate has fallen to 68.4%, a new 19 year low, according to the US Census Bureau. It would be easy to ascribe this as just one more effect of concentration of wealth at the top. But more thoughtful analysis is deserved here.
Talk to kids today, and it quickly becomes clear that homeownership is not the priority that it was for earlier generations. And who would blame them. For most of their lives, house prices have gone down, not up. For them, that cute little house with the white picket fence belies tales of financial distress, bankruptcy and foreclosure. So what?s the big rush?
A lot of twenty somethings would rather just spend their money and rent, not own. Many in the San Francisco Bay Area prefer to invest their savings in their own start-ups in the hope of making it big someday.
It?s not like banks want to lend to them anyway. In the aftermath of the Great Recession, banks now have far more stringent lending standards than in the past. You can blame both the new regulation in Dodd Frank and the banks? own desire to pare back risk.
Some 70% of graduating students today do so with outstanding student loan balances. Debts of $100,000 or more are common, and heaven help you if you want to go to graduate school. Needless to say, they don?t exactly make ideal mortgage candidates. We may b losing an entire generation of homebuyers.
I don?t think we are headed for another real estate crash. More likely, it will go to sleep for a while in a prolonged sideways move. Interest rates are still at ultra low levels and will remain so for a long time, providing a floor under current prices. The big killings are long gone. That was a 2012 trade.
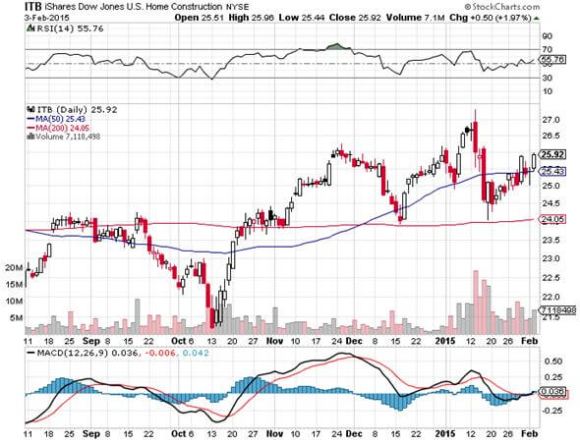
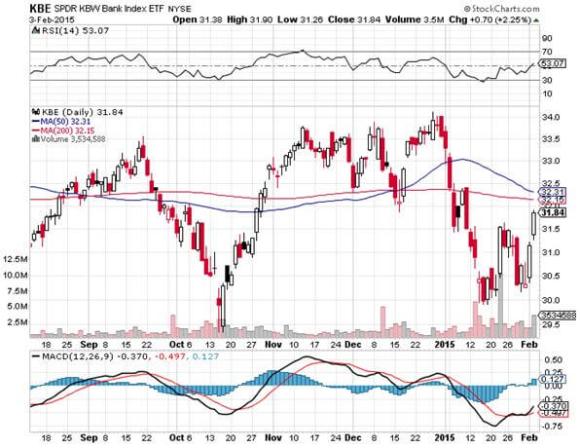
The stock market has been telling us as much. The iShares Dow Jones US Home Construction ETF (ITB) has led the market retreat this year, paring back 12.7%. Banks have also taken it in the shorts, thanks to the drying up of new mortgage originations, the SPDR KBW Bank Index ETF (KBE), giving back 12% during the same time frame.
Happy days will return to housing once more. But we may have to wait until the 2020?s, when a gigantic demographic tail wind, returning inflation and rising wages all kick in at the same time.
Some of those nascent start-ups may also be going public by then, adding more fuel to the fire.
Is Housing Cooling Off?
https://www.madhedgefundtrader.com/wp-content/uploads/2014/04/House-Fire.jpg305456Mad Hedge Fund Traderhttps://madhedgefundtrader.com/wp-content/uploads/2019/05/cropped-mad-hedge-logo-transparent-192x192_f9578834168ba24df3eb53916a12c882.pngMad Hedge Fund Trader2015-02-04 01:03:002015-02-04 01:03:00Is the Real Estate Market Catching Cold?
Featured Trade: (FEBRUARY 4 GLOBAL STRATEGY WEBINAR), (HOW TO LOSE MONEY), (LINE), (USO), (THE MARKET?S TECHNICAL OUTLOOK IS TERRIBLE), (SPY), (QQQ), (IWM), (T), (AA), (FXY), (TESTIMONIAL)
Linn Energy, LLC (LINE) United States Oil ETF (USO) SPDR S&P 500 ETF (SPY) PowerShares QQQ Trust, Series 1 (QQQ) iShares Russell 2000 (IWM) AT&T, Inc. (T) Alcoa Inc. (AA) CurrencyShares Japanese Yen ETF (FXY)
https://madhedgefundtrader.com/wp-content/uploads/2019/05/cropped-mad-hedge-logo-transparent-192x192_f9578834168ba24df3eb53916a12c882.png00Mad Hedge Fund Traderhttps://madhedgefundtrader.com/wp-content/uploads/2019/05/cropped-mad-hedge-logo-transparent-192x192_f9578834168ba24df3eb53916a12c882.pngMad Hedge Fund Trader2015-02-03 01:07:242015-02-03 01:07:24February 3, 2015
I?m really glad I watched the Super Bowl yesterday. Not only was it a great warm-up for next year?s championship game, which will be in my hometown of San Francisco. I also witnessed the worst coaching call in football history.
The Seattle Seahawks had the game in the bag. All they had to do was move the ball one foot over two tries at the goal line. Instead, they passed? Too bad I wasn?t able to find a bookie to take a last minute six-figure bet. I expected New England to win.
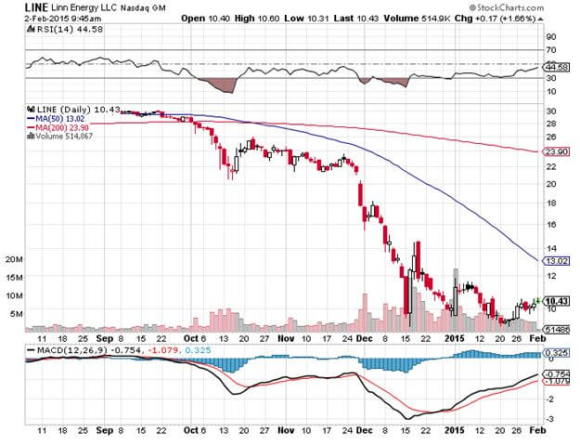
I have to tell you that I sympathize with Seahawks Coach Peter Carroll. For I sent out one of the worst recommendations in trading history with my BUY of master limited partnership Linn Energy (LINE) on December 1.
I then proceeded to break every rule in the trader?s handbook on how to manage this position. The errors were so many that I have to list them:
1) I scored the instant profit I was looking for, making 80 basis points within two days. I didn?t take it. Instead I got greedy, hanging on for more. It never showed.
2) I then ignored my own stop loss at $15, even though most of you bailed out then and there.
3) I then committed anther sin, waiting for the units to get back to my cost to get out, even though I constantly admonish followers never to do this. The market doesn?t care what your cost is. The market is the market. It has zero memory, and could care less who you are.
4) There were several substantial rallies that I could have sold into for a much smaller loss, to $14.80, $11.90 and $11.70. I didn?t. The ?getting out for even? syndrome strikes again.
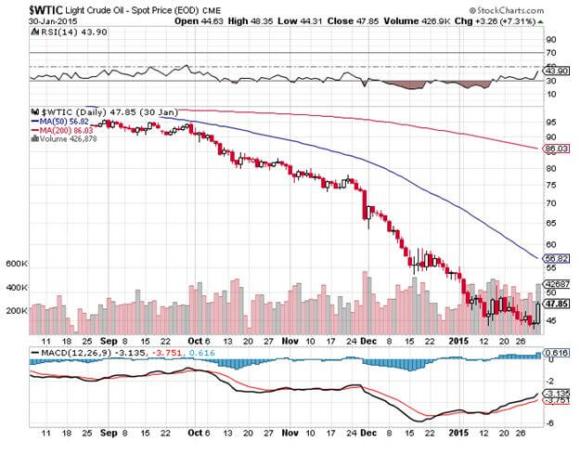
5) I expected oil to bottom out in the low $60?s, which was much lower than most people?s targets. It didn?t. Instead, it dropped another $20 to the $43 handle. Once there is a glut of oil, there is no place to put it, as all storage is full, so it always plunges lower than you expect. With more oil industry experience than most traders, I already knew this. But I ignored the writing on the wall.
6) I waited for a yearend short covering rally to take me out of the position. It never showed. Instead, it went down faster, hitting a new five year low of $9.30.
7) I waited for a New Year rally to take me out. Ditto.
At this point, (LINN) is acting like a classic busted stock. Even though oil has bounced back by a hefty 15% in recent days, (LINN) has barely moved. If you throw good news on a stock and it doesn?t move, it is time to say hasta la vista baby.
For more depth on the grim outlook for Texas tea, please read my recent piece, ?More Pain to Come in Oil? by clicking here. Now is not the time to maintain an aggressive long in energy.
I?m sure (LINN) will come back some day, as it is well managed. In fact, it might even be the big trade of the year. But this could happen in months, or even years. And if you haven?t noticed, the name of this service is the Diary of a Mad Hedge Fund Trader, not the Diary of a Mad Long Term Investor.
Where I live, long-term is a long-winded way of saying "wrong".
Can I Interest You in Some Linn Energy?
https://www.madhedgefundtrader.com/wp-content/uploads/2015/02/Pete-Carroll-e1422911237298.jpg400279Mad Hedge Fund Traderhttps://madhedgefundtrader.com/wp-content/uploads/2019/05/cropped-mad-hedge-logo-transparent-192x192_f9578834168ba24df3eb53916a12c882.pngMad Hedge Fund Trader2015-02-03 01:05:132015-02-03 01:05:13How to Lose Money
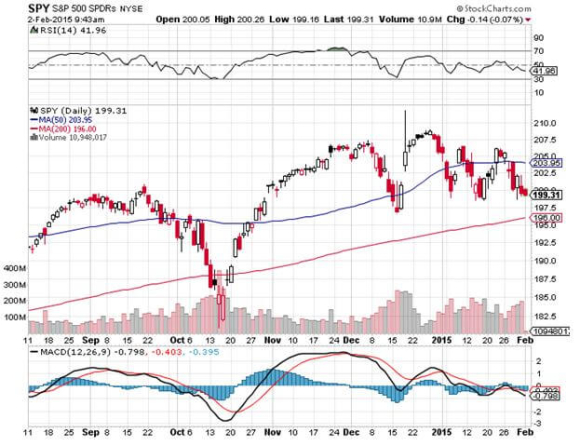
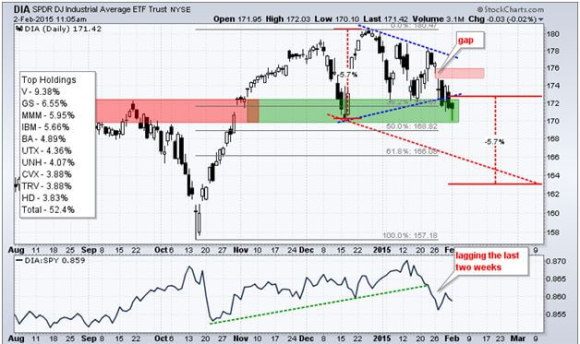
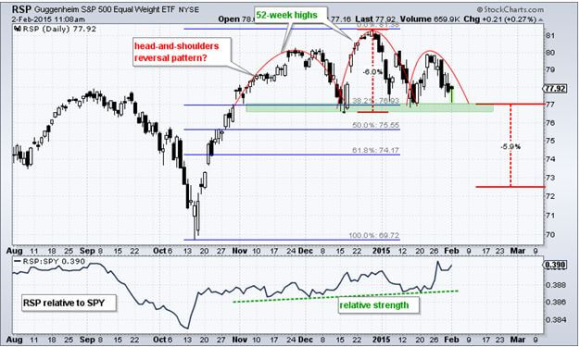
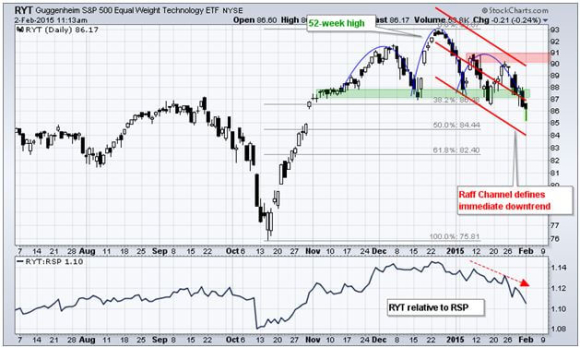
At yesterday morning?s opening bell, we were greeted with the unmistakable evidence the stock market is technically breaking down.
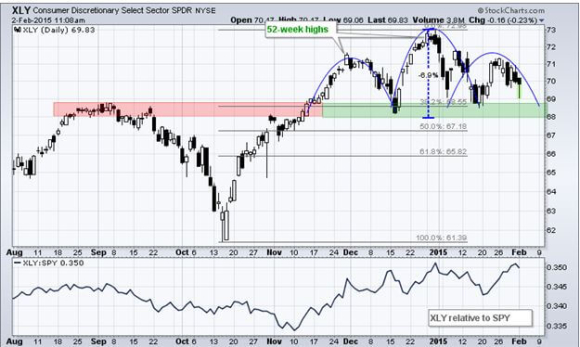
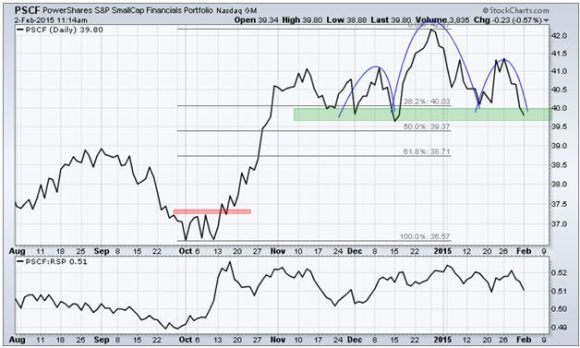
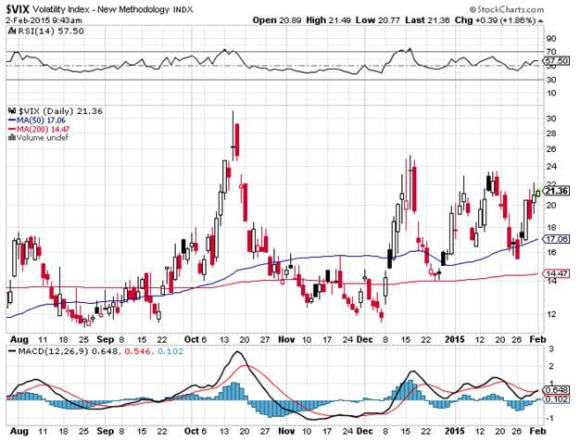
The Dow Average has broken its three-year upward sloping trend line. Market leading sectors, like Consumer Discretionary and Financials have all put in eminently convincing ?Head and Shoulders? tops (click here). More distressingly, the head and shoulders for lead sector Technology has already broken down. Check out all the charts below.
I quickly ran my expiration P&L this morning. I figured out that if I sold all my longs for small profits (SPY), (IWM), and kept all my short positions (FXY), (T), (AA), I would be up 4.43% year to date by mid February, which in this environment is nothing less than heroic. The exception to the analysis is my sale of Linn Energy (LINE), which will be the subject of my next piece.
For more detail on why this is happening, read today?s letter, ?The Great American Rot is Ending? by clicking here).
Time to Bail
https://www.madhedgefundtrader.com/wp-content/uploads/2015/02/Skydiver-e1422906198890.jpg253400Mad Hedge Fund Traderhttps://madhedgefundtrader.com/wp-content/uploads/2019/05/cropped-mad-hedge-logo-transparent-192x192_f9578834168ba24df3eb53916a12c882.pngMad Hedge Fund Trader2015-02-03 01:04:522015-02-03 01:04:52The Market?s Technical Outlook is Terrible
Really enjoyed the Chicago lunch with you, Jim and the guys from Toronto. My trading improved just from the two-hour lunch seminar. Looking forward to coming in the spring if you do another Chicago lunch.
Thanks,
Rich Detroit, Michigan
https://www.madhedgefundtrader.com/wp-content/uploads/2015/02/John-Thomas-e1422916318181.jpg300400Mad Hedge Fund Traderhttps://madhedgefundtrader.com/wp-content/uploads/2019/05/cropped-mad-hedge-logo-transparent-192x192_f9578834168ba24df3eb53916a12c882.pngMad Hedge Fund Trader2015-02-03 01:03:582015-02-03 01:03:58Testimonial
Featured Trade: (THE GREAT AMERICAN ROT IS ENDING), (SPY), (TLT), (FXY), (FXE), (USO)
SPDR S&P 500 ETF (SPY) iShares 20+ Year Treasury Bond (TLT) CurrencyShares Japanese Yen ETF (FXY) CurrencyShares Euro ETF (FXE) United States Oil ETF (USO)
https://madhedgefundtrader.com/wp-content/uploads/2019/05/cropped-mad-hedge-logo-transparent-192x192_f9578834168ba24df3eb53916a12c882.png00Mad Hedge Fund Traderhttps://madhedgefundtrader.com/wp-content/uploads/2019/05/cropped-mad-hedge-logo-transparent-192x192_f9578834168ba24df3eb53916a12c882.pngMad Hedge Fund Trader2015-02-02 09:34:252015-02-02 09:34:25February 2, 2015
Legal Disclaimer
There is a very high degree of risk involved in trading. Past results are not indicative of future returns. MadHedgeFundTrader.com and all individuals affiliated with this site assume no responsibilities for your trading and investment results. The indicators, strategies, columns, articles and all other features are for educational purposes only and should not be construed as investment advice. Information for futures trading observations are obtained from sources believed to be reliable, but we do not warrant its completeness or accuracy, or warrant any results from the use of the information. Your use of the trading observations is entirely at your own risk and it is your sole responsibility to evaluate the accuracy, completeness and usefulness of the information. You must assess the risk of any trade with your broker and make your own independent decisions regarding any securities mentioned herein. Affiliates of MadHedgeFundTrader.com may have a position or effect transactions in the securities described herein (or options thereon) and/or otherwise employ trading strategies that may be consistent or inconsistent with the provided strategies.