Featured Trades: (MACRO MILLIONAIRE PUNCHES THROUGH TO NEW ALL TIME HIGH),
(SPY), (USO), (FXE), (FXF), (GLD), (IWM), (BAC)
2) Macro Millionaire Punches Through to New All Time High. Macro Millionaire, my innovative trade mentoring program, punched through to a new year to date return of 39.15%. Suring the same time period, which began on December 1, 2010, the S&P 500 posted a paltry 2% gain.
Since the August 8 low in the stock market, I have closed ten consecutive profitable trades in the S&P 500 (SPY), the United States Oil Fund (USO), the Euro (FXE), the Swiss franc (FXF), gold (GLD), the Russell 2000 (IWM), and Bank of America (BAC). September alone is up 16.56%.
As we mark to market our portfolio daily, these results are net of losses that I am running in the short Treasury bond ETF (TBT) and Caterpillar (CAT). Take away the drag from this pair of losers, and my performance would be up 47.64% YTD.
For those who wish to participate in Macro Millionaire, please email John Thomas directly at madhedgefundtrader@yahoo.com . Please put 'Macro Millionaire' in the subject line, as we are getting buried in emails. This is the best chance you will ever have to learn the strategy, logic, risk control, and execution methods employed by the top hedge fund managers.
https://madhedgefundtrader.com/wp-content/uploads/2019/05/cropped-mad-hedge-logo-transparent-192x192_f9578834168ba24df3eb53916a12c882.png00Mad Hedge Fund Traderhttps://madhedgefundtrader.com/wp-content/uploads/2019/05/cropped-mad-hedge-logo-transparent-192x192_f9578834168ba24df3eb53916a12c882.pngMad Hedge Fund Trader2011-09-21 01:50:302011-09-21 01:50:30September 21, 2011 - Macro Millionaire Punches Through to New All Time High
Featured Trades: (IMF RINGS THE ALARM FOR THE GLOBAL ECONOMY)
3) IMF Rings the Alarm for the Global Economy. The International Monetary Fund just substantially revised down their growth outlook for 2012, saying that the global economy has entered a 'dangerous new phase.' Specifically, the world was cut from GDP growth of 4.5% to 4%, the US from 2.7% to 1.8%, and European from 1.7% to 1.1%.
Keep in mind that the IMF, like the Federal Reserve, is a deep lagging indicator when it comes to making accurate economic predictions. For example,The Mad Hedge Fund Trader cut his 2011 GDP expectation to 2% last January, well in time to position your portfolio to take maximum advantage. Often it is a case of these agencies closing the barn door after the horses have bolted.
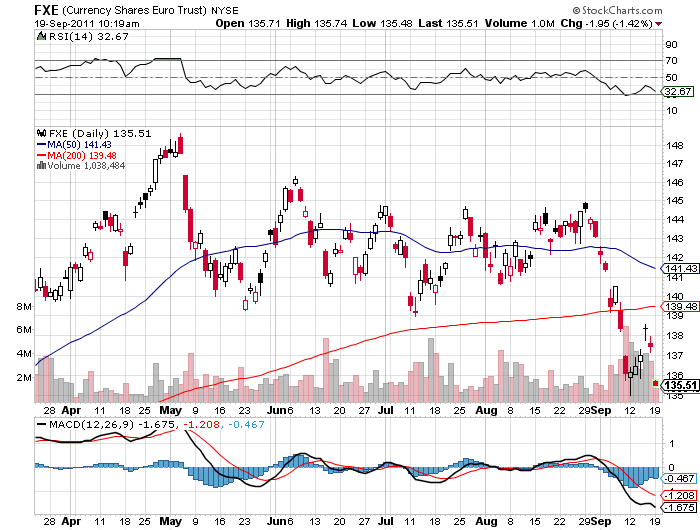
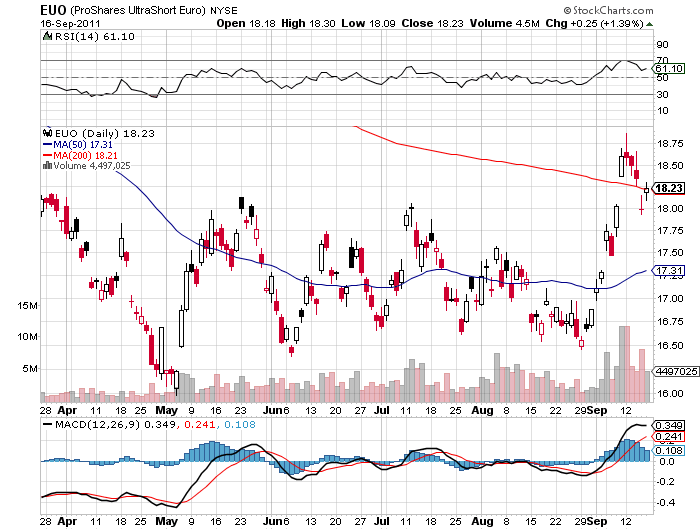
To me, the most glaring downgrade out there is that for Europe. It makes total nonsense of the current short term interest rates for the Euro, which the European Central Bank raised twice this year by 0.25%. When they cut back to zero, where they should be, the Euro will crater against the dollar. And downgrades are just like cockroaches. You never find just one.
I think that a Euro short is one of the cleanest trades out there. I am just waiting for another bogus spike up to reestablish my short.
-
-
-
Cockroaches: You Never Find Just One
https://madhedgefundtrader.com/wp-content/uploads/2019/05/cropped-mad-hedge-logo-transparent-192x192_f9578834168ba24df3eb53916a12c882.png00Mad Hedge Fund Traderhttps://madhedgefundtrader.com/wp-content/uploads/2019/05/cropped-mad-hedge-logo-transparent-192x192_f9578834168ba24df3eb53916a12c882.pngMad Hedge Fund Trader2011-09-21 01:40:582011-09-21 01:40:58September 21, 2011 - IMF Rings the Alarm for the Global Economy
Featured Trades: (APPLE'S NEXT STOP:$1,000), (AAPL)
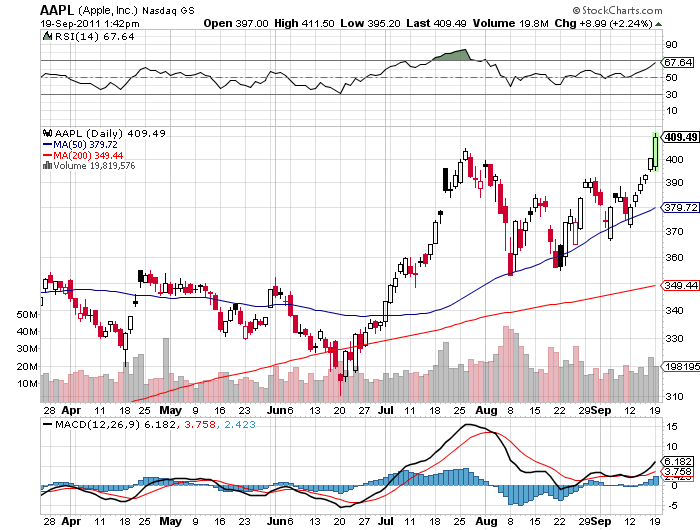
4) Apple's Next Stop: $1,000. Watching Apple (AAPL) post a new all-time high today, I was struck by a wave of nostalgia. When I took a young, cocky, long haired, Levis wearing Steve Jobs around to meet Morgan Stanley's institutional investors to pitch an Apple secondary share offering 28 years ago, I vowed never to buy anything from the man. He was such a great salesman, and possessed such a messianic devotion to his product, the risk of getting legged over had to be great.
This proved a good strategy for the next 18 years, when the company nearly went under three times, and the stock repeatedly plunged from its initial listing price of $22 down to $4. Disastrous products like the Apple Newton came and went, and then poor Steve got fired. Ouch!
Living in the San Francisco Bay Area, I was also creeped out by the fanatical cult following that Steve enjoys. Criticize an Apple product here, and you risk getting attacked, ostracized, deleted from address books, chopped off Christmas card lists, banned from Facebook pages, and ejected from Twitter accounts. There was also no end of abuse from my IPod, Imac, and Tablet addicted kids who accused me of being a dinosaur sticking with my Windows based PC and Blackberry.
I have to confess now that my prior prejudices lead me to miss the boat on Apple for the last decade, when the stock soared from $4 to $420, eventually topping Exxon (XOM) with a gargantuan $390 billion market plus capitalization. To see the company bring out a ground breaking, high end $499-$829 product like the IPad and sell 2 million units in a short two months during unstable economic conditions is nothing less than amazing.
The recent stock performance has also been miraculous, bouncing back from a flash crash low of $195 to challenge its old high in a matter of weeks, while the rest of techland lay in ruins. Forecasts for the global smart phone market are ratcheting up by the day on the back of surging demand from emerging markets. Sales could reach 250 million units annually by 2012, of which 17% currently is sold by Apple.
The company has become a monster cash flow generator, spewing out $12 billion over the last 12 months. It sits on a cash mountain of $66 billion. Apple now has the envious problem in that sales of several of its products are going hyperbolic at the same time. Some analysts have Apple's earnings skyrocketing from the current $25/share to $30 over by next year, which at the current 16 multiple would take the share price up to $480.
If the company's multiple expands to its pre-crash average of 35 X, that would take the stock to a positively nose bleeding $1,050, giving it a 250% return over the next two years. Call me crazy, but if corporate American finally starts supporting Apple products in their own business applications, which I hear is in the works at several Fortune 100 firms, that forecast could be low.
I'm not saying that you should rush out and load up on stock today. But it might be worth taking a stake on the next wave of fear that strikes the market. For momentum players, buy yesterday!
-
-
What a Long and Winding Road It's Been
https://madhedgefundtrader.com/wp-content/uploads/2019/05/cropped-mad-hedge-logo-transparent-192x192_f9578834168ba24df3eb53916a12c882.png00Mad Hedge Fund Traderhttps://madhedgefundtrader.com/wp-content/uploads/2019/05/cropped-mad-hedge-logo-transparent-192x192_f9578834168ba24df3eb53916a12c882.pngMad Hedge Fund Trader2011-09-21 01:30:252011-09-21 01:30:25September 21, 2011 - Apple's Next Stop: $1,000
'A year from now the dominoes will be falling in Europe. The world is going to be a more destabilized place'?.The risk free rate isn't risk free any more. We're not growing as we should be because there is a diminishing rate of return for each additional dollar of debt. In a year, we're going to be in recession again,' said Kyle Bass, of the Dallas, Texas based hedge fund, Hayman Capital.
https://madhedgefundtrader.com/wp-content/uploads/2019/05/cropped-mad-hedge-logo-transparent-192x192_f9578834168ba24df3eb53916a12c882.png00Mad Hedge Fund Traderhttps://madhedgefundtrader.com/wp-content/uploads/2019/05/cropped-mad-hedge-logo-transparent-192x192_f9578834168ba24df3eb53916a12c882.pngMad Hedge Fund Trader2011-09-21 01:00:522011-09-21 01:00:52September 21, 2011 - Quote of the Day
Featured Trades: (TRADERS ARE 'LOST' WITH THE ECONOMIC DATA)
1) Traders Are 'Lost' With the Economic Data. Traders can be forgiven for believing that they are reliving an episode of the cult mystery TV show, 'Lost.' The economic data was truly a mixed bag last week, with lagging reports showing us that the economy is fine, while the most important leading indicators threatening a serious deterioration. They give more credence to the view that the Tea Party inspired near debt default and Standard and Poor's Treasury bond downgrade generated a real dip in the economy last summer.
The July trade deficit showed a stunning decline, from $51.6 billion to $44.8 billion. Due, no doubt to the advantages American exporters are reaping from the weak dollar, the report normally would have been cause for celebration by investors, politicians, and business leaders alike. But they are understandably nervous, gun shy, and punch drunk, and will await further confirmation to sound the 'all clear' signal.
It didn't help that the most crucial of leading indicators, the weekly jobless claims, worsened, rising 11,000 from to 428,000. The four week moving average rose 4,000 to 419,500. Capacity utilization remains in the basement at 77.4%.? This is a stunning figure, as our unused capacity would rank as the fourth largest country in the world, if it were carved out as a separate country. And August inflation rose at double the expected rate, popping 0.4% to a 3.8%., raising the ugly specter of stagflation.
The choppiness of this data suggests that the double dip risk is still on the table, and that market volatility will continue. This is great news for nimble and agile traders like myself, but terrible for long term investors. Watch for those trader alerts!
-
Sell the Rallies, Buy the Dips, or Both?
https://madhedgefundtrader.com/wp-content/uploads/2019/05/cropped-mad-hedge-logo-transparent-192x192_f9578834168ba24df3eb53916a12c882.png00Mad Hedge Fund Traderhttps://madhedgefundtrader.com/wp-content/uploads/2019/05/cropped-mad-hedge-logo-transparent-192x192_f9578834168ba24df3eb53916a12c882.pngMad Hedge Fund Trader2011-09-20 02:00:102011-09-20 02:00:10September 20, 2011 - Traders Are 'Lost' With the Economic Data
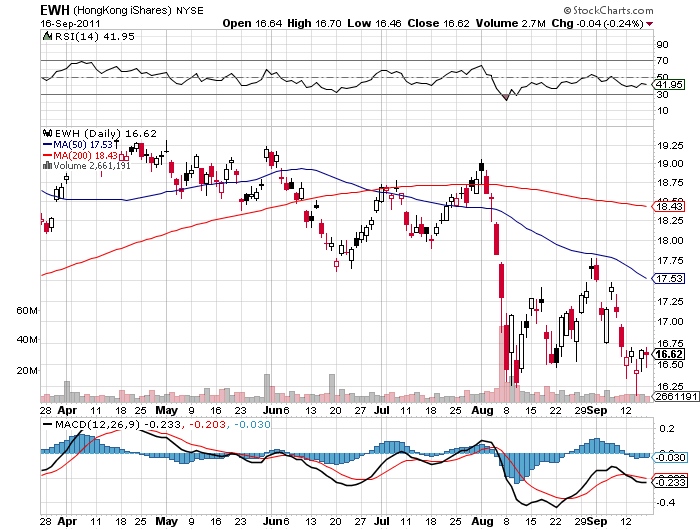
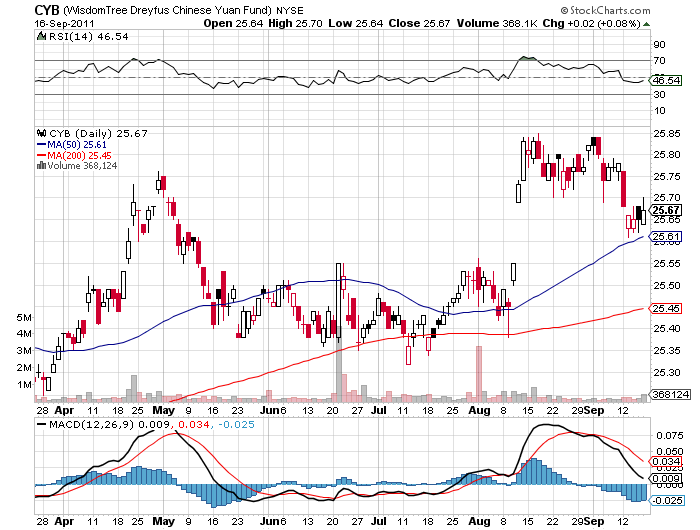
Featured Trades: (BILL ACKMAN'S HONG KONG DOLLAR PLAY), (EWH)
2) Bill Ackman's Hong Kong Dollar Play. You are all well aware of my love affair with the Chinese Yuan (CYB), which I expect to appreciate substantially in coming years off the back of China's continuing economic miracle. Bick Ackman, of Pershing Square Capital Management fame, has come up with his own variation, that of piling on a leveraged long in the Hong Kong dollar.
I often tell investors that Hong Kong is the way to play China if you want to sleep at night. As a holdover from its days as a British Crown Colony, which ended in 1998, it still employs largely western style accounting and corporate governance standards. Blowups of the variety that we are seeing in mainland companies, like Sino Forest, are much less common.
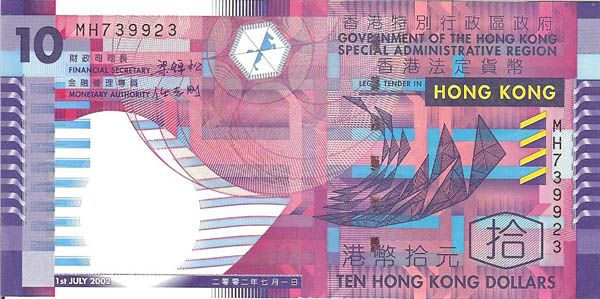
The Hong Kong economy is growing at a 6% annual rate, with 5% inflation, and a 3% unemployment rate. These are numbers that any developed country finance minister or politician would kill for. But because of an accident of history, the Hong Kong dollar has always been pegged to a foreign currency, first the British pound, and for the last 27 years, the US dollar. So while it's economic policy is, in effect, made in Beijing, monetary policy is determined in Washington. This can't last.
Since the peg was established in 1983, Hong Kong has risen from an up and coming frontier market with almost laughable volatility to a triple 'A' credit. (A close friend of mine received an Order of the British Empire from Queen Elizabeth for engineering the scheme). Despite this stellar performance, the peg has made the Hong Kong dollar one of the weakest currencies in Asia. It really should be trading on par with the Singapore dollar, which has been moving from strength to strength for similar reasons. Let it float, and you could see a very rapid 30% appreciation from its current 12.84 cents.
Ackman has taken his position in the form of highly leveraged over the counter, out of the money call options that do not trade on any exchange, and were most likely custom written by a major investment banks. There is no Hong Kong dollar ETF, and the Hong Kong iShares ETF (EWH) gives you exposure to both the currency and local blue chip equities.
Big hedge funds can do as Bill did and buy some custom options, although this is an expensive way to do it. Those with large credit lines can put on this trade through the interbank market where you can get 10:1 leverage. Individuals are limited to buying outright cash in Hong Kong dollars, or invest in the ETF and take the equity risk as well, where the long term prospects are excellent.
The Hong Kong currency could be dragged up by any move by China to float the Yuan, which is just a matter of time. But recent leaks from senior officials at the People's Bank of China suggest that this is at least five years off.
Bick Ackman is not that patient. He expects the Hong Kong dollar to go ballistic within the next 12-18 months, which is the maturity of his options position. Longer than that, and he will simply roll forward the position when it expires. When is the next potential trigger? Next April, when local elections may tempt bold moves on the monetary front.
-
-
-
A Peg Worth an OBE
https://madhedgefundtrader.com/wp-content/uploads/2019/05/cropped-mad-hedge-logo-transparent-192x192_f9578834168ba24df3eb53916a12c882.png00Mad Hedge Fund Traderhttps://madhedgefundtrader.com/wp-content/uploads/2019/05/cropped-mad-hedge-logo-transparent-192x192_f9578834168ba24df3eb53916a12c882.pngMad Hedge Fund Trader2011-09-19 01:50:182011-09-19 01:50:18September 19, 2011 - Bill Ackman's Hong Kong Dollar Play
'Average is over. If you just show up now for your job in an average way, that's not going to cut it anymore. James Reston, a famous columnist in the sixties and seventies, used to have my office, and he would come into work each day wondering what his seven competitors were going to write about. I come into work wondering about what my 70 million competitors are going to do,' said Tom Friedman, a columnist for the New York Times.
https://madhedgefundtrader.com/wp-content/uploads/2019/05/cropped-mad-hedge-logo-transparent-192x192_f9578834168ba24df3eb53916a12c882.png00Mad Hedge Fund Traderhttps://madhedgefundtrader.com/wp-content/uploads/2019/05/cropped-mad-hedge-logo-transparent-192x192_f9578834168ba24df3eb53916a12c882.pngMad Hedge Fund Trader2011-09-19 01:00:052011-09-19 01:00:05September 19, 2011 - Quote of the Day
4) Testimonial.? I am a 25 year veteran of the financial industry and run one of the largest wealth management teams at one of the largest banks in the country.? This is my second time subscribing, I'm always looking for good ideas.? My man, you are a freak. If this were a few hundred years ago we would burn you at the stake as a Warlock. I have never, ever, written a congratulatory email??But day after day, you are the most accurate trader I have ever seen. I'm truly flabbergasted. My wife even heard me say "holy ****".
Barry
Atlanta, Georgia
https://madhedgefundtrader.com/wp-content/uploads/2019/05/cropped-mad-hedge-logo-transparent-192x192_f9578834168ba24df3eb53916a12c882.png00Mad Hedge Fund Traderhttps://madhedgefundtrader.com/wp-content/uploads/2019/05/cropped-mad-hedge-logo-transparent-192x192_f9578834168ba24df3eb53916a12c882.pngMad Hedge Fund Trader2011-09-16 01:30:252011-09-16 01:30:25September 16, 2011 - Testimonial
'There's no retail inflows. The hedge fund community has derisked. So the algorithm based, high frequency traders have taken up the slack, and are now responsible for 70% of the total trading activity in the market every day. It's a very difficult environment to create alpha, or excess returns in. Are your clients frustrated?
https://madhedgefundtrader.com/wp-content/uploads/2019/05/cropped-mad-hedge-logo-transparent-192x192_f9578834168ba24df3eb53916a12c882.png00Mad Hedge Fund Traderhttps://madhedgefundtrader.com/wp-content/uploads/2019/05/cropped-mad-hedge-logo-transparent-192x192_f9578834168ba24df3eb53916a12c882.pngMad Hedge Fund Trader2011-09-16 01:00:222011-09-16 01:00:22September 16, 2011 - Quote of the Day
Featured Trades: (BUY THE DIP IN CORN), (CORN), (DBA), (JJG)
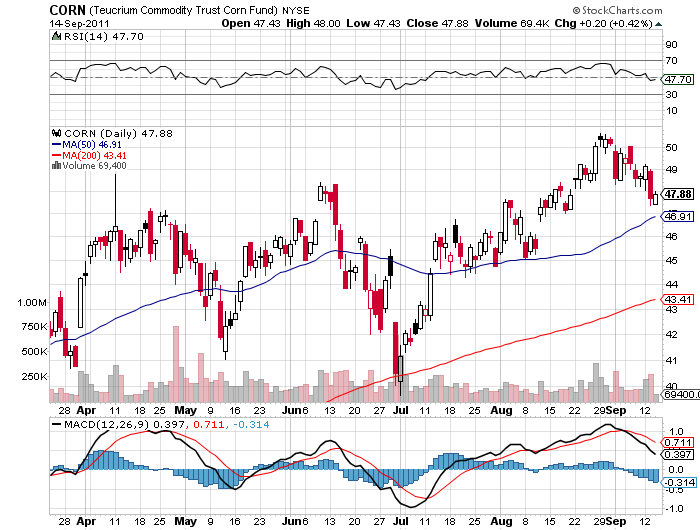
1) Buy the Dip in Corn. The US Department of Agriculture released its monthly crop report on Monday, underlining the tremendously bullish conditions for corn, which I have been harping away about in this letter for months. What did the markets do? They sold off, delivering a classic 'buy the rumor, sell the move' type of reaction.
As I expected, corn yields were chopped from 153.0 bushels per acre to 148.1. The total US crop was downsized from 12.914 billion bushels to 12.497 billion. Global demand conditions were reduced, which I find incredible, given the distressed conditions found around the world. Since the department collected its data, conditions have worsened appreciably, thanks to the incredibly hot weather that has been searing the South and the Midwest. Look no further than the unprecedented Texas fires.
This is not a market that has given you a lot of windows to get into. I will try to hang on for a pull back to the 50 day moving average for the ETF (CORN) at $46.90, down 8% from its recent high. Every dip over the last 2 1/2 months has been a 'buy' for corn, and I expect that this time will be no different.
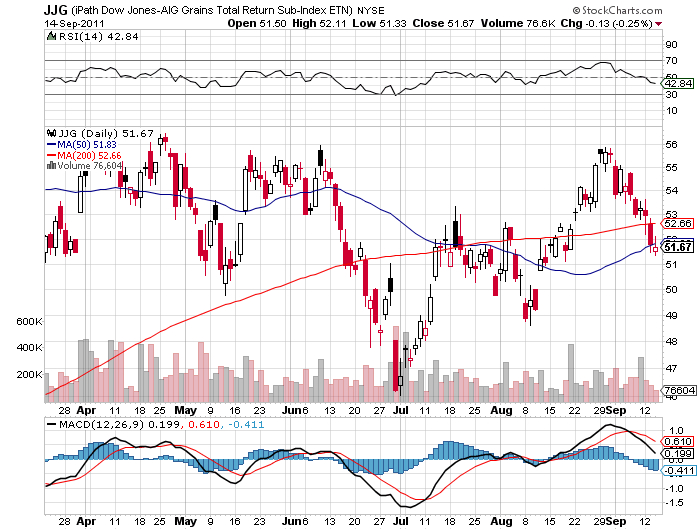
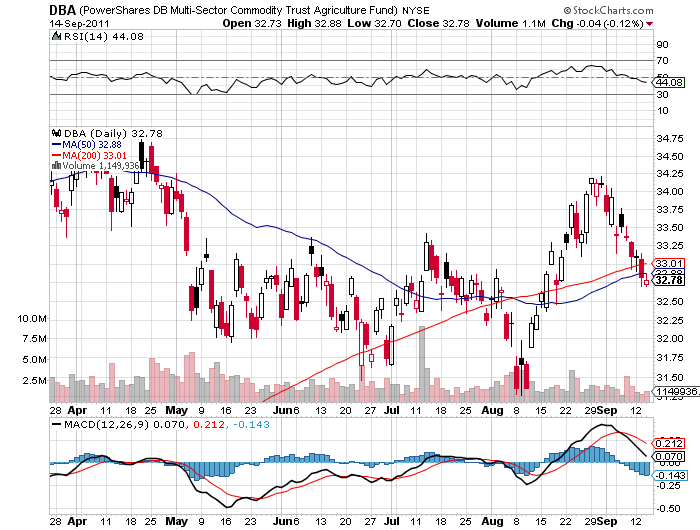
You can also take a look at the grain ETF (JJG) and the PowerShares DB Multisector Commodity Trust Agriculture Fund (DBA). And if I'm wrong, you can always take delivery and eat your position.
-
-
-
-
Is This a Buy Signal?
https://madhedgefundtrader.com/wp-content/uploads/2019/05/cropped-mad-hedge-logo-transparent-192x192_f9578834168ba24df3eb53916a12c882.png00Mad Hedge Fund Traderhttps://madhedgefundtrader.com/wp-content/uploads/2019/05/cropped-mad-hedge-logo-transparent-192x192_f9578834168ba24df3eb53916a12c882.pngMad Hedge Fund Trader2011-09-15 02:00:552011-09-15 02:00:55September 15, 2011 - Buy the Dip in Corn
Legal Disclaimer
There is a very high degree of risk involved in trading. Past results are not indicative of future returns. MadHedgeFundTrader.com and all individuals affiliated with this site assume no responsibilities for your trading and investment results. The indicators, strategies, columns, articles and all other features are for educational purposes only and should not be construed as investment advice. Information for futures trading observations are obtained from sources believed to be reliable, but we do not warrant its completeness or accuracy, or warrant any results from the use of the information. Your use of the trading observations is entirely at your own risk and it is your sole responsibility to evaluate the accuracy, completeness and usefulness of the information. You must assess the risk of any trade with your broker and make your own independent decisions regarding any securities mentioned herein. Affiliates of MadHedgeFundTrader.com may have a position or effect transactions in the securities described herein (or options thereon) and/or otherwise employ trading strategies that may be consistent or inconsistent with the provided strategies.