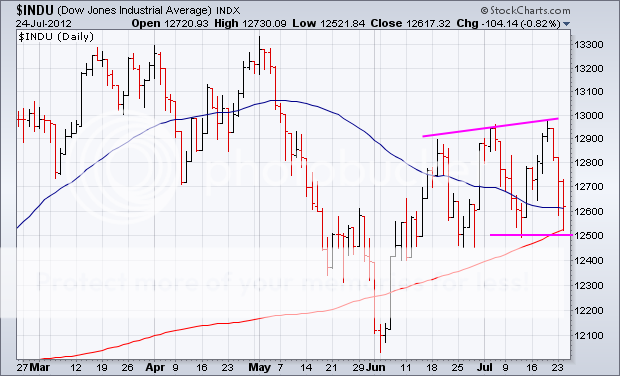
It is a fact of life that markets get overstretched. Think of pulling on a rubber band too hard, or loading too many paddlers at one end of a canoe. Whatever the metaphor, the outcome is always unpleasant and sometimes disastrous.
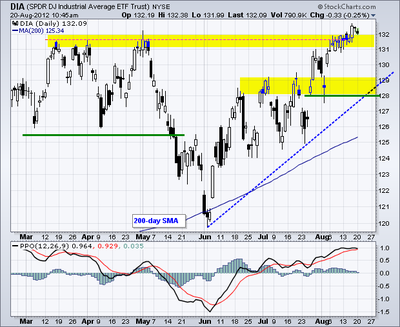
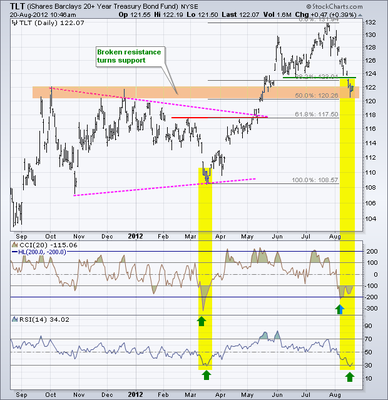
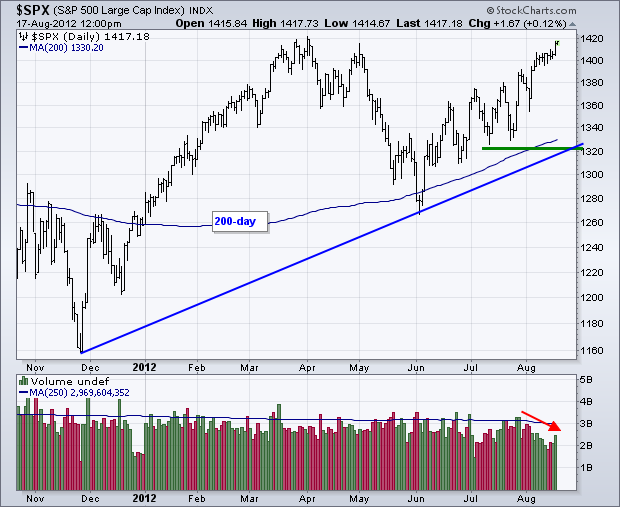
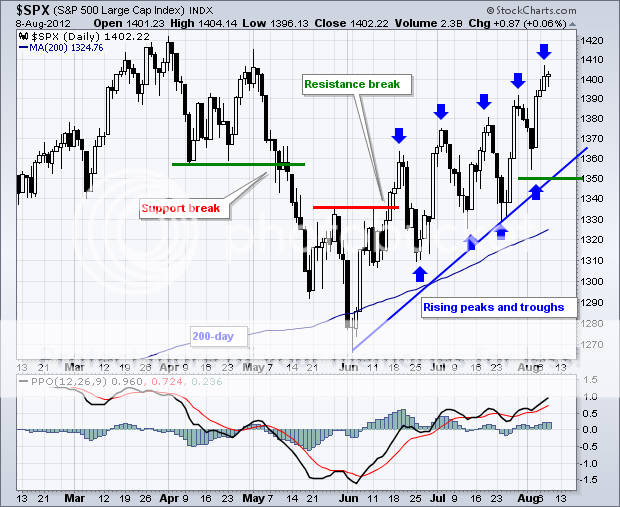
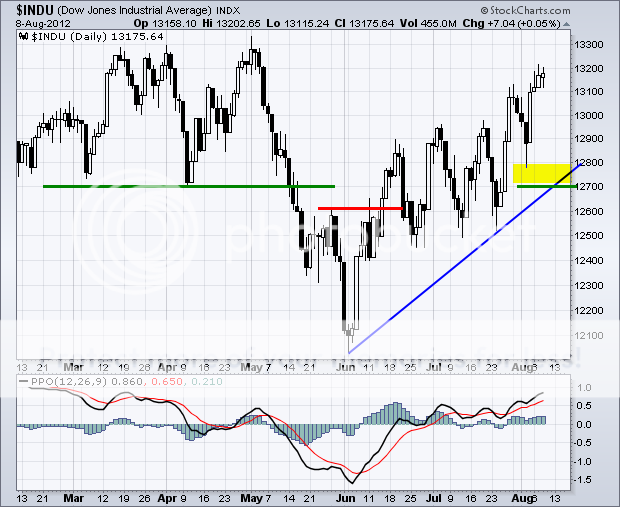
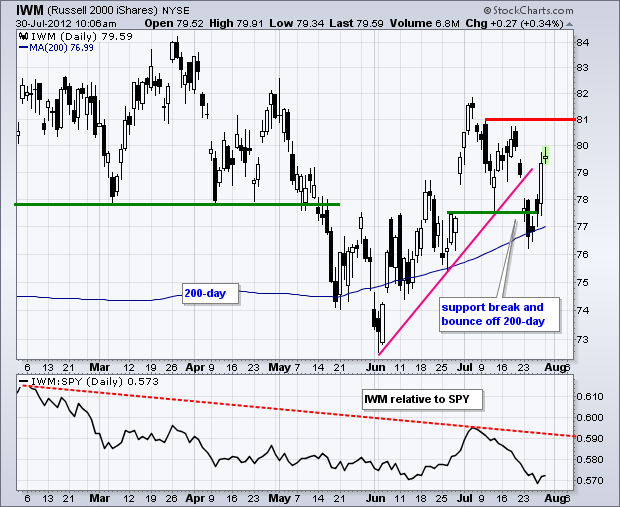
Take a look at the charts below and you can see how extended markets have become. Stocks (DIA), (QQQ), (IWM) have reached the top of decade and a half trading ranges. Bonds (TLT), (LQD) are at three month lows, and yields have seen the sharpest back up in over a year.
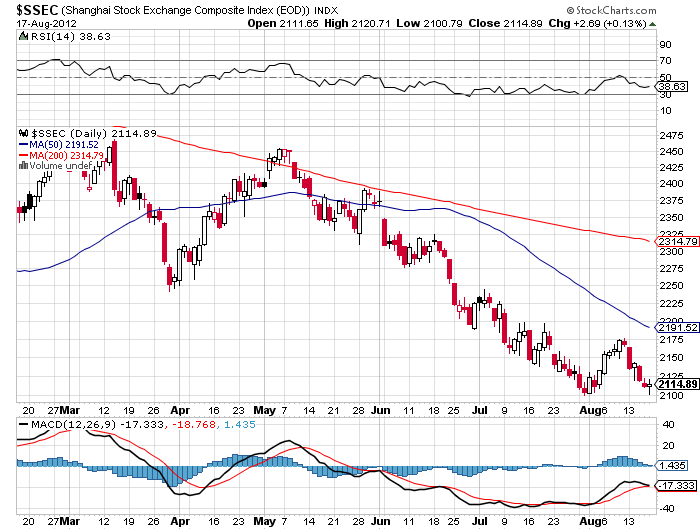
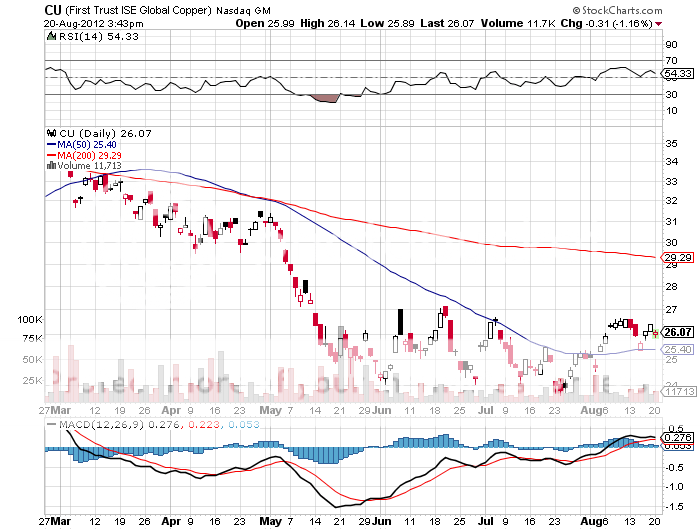
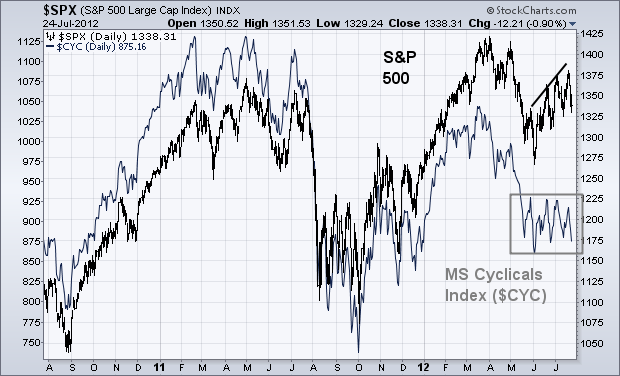
In the meantime, the non-confirmations of these trends are a dime a dozen. Every trader?s handbook says that you unload risk assets like crazy whenever you see the volatility index (VIX) trade in the low teens for this long. The Shanghai Index ($SSEC), representative of the part of the world that generates 75% of the world?s corporate profits, hit a new four year low last night. Copper (CU) doesn?t believe in this risk rally for a nanosecond. Nor is the Australian dollar (FXA) signaling that happy days are here again.
I am betting that when the whales come back from their vacations in Southampton, Portofino, or the South of France, they are going to have a heart attack when they see the current prices of risk assets. A big loud ?SELL? may be the consequence of a homecoming. A Jackson Hole confab of central bankers that delivers no substantial headlines next week could also deliver the trigger for a sell off.
You may have noticed that European Central Bank president, Mario Draghi, has come down with a case of verbal diarrhea this summer. His pro-bailout comments have been coming hot and heavy. When the continent?s leaders return from their extended six week vacations, it will be time to put up or shut up. The final nail in this coffin could be A Federal Reserve that develops lockjaw instead of announcing QE3 at their September 12-13 meeting of the Open Market Committee.
To me, it all adds up to a correction of at least 5%, or 70 points in the S&P 500, down to 1,350. I?m not looking for anything more dramatic than that in the run up to the presidential election. I am setting up my bear put spreads to reach their maximum point of profitability in the face of such a modest setback. A dream come true for the bears would be a retest of the May lows at 1,266, however unlikely that may be.
For the real crash, you?ll have to wait for 2013 when a recession almost certainly ensues. Stay tuned to this letter as to exactly when that will begin.
?The Real Crash Isn?t Coming Until 2013
https://madhedgefundtrader.com/wp-content/uploads/2019/05/cropped-mad-hedge-logo-transparent-192x192_f9578834168ba24df3eb53916a12c882.png00DougDhttps://madhedgefundtrader.com/wp-content/uploads/2019/05/cropped-mad-hedge-logo-transparent-192x192_f9578834168ba24df3eb53916a12c882.pngDougD2012-08-20 23:03:132012-08-20 23:03:13Watch Out for the Coming Risk Reversal
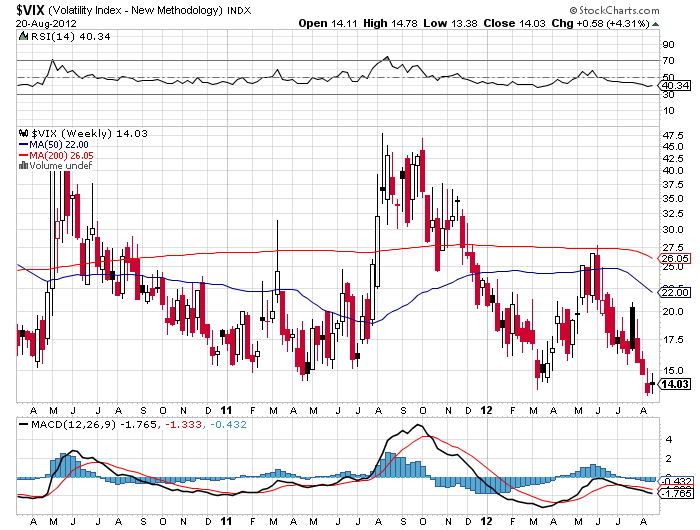
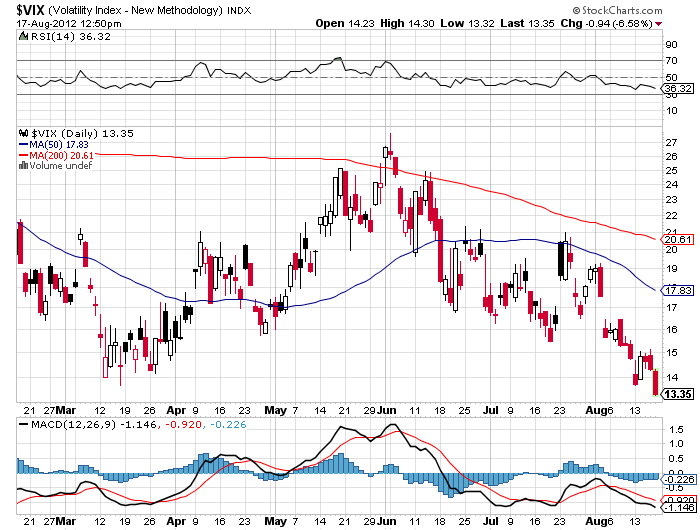
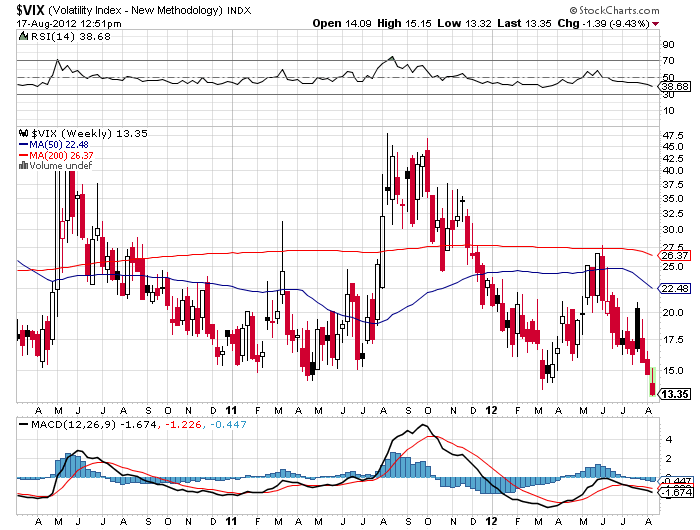
Mr. Market sometimes speaks in mysterious tongues, and you really have to wonder what he is struggling to tell us by taking the Volatility Index (VIX) down to a subterranean $13 handle on Friday, a new five year low.
A number of advisors have been recommending that investors load up on the (VIX) in recent months to give them downside protection from an imminent market crash. Those who followed such advice were hammered, their clients no doubt striking them off invitation lists for summer barbeques.
In the past month, the (VIX) has cratered from $20 to $13. Just last October, it touched $49, when I urged readers to pile in on the short side. I came out in the mid-$30?s weeks later.
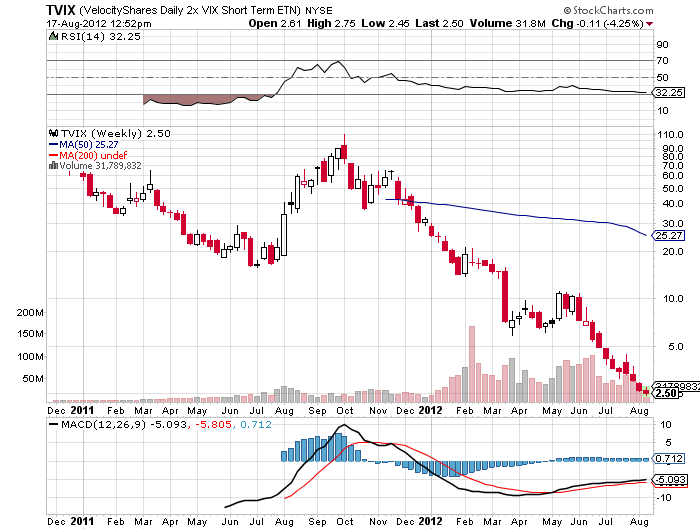
Those who traded the triple leveraged (TVIX) fared even worse, this blighted ETF plunging from $5 to $2.50 during the same period. The (TVIX) is doing the best impression of an ETF going to zero that I know of. A year ago it was trading at $110. This is why I plead with traders to avoid triple leveraged ETF?s like the plague. These things are designed for day trading by hedge funds only. Eventually, they all go to zero.
I am even seeing this in my own portfolio. A week ago, I sold short the September, 2012 (SPY) $147 calls at $0.38. A week later, the (SPY) has risen by 1.2% but the call options have done a swan dive to $0.34. This can only happen when they are crushing volatility.
I quit recommending (VIX) plays in March when I realized that there is some sort of arbitrage going on in the hedge fund community that is punishing (VIX) owners. I haven?t figured out the exact mathematical dynamics yet, but it has to involve selling short the cash stocks and shorting (VIX) contracts against them. Whatever they lose on the cash short is more than made up by the profits on their (VIX) short.
It?s easy to see how successful this would be. While August (VIX) traded at a lowly 13.40%, September volatility is still up at 18%, and January, 2013 is trading at a positively nosebleed 25%. That spread provides a lot of room to take in some serious money.
So what is the 13% really trying to tell us? Here are some thoughts:
*It is discounting multiple tranches of quantitative easing by central banks around the world that take all asset prices up for the rest of the year.
*It reflects the complete abandonment of the stock market by the individual investor, which is why trading volume has collapsed.
*It also indicates how exchange traded funds are taking over, sucking volume out of the stock market. The (VIX) doesn?t reflect activity in ETF?s.
*It could be discounting an Obama win in the presidential election. Stocks have delivered a 72% return since the Obama inauguration, the third best in history after Franklin Roosevelt and Bill Clinton. Mixed stock and bond portfolios have delivered the best returns on record, with both asset classes appreciating dramatically for 3 ? years, something that never happens.
It could be that the (VIX) at this level has it all wrong, and that a stock market selloff is about to send it soaring. Those who have rigidly held on to that belief until now have been severely tested.
For those who have fortunately avoided the (VIX) trade so far, let me give you a quick primer. The CBOE Volatility Index (VIX) is a measure of the implied volatility of the S&P 500 stock index. You may know of this from the talking heads on TV, beginners, and newbies who call this the ?Fear Index?.
For those of you who have a PhD in higher mathematics from MIT, the (VIX) is simply a weighted blend of prices for a range of options on the S&P 500 index. The formula uses a kernel-smoothed estimator that takes as inputs the current market prices for all out-of-the-money calls and puts for the front month and second month expirations.
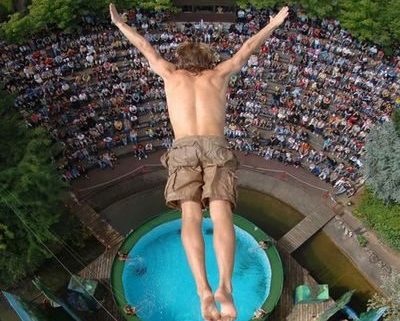
Ready to Take the Plunge on Volatility?
https://www.madhedgefundtrader.com/wp-content/uploads/2012/08/high_dive.jpg360400DougDhttps://madhedgefundtrader.com/wp-content/uploads/2019/05/cropped-mad-hedge-logo-transparent-192x192_f9578834168ba24df3eb53916a12c882.pngDougD2012-08-19 23:03:562012-08-19 23:03:56The Volatility Death Spiral Continues
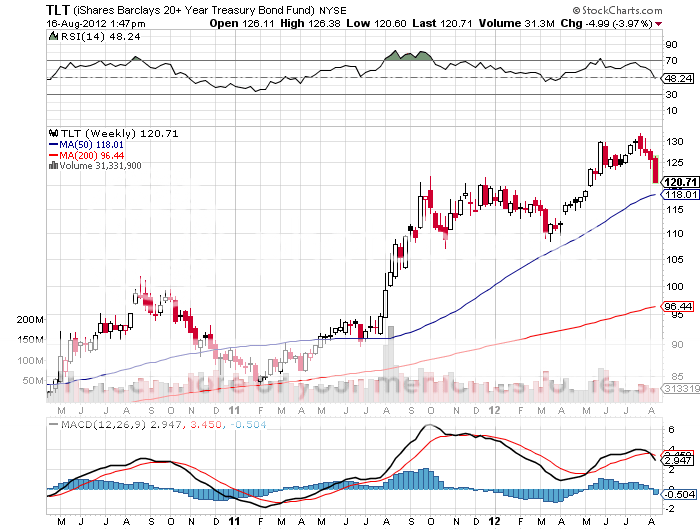
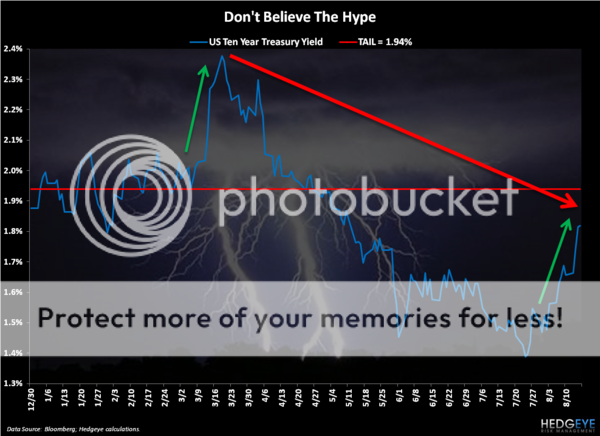
The Treasury bond market has just suffered one of the most horrific selloffs in recent memory, taking the yield on ten year paper up from 1.38% to an eye popping 1.83% in weeks, a three month high.
Yields have just risen by an amazing 38%. This has dragged the principal Treasury bond ETF (TLT) down from $132 to $120. Those who were pining to get into this safe haven at a better entry point now have their chance.
Rumors for the plunge have been as numerous as bikinis on an Italian beach. Some have pointed to a suspected unwind of China?s massive $1 trillion in Treasury bond holdings. Others point to the incredibly thin summer market trading conditions. Add to that a relentlessly heavy new issue calendar by the government. After all, they have a $1.4 trillion budget deficit to finance this year. That works out to $4 billion a day.
Long term strategists point to more fundamental reasons. The spread between the ten year yield and the S&P 500 dividend yield is the narrowest in history. Even after the recent slump, equity yields still beat bonds by 20 basis points. This has never happened before. The smarter money began shifting money out of bonds into stocks months ago.
However, I think that an excellent trading opportunity is setting up here for the brave and the nimble. There is a method to my madness. Here are my reasons:
*US corporate earnings are slowing at a dramatic pace. Some 40% of those reporting in Q2 delivered revenues misses. They made up the bottom line by firing more people. This is the worst performance since early 2008. Remember how equity ownership worked out after that?
*The high price of oil is now starting to become a problem and will inflict its own deflationary effects. If we maintain the 24% price hike we have seen in recent months, that will start to present a serious drag on the economy.
*Fiscal Cliff? Has anyone heard about the fiscal cliff? This 4% drag on GDP growth, another name for a recession, is looming large.
*Don?t forget that the rest of the world economy is going to hell in a hand basket. The China slowdown continues unabated, and a hard landing is still on the table. Europe is in the toilet. Japan?s growth is on life support.
*The Chinese aren?t selling. They told me so. They are merely reallocating a larger portion of their monthly cash flow to Europe where yields are a multiple higher. They are doing this because I told them to. This helps support the Euro. Keeping the currency of its largest trading partner strong to preserve exports is in its best interest.
*QE3? Remember QE3? Even if the Federal Reserve doesn?t implement this expansionary monetary policy, Europe will. And the Fed will probably join in 2013 when we head into the next recession.
*Paul Ryan for VP? If elected, his death wish for the Federal Reserve will send asset prices everywhere plummeting, including stocks and bonds. Since Romney?s fumbled announcement, Treasury bond yields have soared by 25 basis points.
There are many ways to play this game. Just pick your poison. The obvious pick here is to buy the (TLT) just over the 200 day moving average at $119. You could buy an October $120-$125 (TLT) call spread in the options market for a quick bounce. If you really want to get clever, you can sell short the $110-$115 call spread, which has a breakeven in terms of the ten year Treasury yield of 2.10%.
The safe haven trade is not gone for good. It?s just enjoying a brief summer vacation.
Those Treasury Bond Yields Were Getting Mighty Thin
https://madhedgefundtrader.com/wp-content/uploads/2019/05/cropped-mad-hedge-logo-transparent-192x192_f9578834168ba24df3eb53916a12c882.png00DougDhttps://madhedgefundtrader.com/wp-content/uploads/2019/05/cropped-mad-hedge-logo-transparent-192x192_f9578834168ba24df3eb53916a12c882.pngDougD2012-08-16 23:03:362012-08-16 23:03:36Get Ready to Buy the Bond Market
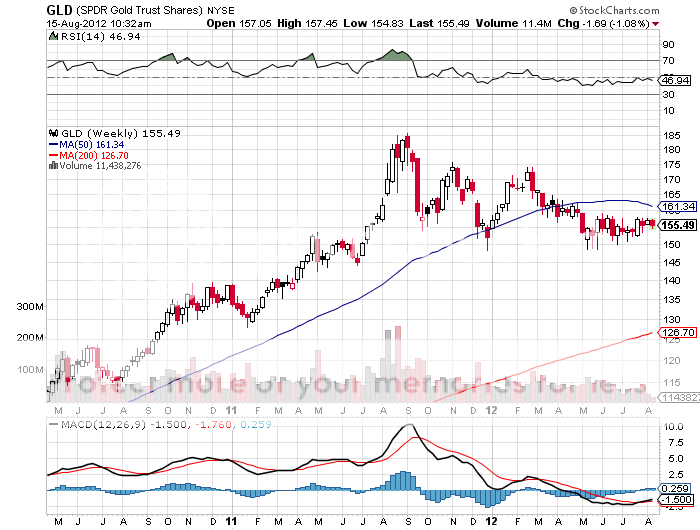
Gold has clearly evolved into a call option on global quantitative easing. Don?t think of it just as the stuff your dentist puts in your teeth or the thing your girlfriends gets you to wrap around her finger anymore. I don?t think that the Federal Reserve will implement QE3 at its September 16-17 meeting, or even next year. This shocking realization will be bad for gold prices.
However, Europe is a completely different kettle of fish. Having just spent two months there, I can tell you with great certainty that the economic conditions are far more extreme than any economic data releases are indicating so far.
So the ECB has to launch its own QE through a second tranche of the LTRO or some other vehicle of at least ?500 billion ? ?1 trillion. While most of this money will be used to buy high yield European sovereign bonds, some will spill over into the gold market, and that will be good for prices.
I can?t tell you how bad things are in Italy. I just visited the main middle class shopping district in Milan. The sales were offering discounts of 70%, 80%, and 90%. They were literally throwing inventory out the door. I?m talking pants for $5 and overcoats for $25. I ended up buying four suitcases, those at 50% off, and filing them up with clothes for everyone I know. I got clothes for the kids, cloths for distant relatives, even clothes for people I don?t like. And it barely made a dent on my credit card.
The attraction of the September 2012 $148-$151 call structure is the following. The $151 strike is just below rock solid support for gold that has held for several months. The September expiration allows us to take out 90% of the profit before the Fed gives us the bad news on no QE3 next month. Gold could well keep moving sideways until then, which is why I am not rushing out and buying out-of-the-money calls. This all happens going into the traditional seasonal strength of the Indian wedding season, Christmas in the West, and the Chinese Lunar New Year.
By leveraging up an out of the money call spread in a limited risk position, I get an outsized return. This is a bet that gold will move up, sideways, or down no more than 3% over the next four weeks. If this happens, the call spread will rise in value from $2.42 to $3.00, a gain of 24%. This is why I went for a heavy 10% weighting.
Better Bring an Extra Suitcase
https://madhedgefundtrader.com/wp-content/uploads/2019/05/cropped-mad-hedge-logo-transparent-192x192_f9578834168ba24df3eb53916a12c882.png00DougDhttps://madhedgefundtrader.com/wp-content/uploads/2019/05/cropped-mad-hedge-logo-transparent-192x192_f9578834168ba24df3eb53916a12c882.pngDougD2012-08-15 23:03:242012-08-15 23:03:24Time to Pick Up Some Gold
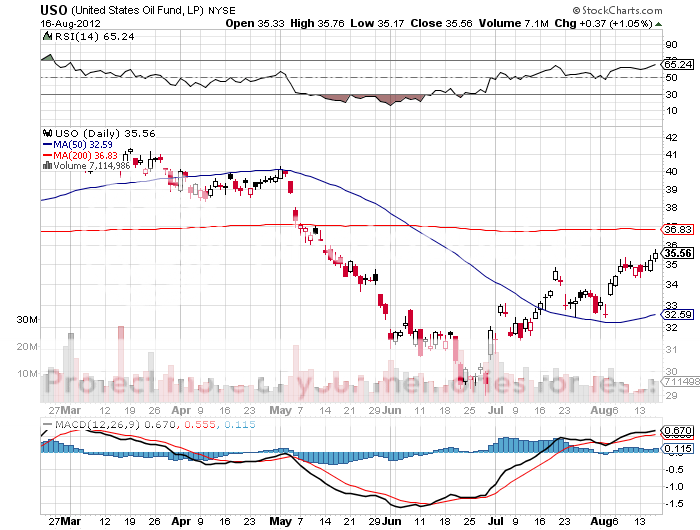
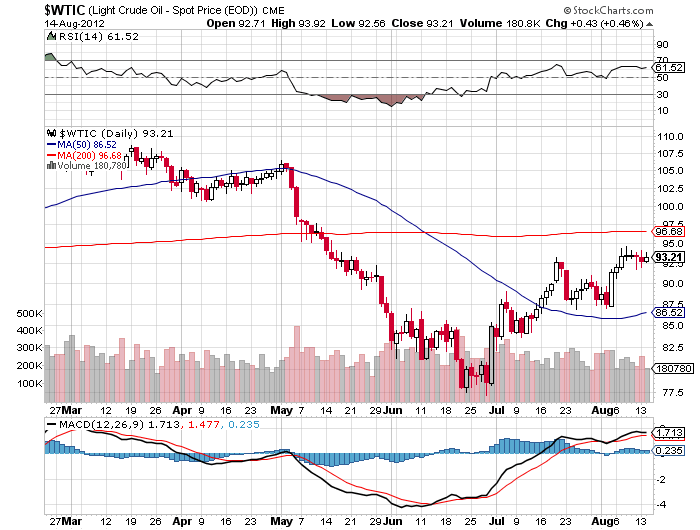
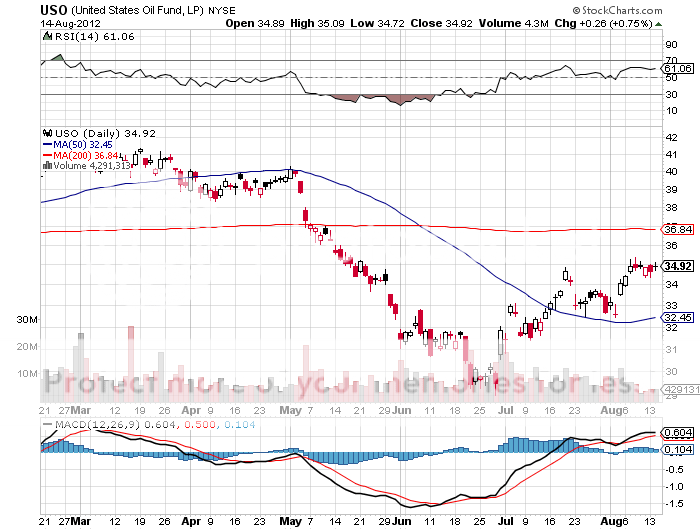
If volatility and lack of direction in the equity market are driving you nuts these days, thank your lucky stars you?re not in the oil market. Only last night, a Japanese supertanker plowed into a US Navy destroyer, causing prices to spike. That?s assuming that you had time to notice while sifting through numerous, contradictory leaks from Israeli intelligence about whether they will, or will not, imminently attack Iran. Oh, and don?t forget, demand from Europe is disappearing up its own tailpipe.
My take is that the administration is pursuing the correct policy on Iran. With Europe joining the embargo on June 30, and its major means of trade financed with the dispatch of Standard Chartered, Iran?s economy is now caught in a vice. With minimal domestic refining capacity, the country is drowning in its own oil, but facing several gasoline shortages. Some essential foodstuffs have doubled in price. These are key ingredients needed for the Arab Spring to spill into Iran. Then the country falls into our lap like an overripe piece of fruit, without a shot fired.
It could well be that none of this makes any difference to the price of crude. Like every other asset class, it has become hostage to the likelihood of another round of quantitative easing from the Federal Reserve. West Texas Intermediate has moved an impressive $18 off of its $77 low on the prospect of QE3 alone. All that is left is for Ben Bernanke to pull the trigger.
Our first chance at a hint will be at the Jackson Hole confab of central bankers on August 26. After that, we have to wait until the September 18-19 Open Market Committee Meeting for relief. It is safe to say that if Ben delivers, oil could be trading at triple digits very quickly. If he doesn?t, then we could be plumbing new lows shortly.
That put us in the same risk/reward dilemma for oil as with the equity markets. Note the imbalance. If we get QE3, then we can entertain $6 of upside. If we don?t, you are looking at $25 of downside. Hint: strapping on risk/reward trades like this is not how hedge fund managers get rich.
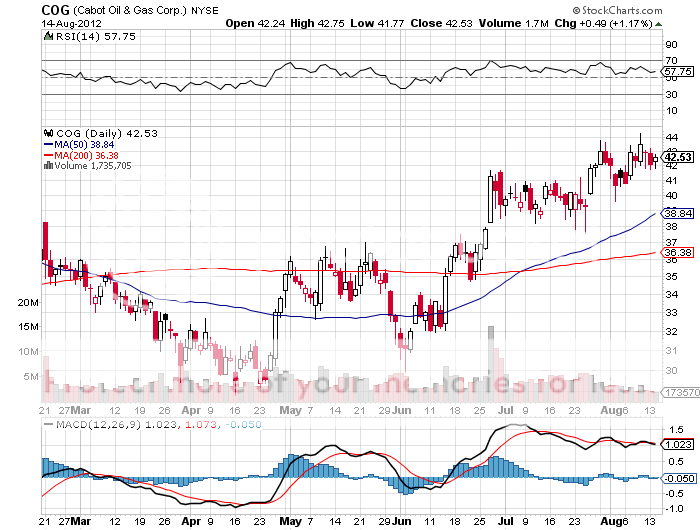
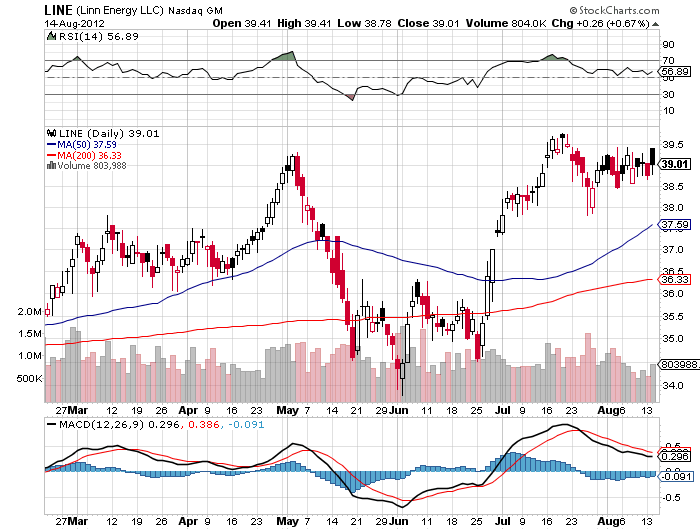
That makes me a happier buyer on the next big dip than a chaser up here. Names to focus on? ExxonMobile (XOM), Occidental Petroleum (OXY), and Cabot Oil & Gas (COG), as well as the master limited partnerships like Kinder Morgan (KMP), Enbridge Energy Partners (EEP), Trans Montaigne Partners (TLP), Linn Energy (LINE).
That?s all for today. It is hard to write brilliant, seamless prose when you?re brain dead and mindless from nine hours of jet lag. Besides, the whales are still on vacation at Southampton and the South of France, so my traditional sources of hot tips will remain dry for another week or so. Damn! I should have taken an extra week off to investigate economic conditions in the Greek Islands. With a Depression on, I hear that hotels that normally go for $2,000 a day can be had for $2,000 a week.
https://madhedgefundtrader.com/wp-content/uploads/2019/05/cropped-mad-hedge-logo-transparent-192x192_f9578834168ba24df3eb53916a12c882.png00DougDhttps://madhedgefundtrader.com/wp-content/uploads/2019/05/cropped-mad-hedge-logo-transparent-192x192_f9578834168ba24df3eb53916a12c882.pngDougD2012-08-14 23:03:592012-08-14 23:03:59The Slippery Slope for Oil
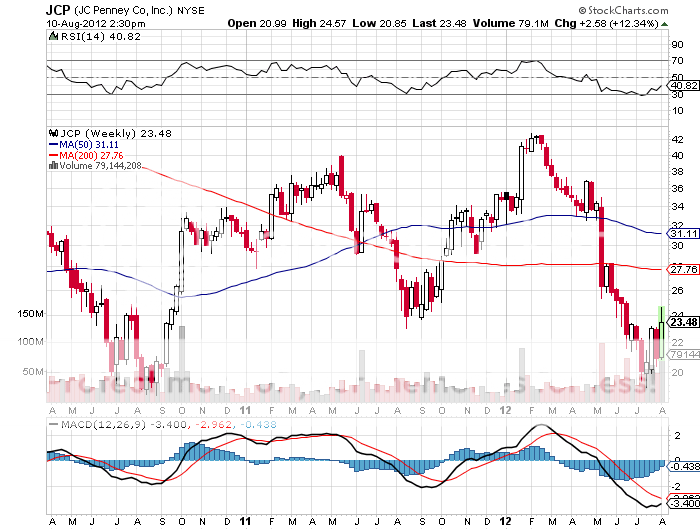
The stock of the day last Friday was, no doubt, JC Penny (JCP), one of the most heavily shorted stocks in the market, which announced Q2, 2012 earnings. Despite a huge miss, the stock soared by 20% because the losses were not as bad as many expected. This leads to the question of whether traders should double up or bail on the existing short positions.
As the dispassionate analyst that I am, who only looks at numbers in the cold, harsh light of reality, the figures could not have been more disappointing. Q2 EPS showed a loss of $0.37/shares versus an expected loss of $0.25. Revenues came in at $3 billion compared to an estimate of $3.2 billion.
Worst of all, same store sales cratered by -21.7% YOY while traffic was off -12%. This is despite offering kids free haircuts. Gross margins shrank and Internet sales were off 30%. To top it all, the company announced that it would no longer provide future guidance. Moody?s immediately followed with a downgrade of the company?s debt from Ba1 to Ba3.
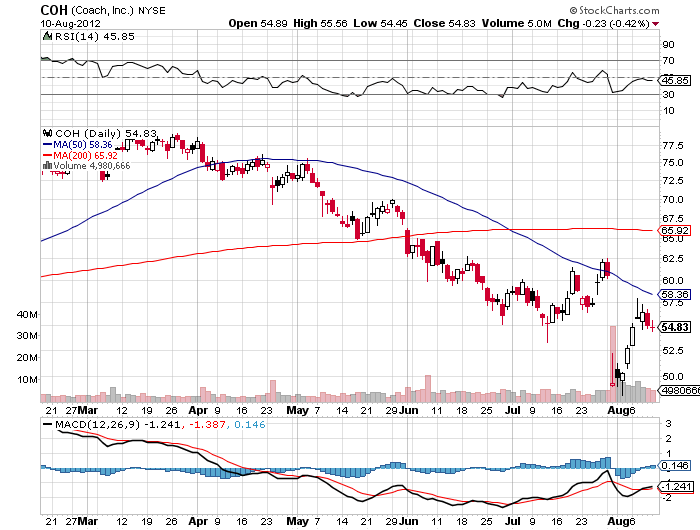
The new CEO, Ron Johnson, has no retail experience and says he needs 4 years for a turnaround. In the meantime, competitor Macys is making good money and selling at 11X earnings with the best CEO in business. Well established luxury brand Coach (COH) sells for a 14X multiple. If you fall in love with retail and absolutely have to be in this sector, there are far better fish to fry. Personally, I would rather lie down and take a long nap.
The hedgies still in this name are clearing gunning for a chapter 11. So a chance to sell again 20% higher than yesterday in the face of bad news has to be attractive. But with such a huge share of the company?s outstanding shares already sold short, the risk reward here is not great. I would have ridden the stock down from $40 to $20 and then said, ?Thank you very much?, rather than chase the last few dollars just to prove I?m right.
The company only has to get a little right to trigger a bigger short squeeze. Technicians were clearly focused on a potential multiyear double bottom on the charts. Besides, I was never one for sloppy seconds, and don?t need a haircut.
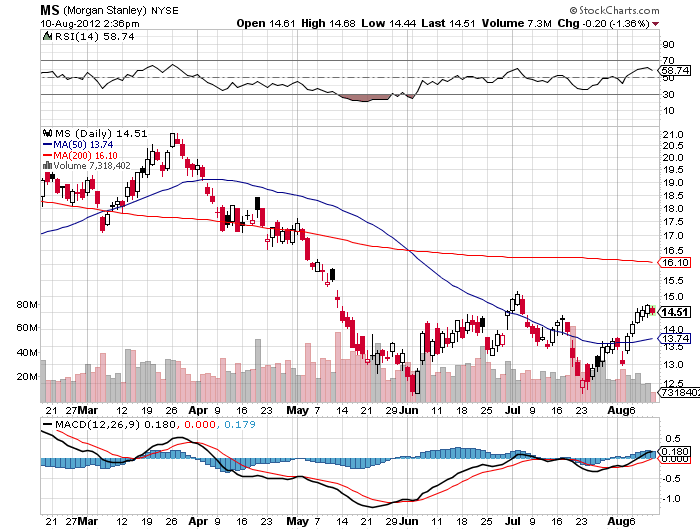
Looking for a better stock to sell short at the top of the recent range with dire fundamentals? I?d rather short Morgan Stanley on an up day.
JC Penny: Better Fish to Fry
https://madhedgefundtrader.com/wp-content/uploads/2019/05/cropped-mad-hedge-logo-transparent-192x192_f9578834168ba24df3eb53916a12c882.png00DougDhttps://madhedgefundtrader.com/wp-content/uploads/2019/05/cropped-mad-hedge-logo-transparent-192x192_f9578834168ba24df3eb53916a12c882.pngDougD2012-08-12 23:03:432012-08-12 23:03:43Double Up or Bail on Your JC Penny Short?
Welcome to the ?Heads I win, tails you lose? market. The prospect of imminent quantitative easing by the US, Europe, China, and even Japan is supporting asset prices globally. The worse the economic data reports, the greater the likelihood of such action, and the higher prices can rise. In this topsy turvey world, bad becomes good, and worse is even better.
The only reason for the central banks not to act is if the economy starts to reaccelerate on its own without outside intervention. So the choices presented to investors are really quite limited: you either buy, or you buy. This is the twisted logic that has allowed traders to run the markets up to within 2% of the four year highs on incredibly small volume.
There is only one problem with this approach to the market. It requires mental gymnastics that would earn a gold medal at the London Olympics.
The harsh reality is that this impressive gain in the market has occurred in the face of decidedly deteriorating fundamentals. American companies managed to eke out a 5% gain in earnings in Q2, down from a 15% increase a year ago. Adjust for inflation and this growth rate approaches zero in real terms.
What is particularly disturbing is that they achieved these scanty results in the face of falling revenues. They did this by cutting costs, primarily through the firing of workers. This is why the unemployment rate remains at a stubbornly high 8.3%, despite some of the most impressive stimulus measures in history. Companies are burning the candle at both ends to gin up extremely modest positive results. They are literally eating their seed corn.
Needless to say, this does not support any kind of thesis for long term investment. All it does is move us from the bottom to the top of a six month range. I can?t imagine that you are going to see many aggressive buyers higher than here. Edge up from here, and you might witness the disgusting sight of traders throwing up on their shoes as they rush to cover premature shorts.
That is when you want to hold your nose and establish your shorts. Even the most bullish forecasts have the S&P 500 going up only 5% from here to 1,475, before it heads back down again.
This is not the first time that the market action has divorced itself from the fundamentals. I watched the Japanese stock market go from strength to strength for ten years before it knocked itself out crashing into the ceiling at ?39,000. Last night it closed at ?8,978, some 22 years later. Those analysts at Morgan Stanley obsessed with fundamentals only during the 1980?s saw their offices moved next to the elevator, then the men?s bathroom, the one with the big punching bag hanging from the ceiling, and finally, out of the building completely.
At this point you have to ask how much of QE3 is already priced into the market. If the Federal Reserve instituted this aggressive monetary expansion policy two months ago, they might have been able to engineer a 200 point move in the (SPX) or 2,000 points in the Dow. If they do it today, they might get only 50 (SPX) points, 500 Dow points, and perhaps none at all, followed by a sharp drop.
Lighten up your book, take short-term profits, sell short-dated-out-of- the-money calls, and meaningfully reduce your risk. Find something else to trade besides stocks. That is unless you have the luxury of staying out completely. The traders who don?t remember to sit down when the music stops playing will get burned badly.
Don?t Ask Me How I Got Here
https://madhedgefundtrader.com/wp-content/uploads/2019/05/cropped-mad-hedge-logo-transparent-192x192_f9578834168ba24df3eb53916a12c882.png00DougDhttps://madhedgefundtrader.com/wp-content/uploads/2019/05/cropped-mad-hedge-logo-transparent-192x192_f9578834168ba24df3eb53916a12c882.pngDougD2012-08-09 23:04:212012-08-09 23:04:21When Bad Becomes Good and Worse is Even Better
As I expected, the wildly optimistic expectations for further quantitative easing by the Federal Reserve at yesterday?s Open Market Committee meeting were not matched with substance. All we got was a continuation of existing modest programs and some minor tweaking of language.
Bernanke only managed to say that, ?further stimulus will be provided as needed.? The Fed left unchanged its statement that economic conditions would likely warrant holding the benchmark Fed funds rate near zero ?at least through late 2014.? It also said it would continue swapping $667 billion of short-term debt with longer-term securities to lengthen the average maturity of its holdings, an action intended to lower long-term interest rates known as Operation Twist.
Apparently, the slowdown in GDP growth from 2% in Q1 to 1.5% in Q2 was not enough to spur the Fed to action. Nor was a slowdown in jobs growth from an average 226,000 jobs per month to 75,000. The earliest the Fed can now take further accommodative action is at their next meeting on September 12-13, just seven weeks before the presidential election.
The dollar rose smartly against the yen and the Euro. Equities closed at their lows for the day. They could have fallen dramatically further. But I think that traders are holding fire until their learn the results of the ECB meeting on Thursday. If we get more rhetoric instead of action, and the Friday nonfarm payroll continues weak, then we will have a hat trick of disappointments that could trigger a more gut wrench plunge in the indexes going into next week.
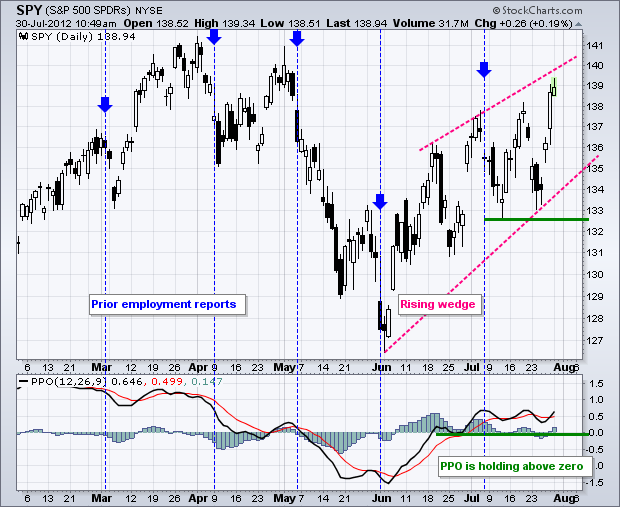
At the very least, we should challenge the bottom the of recent upward channel, taking us down 50 points from here. That should double the value of my existing position in the (SPY) puts.
Ben, Where Were You?
https://madhedgefundtrader.com/wp-content/uploads/2019/05/cropped-mad-hedge-logo-transparent-192x192_f9578834168ba24df3eb53916a12c882.png00DougDhttps://madhedgefundtrader.com/wp-content/uploads/2019/05/cropped-mad-hedge-logo-transparent-192x192_f9578834168ba24df3eb53916a12c882.pngDougD2012-08-02 13:15:502012-08-02 13:15:50The Fed Says No QE3
A couple of alleged Tweets, a few rumored phone calls, and what have we got? $2 trillion in new global stock market capitalization in hours. That was the bottom line after the purported communication between the staffs of Germany?s Angela Merkel, France?s Jean Francois Hollande, and ECB president Mario Draghi. But is the creation of this immense new wealth, which would alone rank as 10th in terms of GDP after France, justified?
If the intention was to punish hedge funds, the goal was certainly accomplished. The plaintive bleatings in email and text messages I received from hedge fund friends back home has been overwhelming. It was clear from the price action, straight line moves with no pullbacks, that the pain trade was definitely on. Pre-Thursday, the consensus wisdom was that market would crash into the August doldrums in the face of global economic data that was deteriorating by the day. Such is the price of betting against central banks that I highlighted in my recent trope ?Why Ben Bernanke Hates Me? (click here at http://madhedgefundradio.com).
Leading research houses seemed to be in an arms race with government institutions to see who could cut growth forecasts the fastest. They were all egged on by US Q2 corporate earnings reports, that were highly fudged and indifferent at best, with the most honest wisdom provided by the shocker from Apple (AAPL).
However, in the financial markets that are more often driven by emotion than information, politics trump fundamentals every day. With the street heavily positioned on the short side, the conditions for a snap back rally were ripe. This is why I had no positions at all for 10 days, and no equity holdings for over a month. Rather than chase the market on the downside, I waited for it to come to me, which is usually the best thing to do.
I have always believed that Europe has the ability and the resources to solve its problems at any time. To read my advice to the German government in detail, please refer to my report from Frankfurt, which I will write in the next couple of days, when I get some time.
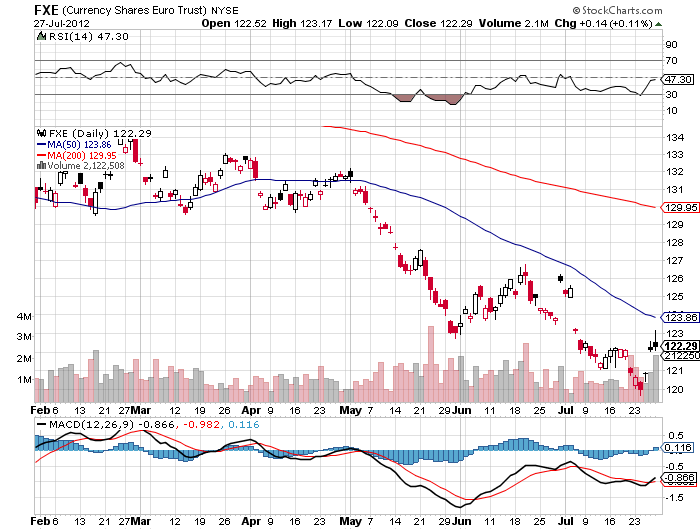
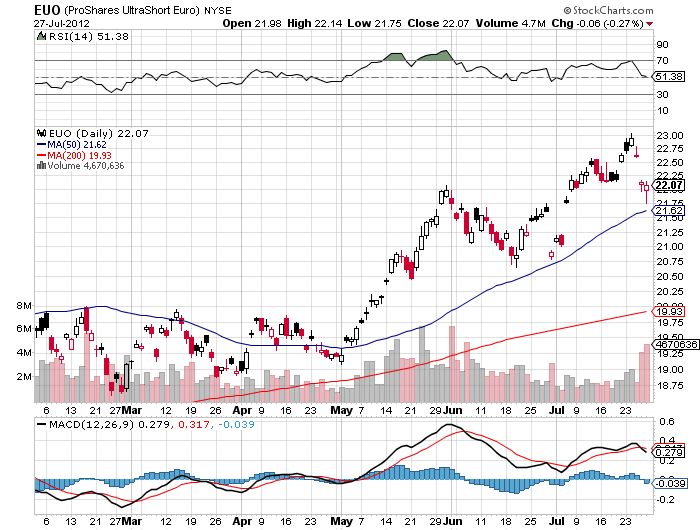
All that is required is for Europe to make some unpleasant admissions of truths, and adopt some policies and institutions that have already been proven to work in the US. These are hard things to do politically, but that can be done. Make the politicians earn their pay for a change, I say. This is what makes the short game in Europe so risky, and why I have recently been so wimpy on my short Euro (FXE), (EUO) recommendations (in the reports, but without trade alerts).
Words are cheap, and their true value will become apparent when it comes time for Mario Draghi to deliver. If he does so quickly, we could see a ?RISK ON?, rally that could last until the end of the year and possibly take the S&P 500 up to 1,500. If he doesn?t, the August crash scenario down to 1,200 is back on the table, but no more. That table loses another leg if Ben Bernanke fails to deliver QE3 on Wednesday.
If all of this leaves you confused and befuddled, then welcome to the club. There are times when markets are just not forecastable, when the number of large variables and unknowns are too great to even make an intelligent guess at outcomes, and this is one of them. That?s why I am still 70% in cash, limiting my ?RISK ON? exposure to small, profitable positions in short Treasury and short yen call spreads. That?s down from 100% I had just last Wednesday.
I think I?ll go climb that Alp over there.
The Pain Trade is on for Hedge Funds
https://madhedgefundtrader.com/wp-content/uploads/2019/05/cropped-mad-hedge-logo-transparent-192x192_f9578834168ba24df3eb53916a12c882.png00DougDhttps://madhedgefundtrader.com/wp-content/uploads/2019/05/cropped-mad-hedge-logo-transparent-192x192_f9578834168ba24df3eb53916a12c882.pngDougD2012-07-30 22:46:492012-07-30 22:46:49Mr. Mario?s Big Bluff
I don?t just think he hates me. He truly despises me. In fact, he does everything he can to put me out of business.
Take next week, for example, when the Federal Reserve Open Market Committee meets, and he will attempt to give my views and me a complete thrashing. I doubt he?ll launch a QE3 because he needs to keep some dry powder as a last resort. But he probably will announce some minor back door easings, like expanding his ?operation twist? to include mortgage backed securities for the first time, or ceasing interest rate payments on deposits from private banks. Just the mere prospect of this is forcing me to stay entirely in cash, preventing me from making more money than I already am.
It?s not that I am not an all right guy. I am kind to children and small animals. I donate generously to many charities. I send my mother cards on her birthday (happy birthday mom!), even though she is 84 and not expected to last much longer. I even occasionally escort little old ladies across the street, although this is a holdover from my days as an Eagle Scout.
It?s just that Ben Bernanke and I don?t see eye-to-eye on a lot of important issues. He wants stocks to go up. As a hedge fund manager who plays from the short side more often than not when the economy is growing at a paltry 1.5% rate, I want them to go down. He wants bonds to go up too, as he clearly elicited with his ?twist policy? last year when he bought long term Treasury bonds and shorted overnight paper against it. I, on the other hand, want bonds to sell off because I know that when the bill comes due for all of this monetary easing, the crash will be momentous.
These are not the only matters we differ on. He wants to create jobs. He can wish this until the cows come home but he?s not going to get them because of the gale force demographic headwinds the country is now facing and the massive deleveraging by the public and private sector. The 25 million jobs we exported to China are never coming back.
However, all he has to do is make a mere mention of his desires, or even just mention the letter ?Q?, and asset prices go through the roof, forcing me to stop out of my shorts at losses. This is why I was in such a foul, acrimonious, and detestable mood during the first quarter, when stocks went up almost every day.
My problem is that Ben Bernanke isn?t the only person who dislikes me. President Obama doesn?t think much of me either. He talks about jobs too. He frequently speaks about the need to improve our education system, even though I know he is poised to slash the budget for the Department of Education as part of some deal with the Republicans. Ditto for Social Security.
Fortunately for me, I wrote off any prospect of getting a retirement check a long time ago and have made other arrangements, like becoming a hedge fund manager. Either the payments will be too small to live on, or they will be made in Zimbabwean dollars and will be effectively worthless.
I get along with Treasury Secretary, Timothy Geithner, OK, which keeps me on his ?must see? list whenever he stops in San Francisco on his way to Beijing to ask to borrow more money. But we go way back. There are only four people in US history who can discuss Japanese monetary policy of the 1920?s in depth, and do it in Japanese just for laughs (it was clearly too easy). Two of them, Senator Mike Mansfield of Montana and Harvard professor, John K. Fairbank, died ages ago. So he is kind of limited on choices. Besides, there are not a lot of people out there who can give him a 40 year view on the global economy, and I am one of them.
There are plenty of others who don?t think I am so hot, too. Try making a fortune in a market crash when everyone else is losing their shirt. While others in the locker room at my country club are slamming doors, tearing their hair out, and breaking golf clubs in half when they see the price feed on CNBC, I am chirping happily away about selling short at the top. I might as well be letting out a loud fart in Sunday church service. This explains why I stopped getting invitations to dinners ages ago.
It?s not that my relationship with Ben Bernanke is totally hopeless. When the demographic picture turns from a headwind to a tailwind and individuals and corporations cease deleveraging and return to releveraging, we?ll probably be reading from the same page of music. But according to the US Census Bureau, the earliest this can happen is 2022. By then, he probably won?t be the Fed governor anymore and I won?t care if he likes me or not.
Besides, I may be able to make a new friend or two in the meantime. If Mitt Romney wins the presidential election he says he?ll fire Ben Bernanke on his first day in office. He can?t really do that, but Ben?s term does expire a year later. His two most widely rumored picks to fill the post are president of the Federal Reserve Bank of Dallas, Richard Fisher, and Stanford University professor, John Taylor.
These two are not in the least bit interested in all this quantitative easing malarkey. They are much more similar in philosophy to Herbert Hoover?s Treasury Secretary, Andrew Mellon, who popularized the ?let the chips fall where they may? approach to economic policy. Kick the props out from under this market and all of a sudden Dow 3,000 is on the table, as argued by Global strategist and demographics maven, Harry Dent.
They might even go as far as unwinding the Fed?s hefty $2.7 trillion balance sheet. That would give the Chinese, who hold $1 trillion of these bonds, a heart attack. But who cares? It would create the mother of all trading windfalls for me. Hell, they might not even care if I torture small animals, beat children with a switch, and leave little old ladies in the middle of onrushing traffic. I think we would get along just great.
Screw Social Security, and Ben Bernanke too.
https://madhedgefundtrader.com/wp-content/uploads/2019/05/cropped-mad-hedge-logo-transparent-192x192_f9578834168ba24df3eb53916a12c882.png00DougDhttps://madhedgefundtrader.com/wp-content/uploads/2019/05/cropped-mad-hedge-logo-transparent-192x192_f9578834168ba24df3eb53916a12c882.pngDougD2012-07-26 23:03:382012-07-26 23:03:38Why Ben Bernanke Hates Me
Legal Disclaimer
There is a very high degree of risk involved in trading. Past results are not indicative of future returns. MadHedgeFundTrader.com and all individuals affiliated with this site assume no responsibilities for your trading and investment results. The indicators, strategies, columns, articles and all other features are for educational purposes only and should not be construed as investment advice. Information for futures trading observations are obtained from sources believed to be reliable, but we do not warrant its completeness or accuracy, or warrant any results from the use of the information. Your use of the trading observations is entirely at your own risk and it is your sole responsibility to evaluate the accuracy, completeness and usefulness of the information. You must assess the risk of any trade with your broker and make your own independent decisions regarding any securities mentioned herein. Affiliates of MadHedgeFundTrader.com may have a position or effect transactions in the securities described herein (or options thereon) and/or otherwise employ trading strategies that may be consistent or inconsistent with the provided strategies.