The global bond markets have been screaming an ugly message at us loud and clear, and I’m afraid that it’s not a positive one.
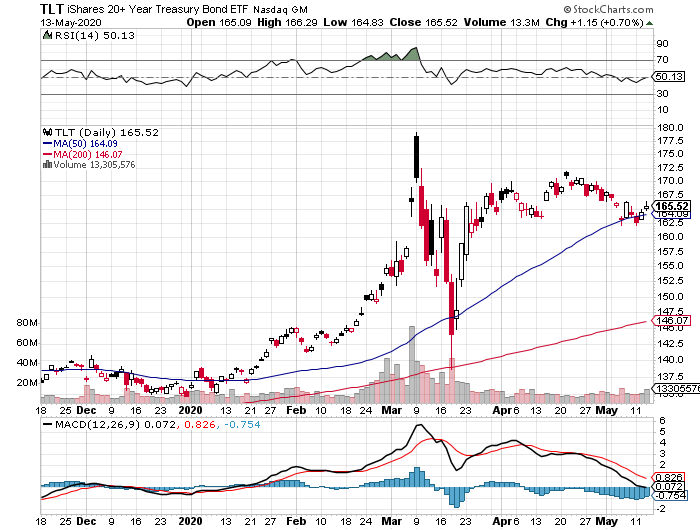
Amazingly, US Treasury bonds have soared early this year, taking the (TLT) up a stunning 40 points.
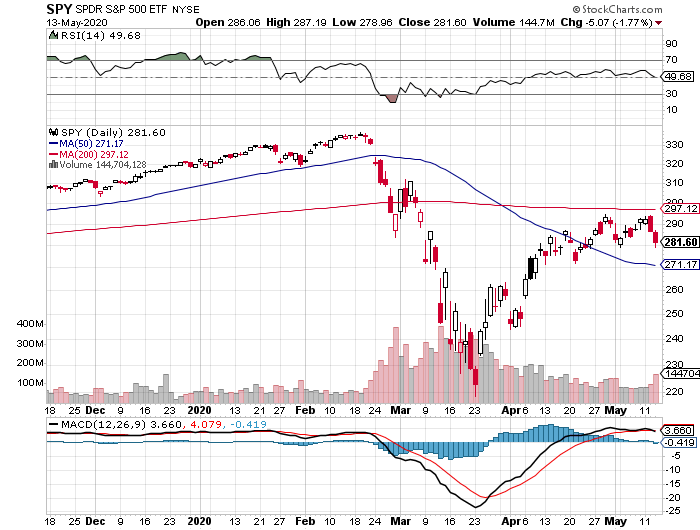
In the meantime, stocks have suffered the sharpest crash in history, plunging ten times faster than the worst days of the 1929 crash, down 37%.
The implications for your investment portfolio are so momentous and far-reaching that I am going to have to list them one by one.
Read them and weep:
1) The US is in a severe depression.
2) The pandemic is not even close to ending. US deaths topped 85,000 yesterday and may triple from here.
3) The presidential election has become a major source of instability, and no one has any idea of how this will all end. Trump is currently trying to bankrupt the US Post Office to frustrate mail-in voting.
4) The immigration crisis is reaching a humanitarian crisis of epic proportions. It has become our Syria, which landed four million immigrants in Europe.
5) The stock market is in the process of crashing…. Again, failing dramatically at the 200-day moving average. That “Sell in May” thing may work big time this year.
6) The Trump trade is toast. Financials, commodity, energy, coal, and industrial stocks are leading the charge to the downside.
7) Oil (USO) is in free fall and may go negative again, another classic recession predictor. For the first time in history. Most small and medium-sized energy companies will go under. Coal has dropped to a historic low of 19% of US electricity production, less than total alternative sources, and is never coming back.
8) Bitcoin is rocketing, up an eye-popping 100% since the crash began. This has become the big hot money trade of 2020 in addition to that other great flight to safety trade, gold (GLD).
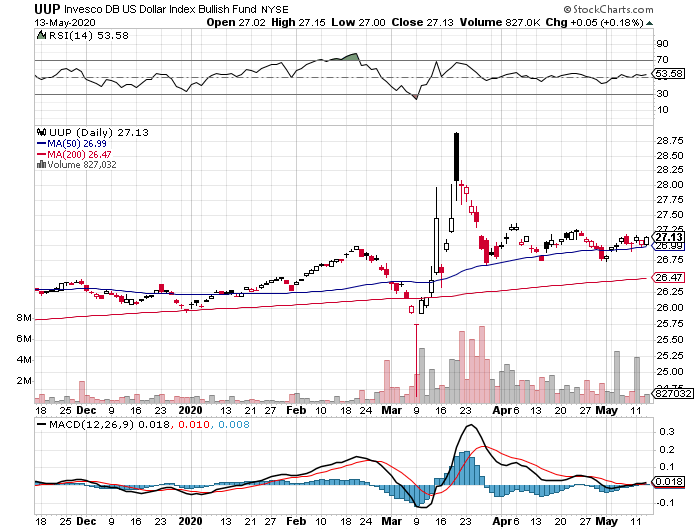
9) The US dollar (UUP) is flatlining, wiping out the growth of the foreign earnings of US multinationals. Foreign economies are collapsing even faster than ours, taking their interest rates and currencies lower at warp speed.
10) The unemployment rate, now at all-time lows, not bottom out for months. The great irony here is that while the president vociferously campaigned on an aggressive jobs program, he may well preside over the biggest job losses in history. The Fed is targeting total unemployment of 52 million, worst than the Great Depression.
For more on this, please read my recent piece, “Why You Will Lose Your Job in the Next Five Years and What to Do About It” by clicking here.
There is another alternative explanation to all of this.
A certain Monty Python sketch about a parrot comes to mind.
That all we saw a giant short squeeze in the hedge funds’ core short position in bonds for the umpteenth time, and that we are almost done.
Hedge funds have grown in size to where they are now the perfect contrary market indicator. It is the classic “Too many people in one side of the canoe” trade. A Yogi Berra quote comes to mind; “Nobody goes there anymore because it is too crowded.”
There are other structural factors at play here which are hard to beat. For more on this, please read my opus on “Why Are Bond Yields So Low” by clicking here.
Long Bonds are About to Take a Chainsaw to Your Portfolio
https://www.madhedgefundtrader.com/wp-content/uploads/2019/06/john-chain-saw.png399261MHFTRhttps://madhedgefundtrader.com/wp-content/uploads/2019/05/cropped-mad-hedge-logo-transparent-192x192_f9578834168ba24df3eb53916a12c882.pngMHFTR2020-05-14 08:02:402020-06-15 12:09:57Ten More Ugly Messages from the Bond Market
Upon analyzing my performance data for the past year, it couldn’t be clearer.
After three years of battle testing, the algorithm has earned its stripes. I started posting it at the top of every newsletter and Trade Alert last year and will continue to do so in the future.
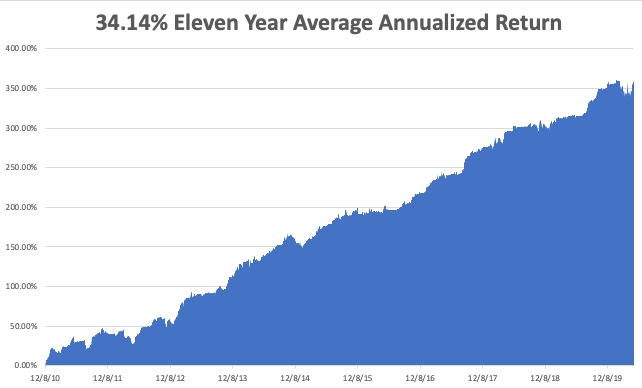
Once I implemented my proprietary Mad Hedge Market Timing Index in October 2016, the average annualized performance of my Trade Alert service has soared to an eye-popping 34.14%.
As a result, new subscribers have been beating down the doors trying to get in.
Let me list the highpoints of having a friendly algorithm looking over your shoulder on every trade.
*Algorithms have become so dominant in the market, accounting for up to 80% of total trading volume, that you should never trade without one
*It does the work of a seasoned 100-man research department in seconds
*It runs real-time and optimizes returns with the addition of every new data point far faster than any human can. Imagine a trading strategy that updates itself 30 times a day!
*It is artificial intelligence-driven and self-learning.
*Don’t go to a gunfight with a knife. If you are trading against algos alone,
you WILL lose!
*Algorithms provide you with a defined systematic trading discipline that will enhance your profits.
And here’s the amazing thing. My Mad Hedge Market Timing Index correctly predicted the outcome of the presidential election, while I got it dead wrong.
You saw this in stocks like US Steel, which took off like a scalded chimp the week before the election.
When my and the Market Timing Index’s views sharply diverge, I go into cash rather than bet against it.
Since then, my Trade Alert performance has been on an absolute tear. In 2017, we earned an eye-popping 57.39%. In 2018, I clocked 23.67% while the Dow Average was down 8%, a beat of 31%. In 2019, I clocked a blockbuster 56%
Here are just a handful of some of the elements which the Mad Hedge Market Timing Index analysis in real-time, 24/7.
50 and 200-day moving averages across all markets and industries
The Volatility Index (VIX)
The junk bond (JNK)/US Treasury bond spread (TLT)
Stocks hitting 52-day highs versus 52-day lows
McClellan Volume Summation Index
20-day stock bond performance spread
5-day put/call ratio
Stocks with rising versus falling volume
Relative Strength Indicator
12-month US GDP Trend
Case Shiller S&P 500 National Home Price Index
Of course, the Trade Alert service is not entirely algorithm-driven. It is just one tool to use among many others.
Yes, 50 years of experience trading the markets is still worth quite a lot.
I plan to constantly revise and upgrade the algorithm that drives the Mad Hedge Market Timing Index continuously, as new data sets become available.
Obviously, in light of the recent stock market crash, a ton of new valuable data is available for which my algo can mine.
It’s All About the Inputs
https://madhedgefundtrader.com/wp-content/uploads/2019/05/cropped-mad-hedge-logo-transparent-192x192_f9578834168ba24df3eb53916a12c882.png00Mad Hedge Fund Traderhttps://madhedgefundtrader.com/wp-content/uploads/2019/05/cropped-mad-hedge-logo-transparent-192x192_f9578834168ba24df3eb53916a12c882.pngMad Hedge Fund Trader2020-05-12 09:02:472020-06-15 12:09:39How the Mad Hedge Market Timing Algorithm Tripled My Performance
The most significant market development so far in 2020 has not been the epic stock market crash and rebound, the nonstop rally in tech stocks (NASDQ), the rebound of gold (GLD), or negative oil prices, although that is quite a list.
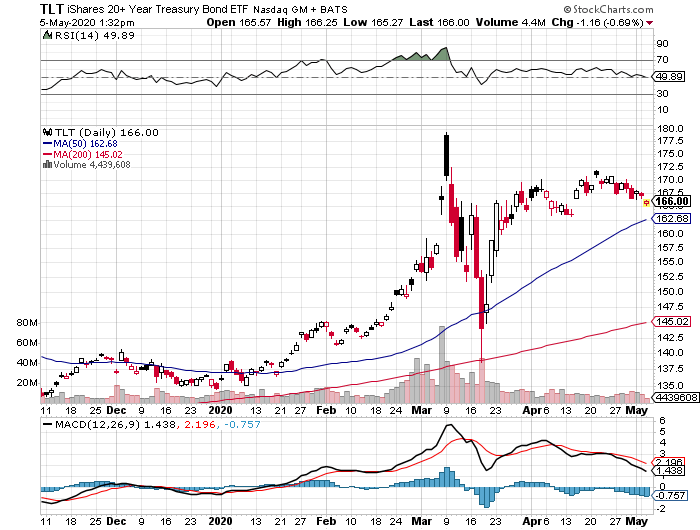
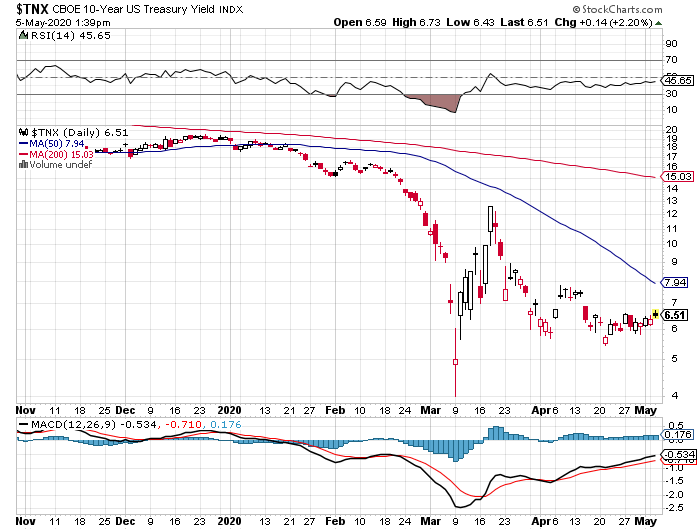
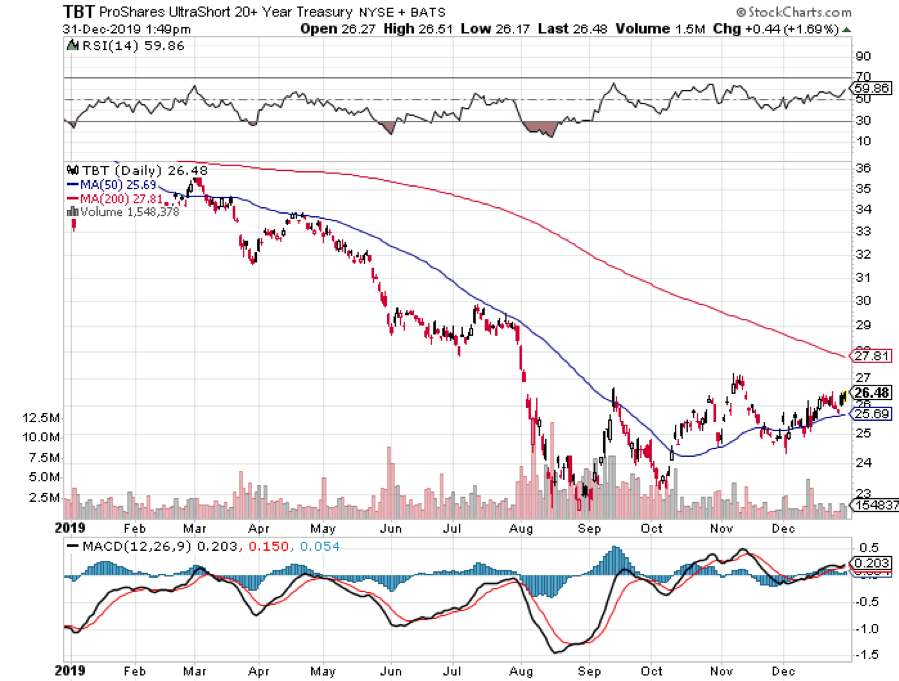
It has been the recent peaking of the bond market (TLT), which a few weeks ago was probing all-time highs.
I love it when my short, medium, and long-term calls play out according to script. I absolutely hate it when they happen so fast that I and my readers are unable to get in at decent prices.
That is what has happened with my short call for the (TLT), which has been performing a near-perfect swan dive since April. The move has been enough to boost me back into positive numbers for 2020.
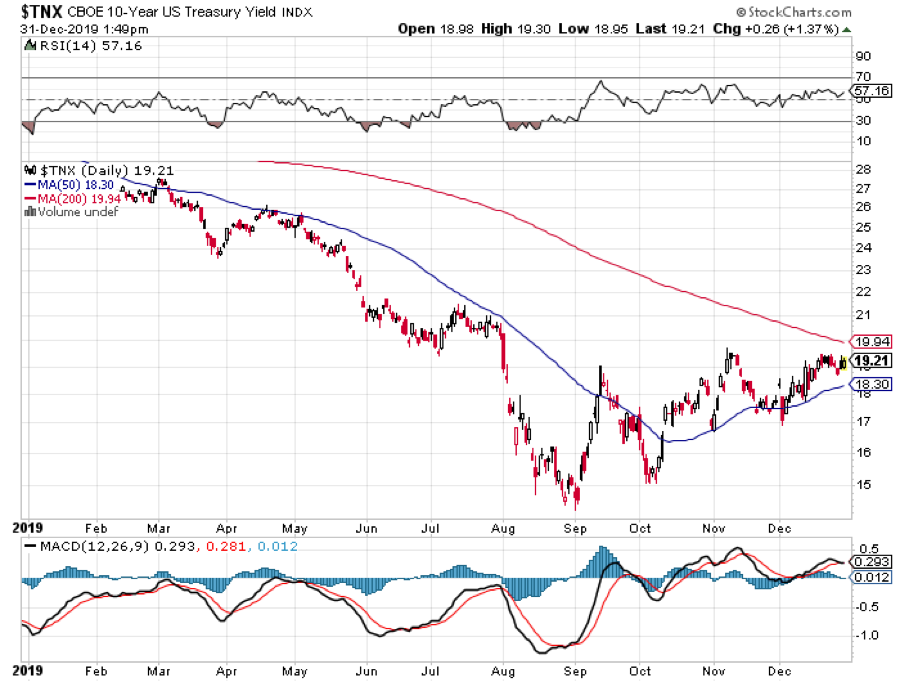
The yield on the ten-year Treasury bond has soared from 3.25% in 2018 to an intraday low of 0.31% in March.
Lucky borrowers who demanded rate locks in real estate financings at the end of January are now thanking their lucky stars. We may be saying goodbye to the 3% handle on 5/1 ARMS for the rest of our lives.
The technical damage has been near-fatal. The writing is on the wall. A 1.00% yield for the ten-year is now easily on the menu for 2020, if not 2.00% or 3.0%.
This is crucially important for financial markets, as interest rates are the well spring from which all other market trends arise.
Wiser thinkers are peeved that the promised bleeding of federal tax revenues is causing the annual budget deficit to balloon from a low of a $450 billion annual rate in 2016 to $1.2 trillion last year and over $5 trillion in 2020.
Add in the bond purchases from the Fed’s new promise of $8 trillion in quantitative easing and you get true government borrowing of $13 trillion for 2020. It will all end in tears for bond and US dollar holders.
And don’t forget the president, who recently threatened to default on US Treasury bonds, just as the Treasury was trying to float $3 trillion in new issues. It is a short seller’s dream come true.
As rates rise, so does the debt service costs of the world’s largest borrower, the US government. The burden will soar in a hockey stick-like manner, currently at 4% of the total budget.
What is of far greater concern is what the tax bill does to the National Debt, taking it from $24 trillion to $32 trillion over the next year, a staggering rise of 50%. Even Tojo and Hitler couldn’t get the US to buy that much. If we get the higher figure, then we are looking not at another recession, but at yet another 1930-style depression.
Better teach your kids to drive for UBER early, as they are the ones who are going to have to pay off this gargantuan debt. That is if (UBER) is still around.
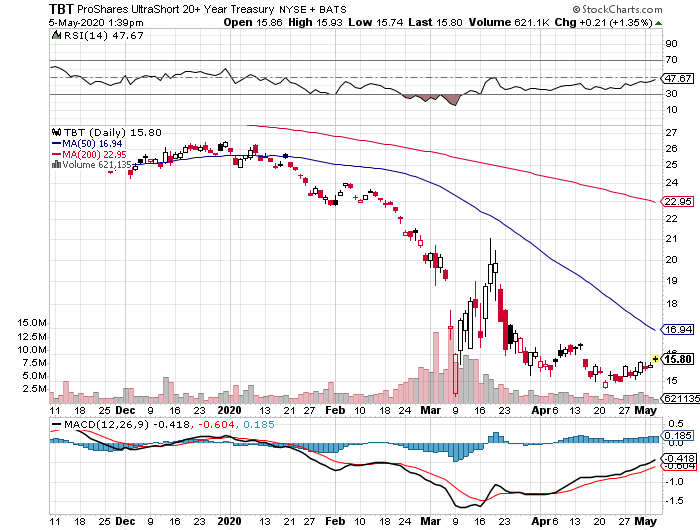
So what the heck are you supposed to do now? Keep selling those bond rallies, even the little ones. It will be the closest thing to a rich uncle you will ever have, if you don’t already have one.
Make your year now because the longer you put it off, the harder it will be to get.
https://www.madhedgefundtrader.com/wp-content/uploads/2011/12/FatLady2-2.jpg248400Mad Hedge Fund Traderhttps://madhedgefundtrader.com/wp-content/uploads/2019/05/cropped-mad-hedge-logo-transparent-192x192_f9578834168ba24df3eb53916a12c882.pngMad Hedge Fund Trader2020-05-06 08:02:402020-05-06 08:39:55Now the Fat Lady is REALLY Singing for the Bond Market
Followers of the Global Trading Dispatch have the good fortune to own a deep in-the-money options position that expires on Friday, and I just want to explain to the newbies how to best maximize their profits on that March 20 expiration.
This involves the:
Apple (AAPL) March 2020 $220-$230 in-the-money vertical BULL CALL spread
Microsoft (MSFT) March 2020 $120-$125 in-the-money vertical BULL CALL spread
Amazon (AMZN) March 2020 $1,350-$1,400 in-the-money vertical BULL CALL spread
Provided that we don’t have another 3,000 point move down in the market this week, these positions should expire at their maximum profit points. So far, so good.
I’ll do the math for you on the Apple (AAPL) position. Your profit can be calculated as follows:
Profit: $10.00 - $8.80 = $1.20
(11 contracts X 100 contracts per option X $1.20 profit per options)
= $1,320 or 13.63% in 7 trading days.
Many of you have already emailed me asking what to do with these winning positions.
The answer is very simple. You take your left hand, grab your right wrist, pull it behind your neck, and pat yourself on the back for a job well done.
You don’t have to do anything.
Your broker (are they still called that?) will automatically use your long position to cover your short position, canceling out the total holdings.
The entire profit will be credited to your account on Monday morning March 23 and the margin freed up.
Some firms charge you a modest $10 or $15 fee for performing this service.
If you don’t see the cash show up in your account on Monday, get on the blower immediately and find it.
Although the expiration process is now supposed to be fully automated, occasionally mistakes do occur. Better to sort out any confusion before losses ensue.
If you want to wimp out and close the options position before the March 20 expiration, it may be expensive to do so. You can probably unload them pennies below their maximum expiration value.
Keep in mind that the liquidity in the options market disappears and the spreads substantially widen when a security has only hours, or minutes until expiration on Friday. So, if you plan to exit, do so well before the final expiration at the Friday market close.
This is known in the trade as the “expiration risk.”
One way or the other, I’m sure you’ll do OK, as long as I am looking over your shoulder, as I will be, always. Think of me as your trading guardian angel.
I am going to hang back and wait for good entry points before jumping back in. It’s all about keeping that “Buy low, sell high” thing going.
I’m looking to cherry-pick my new positions going into the next quarter end.
Take your winnings and go out and buy yourself a well-earned dinner. Or use it to put a down payment on a long cruise.
Well done and on to the next trade.
This Market Can Be Very Tricky
https://www.madhedgefundtrader.com/wp-content/uploads/2019/08/john-snake.png433391Mad Hedge Fund Traderhttps://madhedgefundtrader.com/wp-content/uploads/2019/05/cropped-mad-hedge-logo-transparent-192x192_f9578834168ba24df3eb53916a12c882.pngMad Hedge Fund Trader2020-03-17 08:02:522020-05-11 14:45:54How to Handle the Friday March 20 Options Expiration
I am constantly bombarded with requests for high-yield, low-risk investments in this ultra-low interest rates world.
While high-yield energy Master Limited Partnerships LIKE (AMLP) can offer double-digit returns, they carry immense risks. After all, if the prices of oil drop to $5-$10 a barrel, replaced by alternatives as I eventually expect, all of these instruments will get wiped out.
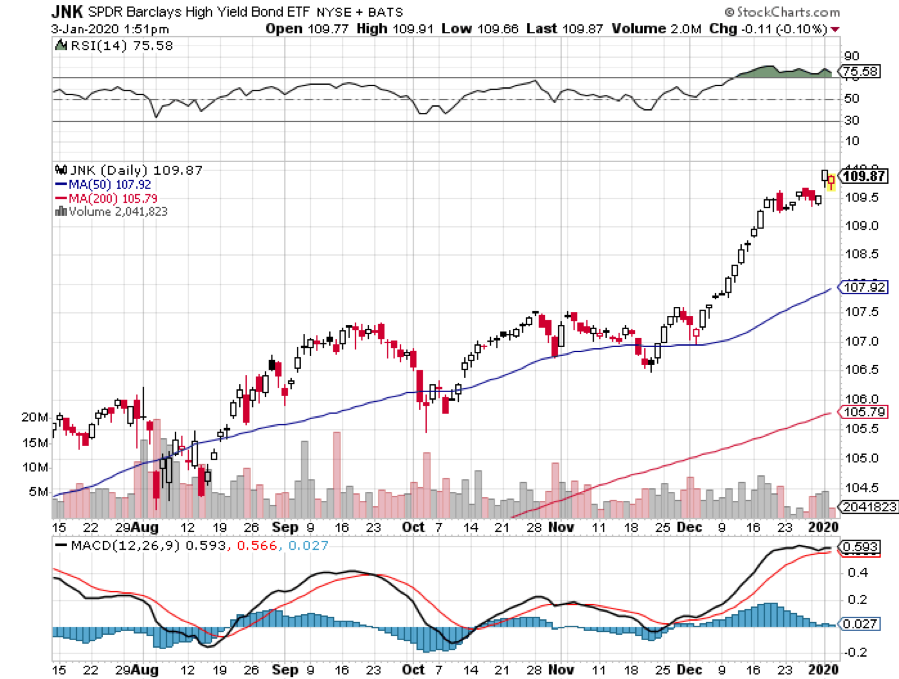
You can earn 5%-8% from equity-linked junk bonds. However, their fates are tied to the future of the stock market at a 20-year valuation high against flat earnings.
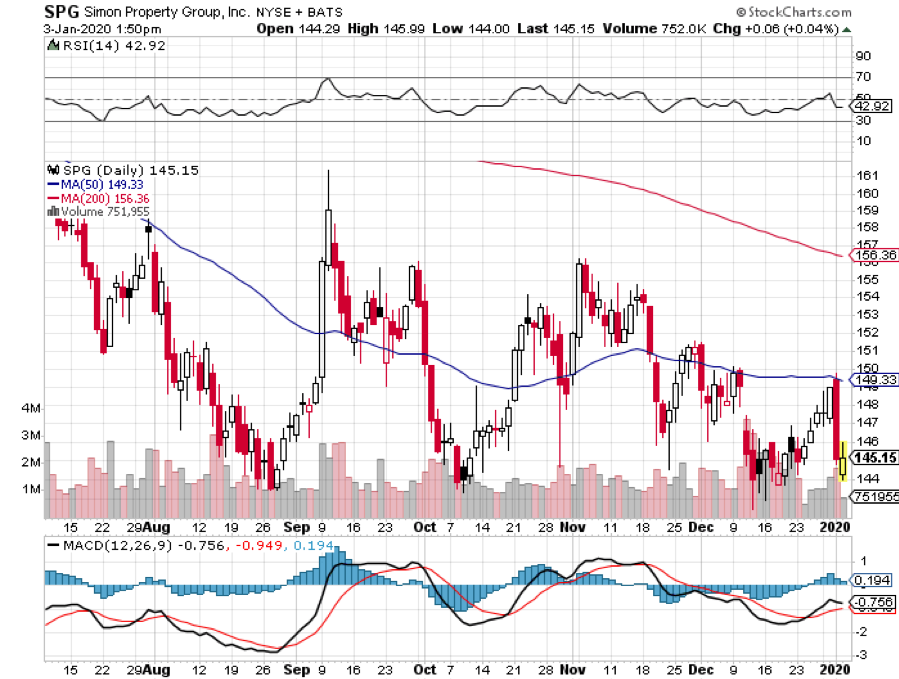
You might then migrate to Real Estate Investment Trusts (REITs) like Simon Property Group (SPG), which acts as a pass-through vehicle for investments in a variety of property investments. However, many of these are tied to shopping malls and the retail industry, the black hole of investment today.
So where is the yield-hungry investor to go?
You may have heard about something called 5G. This refers to the rollout of fifth-generation wireless technology that will increase smartphone capabilities tenfold. Whole new technologies, like autonomous driving and artificial intelligence, will get a huge boost from the advent of 5G. Apple (AAPL) will launch its own 5G phone in September.
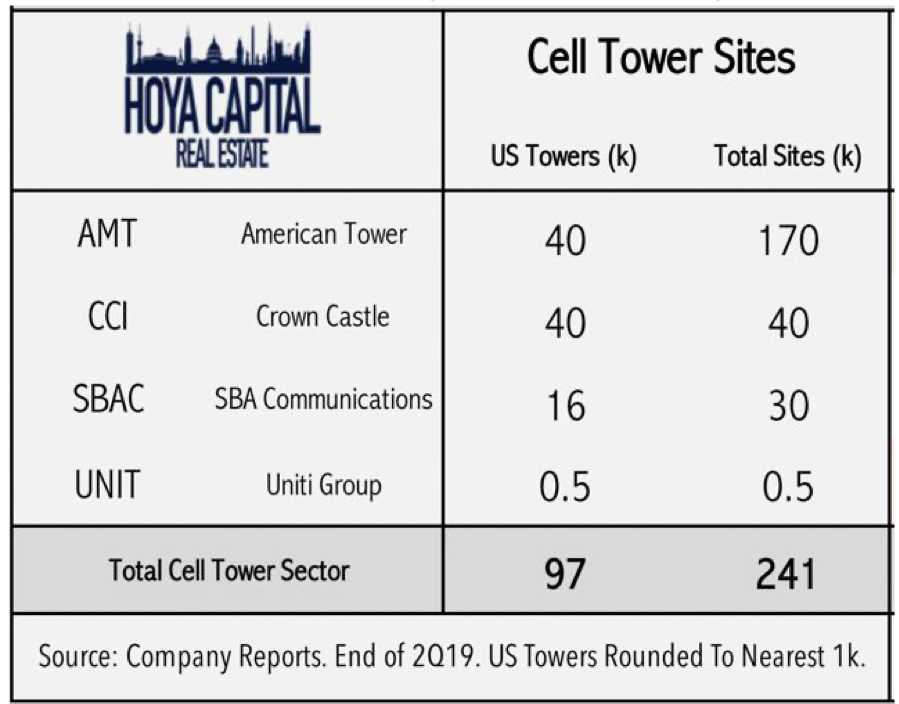
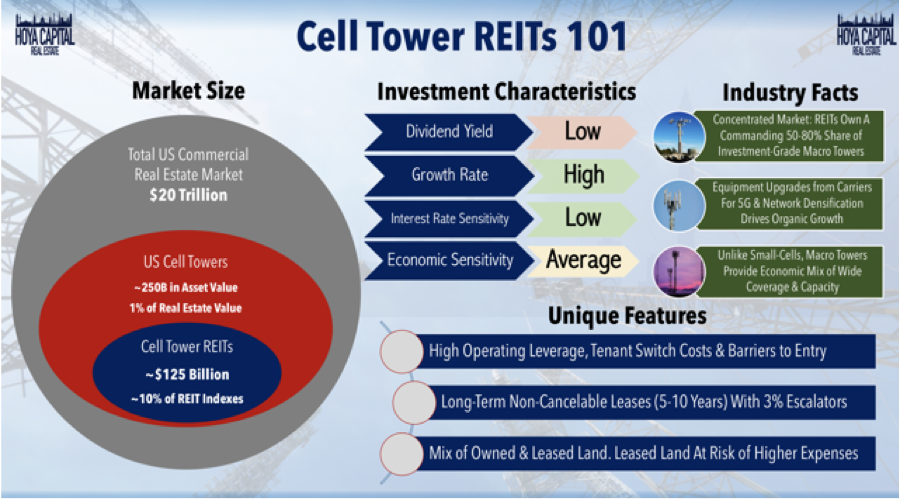
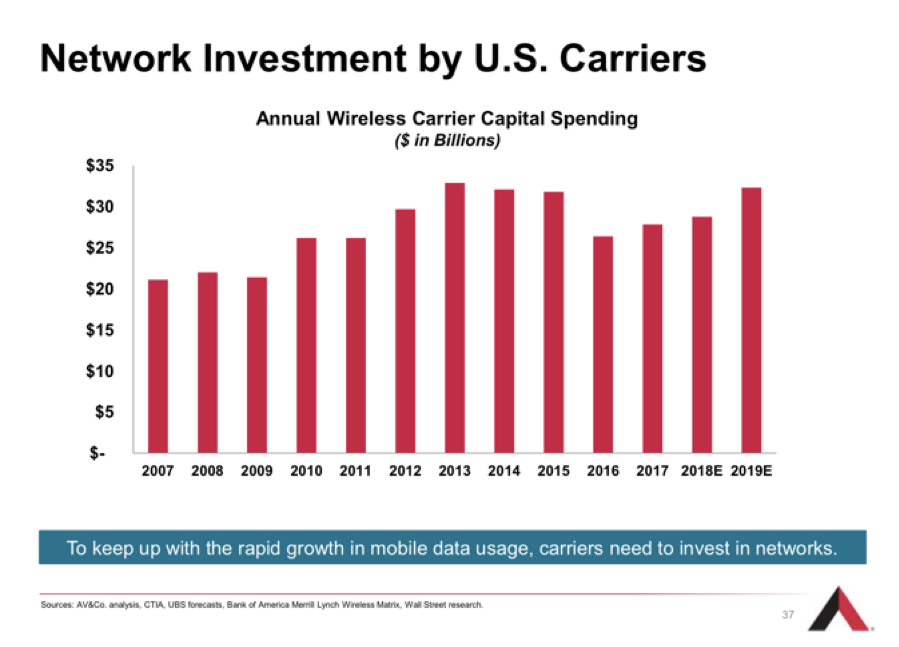
5G, like all cell phone transmissions, rely on 50-200-foot steel towers strategically placed throughout the country, frequently on mountain peaks or the tops of buildings. With demand from the big phone carriers soaring, there is a construction boom underway in cell phone towers. There just so happens to be a class of REITs that specializes in investment in this sector.
Cells Phone REITs constitute a $125 billion market and make up 10% of the REIT indexes. They own 50%-80% of all investment-grade towers. They are all benefiting from a massive upgrade cycle to accommodate the 5G rollout. These REITs own or lease the land under the cell towers and then lease them to the phone companies, like Verizon (VZ), AT&T (T), T-Mobile (TMUS), and Sprint (S) for ten years with 3% annual escalation contracts.
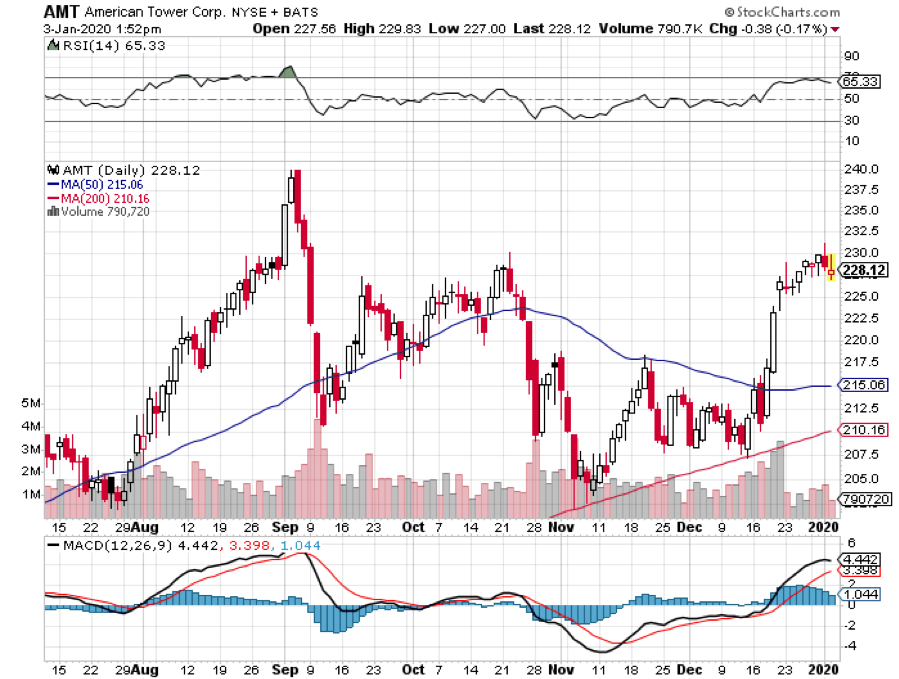
American Tower (AMT) is far and away the largest such REIT, with 170,000 towers, has provided an average annual return over the past ten years, and offers a fairly safe 1.65% yield. They are currently expanding in Africa. Even during the 2008 crash, (AMT) still delivered an 8% earnings growth.
SBA Communications (SBAC) is the runt of the sector with only 30,000 towers. However, it has a big presence in Central and South America and is seeing earnings grow at a prolific 80% annual rate. (SBAC) is offering a 1.48% yield at today’s prices.
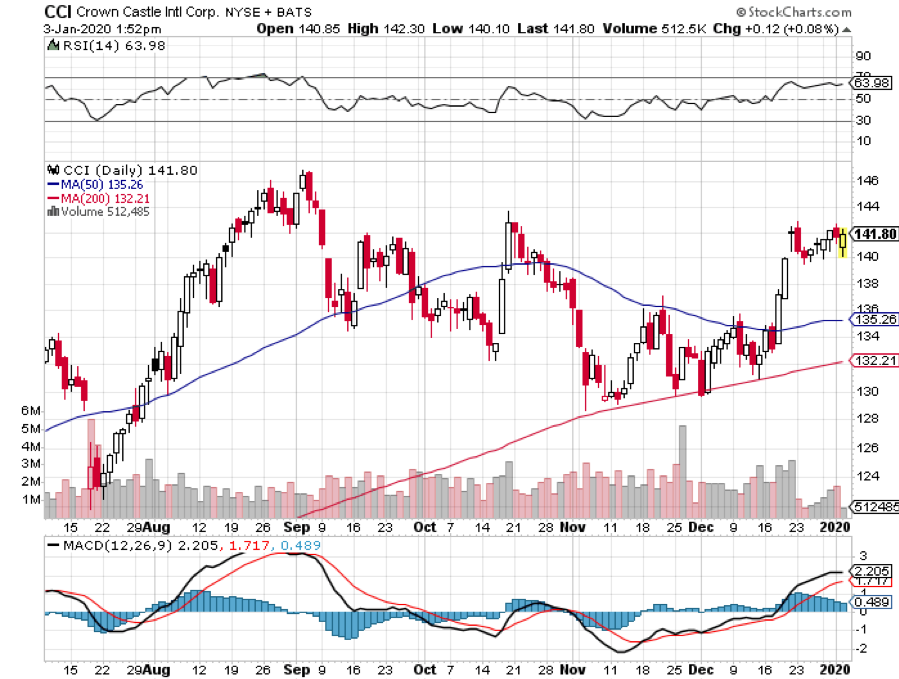
Crown Castle International (CCI) is in the middle with 40,000 large towers and 65,000 small ones. 5G signals travel only a 1,000 meters, compared to several miles for 4G, requiring the construction of tens of thousands of small towers where (CCI) is best positioned. (CCI) offers a hefty 3.39% yield.
Small cell towers are roughly the size of an extra-large pizza box and will soon be found on every urban street corner in the US. AT&T (T) has estimated that there is a need for over 300,000 small cell phone towers in the US alone.
So, if you’re looking for a sea anchor for your portfolio, a low-risk, high-return investment that won’t see a lot of volatility, Cell phone REITs may be your thing. Buy (CCI) on dips.
Can you hear me now?
https://madhedgefundtrader.com/wp-content/uploads/2019/05/cropped-mad-hedge-logo-transparent-192x192_f9578834168ba24df3eb53916a12c882.png00Mad Hedge Fund Traderhttps://madhedgefundtrader.com/wp-content/uploads/2019/05/cropped-mad-hedge-logo-transparent-192x192_f9578834168ba24df3eb53916a12c882.pngMad Hedge Fund Trader2020-01-09 07:02:492020-01-09 06:52:59Capturing Some Yield with Cell Phone REITs
As of January 1, 2020, it is illegal to build a home in California without solar panels.
Furthermore, dozens of cities have gone as far as banning natural gas appliances like ovens, heaters, and burners.
It is the most ambitious solar initiative anywhere in the world today. Those who invest in backup storage batteries like the Tesla Powerwall, will receive additional cash incentives.
It’s not like solar is new in the Golden State. It boasts over one million homes with installed panels out of a total housing stock of 16 million. It is all part of a grand plan for the state to obtain 100% of its electric power from alternative sources by 2030.
The new measures are expected to add $9,500 to the cost of new home construction. Builders are expected to eat most of it.
However, it will cut utility bills by $19,000 over the 30-year life of a solar system. And that is at today’s prices. California homeowners have already suffered two back-to-back 15% price increases over the past two years. With northern California’s utility PG&E (PGE) in bankruptcy, more stiff price hikes are expected.
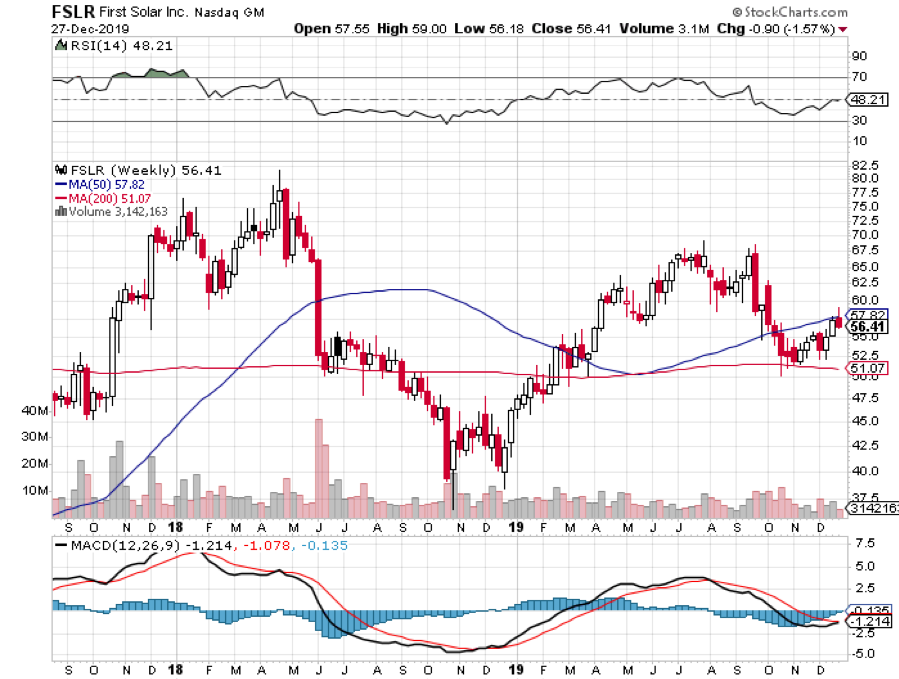
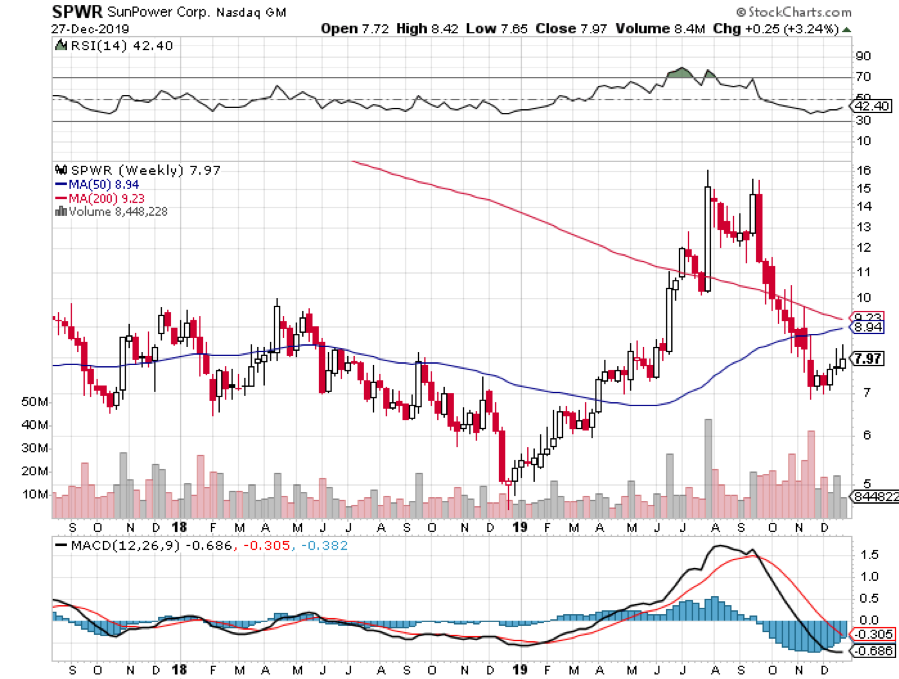
You would think that the news would set the share prices of American solar companies, like First Solar (FSLR) and SunPower (SPWR), on fire.
They haven’t.
That's because solar prices are joined at the hip with conventional energy sources.
When oil is cheap, solar share prices die a horrible death. When oil is dear, everybody and his brother wants to pile into everything alternative, be it solar panels, storage batteries, windmills, electric cars, and high mileage hybrid cars like the Prius.
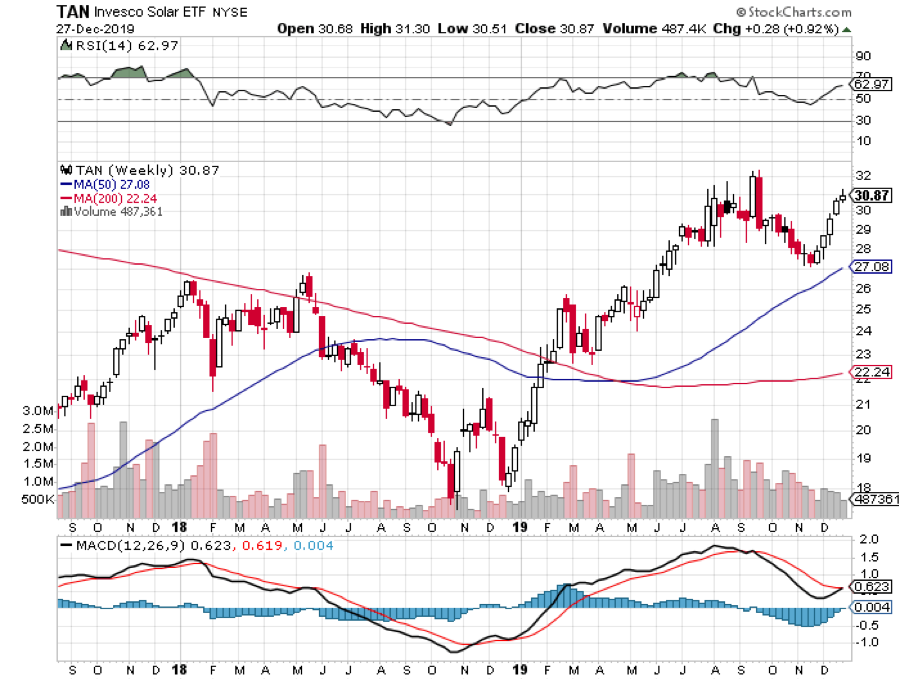
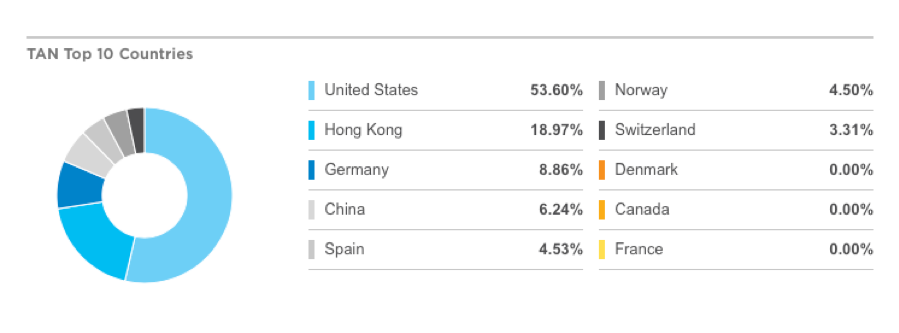
The sole exception has been the Invesco Solar ETF (TAN). It has a globally diversified portfolio that invests in countries with much higher electricity prices than hours, thanks to local regulation and taxes. Only 53% of its investments are in the US, with a hefty 19% in Hong Kong alone, of all places.
The last two years have produced a new reason to go off the grid. Ferocious wildfires in the Golden State that have killed hundreds have led to total statewide blackouts from PG&E whenever wind speeds exceed 40 miles an hour.
Unless you want to keep throwing out all your frozen food every few weeks, the only way to move forward is with a solar-powered battery backup system. It’s just a matter of time before high-end homes can only be sold with 48 hours of backup power. The same logic applies to the hurricane-ravaged east and Gulf coasts. It’s especially an issue today with up to 25% of Bay Area residents working from home.
No juice, no job.
As for me, I am in the process of doubling up my own solar system, taking it up to a gargantuan 23,114 kWh, with three Tesla Powerwalls thrown in for good measure.
But then I have a Tesla P110D Model X that eats up 1,000 kWh a month. All of my appliances are electric except the gas burner because my traditional chef can’t cook without it and the water heater, because I want to have 200 gallons of water at all times in case an earthquake hits. I am turning into my own mini electric power utility, and I am not alone.
I have been encouraged by my experience with my first solar system, which I installed five years ago. It has worked flawlessly, since it has no moving parts. The installer promised me a six-year breakeven against my $500 a month power bill. I covered my cost in four years, thanks to soaring power prices.
And who has the highest electricity prices in the United States? That would be Hawaii, where all fuels have to be imported from great distances. Hawaiians have to pay a massive 66 cents a kilowatt. California only has to pay a peak rate of 55 cents a kilowatt, also among the highest in the country. Drive along Honolulu Interstate H1 today and all you see are solar panels.
Aloha!
https://www.madhedgefundtrader.com/wp-content/uploads/2018/06/On-the-roof-image-7-e1528240516704.jpg258300Mad Hedge Fund Traderhttps://madhedgefundtrader.com/wp-content/uploads/2019/05/cropped-mad-hedge-logo-transparent-192x192_f9578834168ba24df3eb53916a12c882.pngMad Hedge Fund Trader2020-01-08 07:02:562020-01-08 06:42:34California Goes Whole Hog on Solar
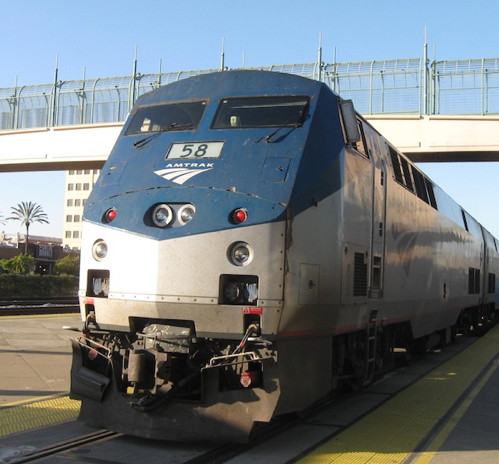
I am once again writing this report from a first-class sleeping cabin on Amtrak’s legendary California Zephyr.
By day, I have two comfortable seats facing each other next to a panoramic window. At night, they fold into two bunk beds, a single and a double. There is a shower, but only Houdini could navigate it.
I am anything but Houdini, so I go downstairs to use the larger public hot showers. They are divine.
We are now pulling away from Chicago’s Union Station, leaving its hurried commuters, buskers, panhandlers, and majestic great halls behind. I love this building as a monument to American exceptionalism.
I am headed for Emeryville, California, just across the bay from San Francisco, some 2,121.6 miles away. That gives me only 56 hours to complete this report.
I tip my porter Raymond $100 in advance to make sure everything goes well during the long adventure and to keep me up-to-date with the onboard gossip. The rolling and pitching of the car is causing my fingers to dance all over the keyboard. Microsoft’s Spellchecker can catch most of the mistakes, but not all of them.
As both broadband and cellphone coverage are unavailable along most of the route, I have to rely on frenzied Internet searches during stops at major stations along the way to Google search obscure data points and download the latest charts.
You know those cool maps in the Verizon stores that show the vast coverage of their cell phone networks? They are complete BS.
Who knew that 95% of America is off the grid? That explains so much about our country today.
I have posted many of my better photos from the trip below, although there is only so much you can do from a moving train and an iPhone 10x.
After making the rounds with strategists, portfolio managers, and hedge fund traders in the run-up to this trip, I can confirm that 2019 was one of the most spectacular for careers lasting 30, 40, or 50 years.
This was the year that EVERYTHING went up, the first time that has happened since 2013. Comparisons with 2008, 1999, and 1929 were frequently made.
While my own 55.77% return for last year is the best in a decade, it nearly doubles the Dow Average performance of 28%. This keeps my ten-year average annualized return at 36.30%.
For a decade, all you had to do was throw a dart at the stock page of the Wall Street Journal and you made money, as long as it didn’t end on retail or energy.
If you think I spend too much time absorbing conspiracy theories from the Internet, let me give you a list of the challenges I see financial markets are facing in the coming year:
The Nine Key Variables for 2020
1) Will the Fed raise rates, or leave them untouched by human hands?
2) Will there be a recession this year, or will we have to wait for 2021?
3) How far can markets run without any fiscal stimulus whatsoever?
4)Will the presidential election send the market for a dive, or has it already priced in?
5) Will technology stocks maintain market leadership, or will other sectors rotate into the lead?
6) Will gold and other commodities finally make a long awaited comeback?
7) Will soaring deficits destroy the US dollar this year?
8) Will energy prices recover in 2020, or are they dead men walking?
9) Is the trade war done, or will it make a vicious comeback?
Here are your answers to the above: 1) no, 2) 2021, 3) more, 4) yes, 5) yes, 6) Yes, 7) Yes, 8) dead men walking, 9) yes.
There you go! That’s all the research you have to do for the coming year. Everything else is a piece of cake. You can go back to enjoying your vacation.
The Thumbnail Portfolio
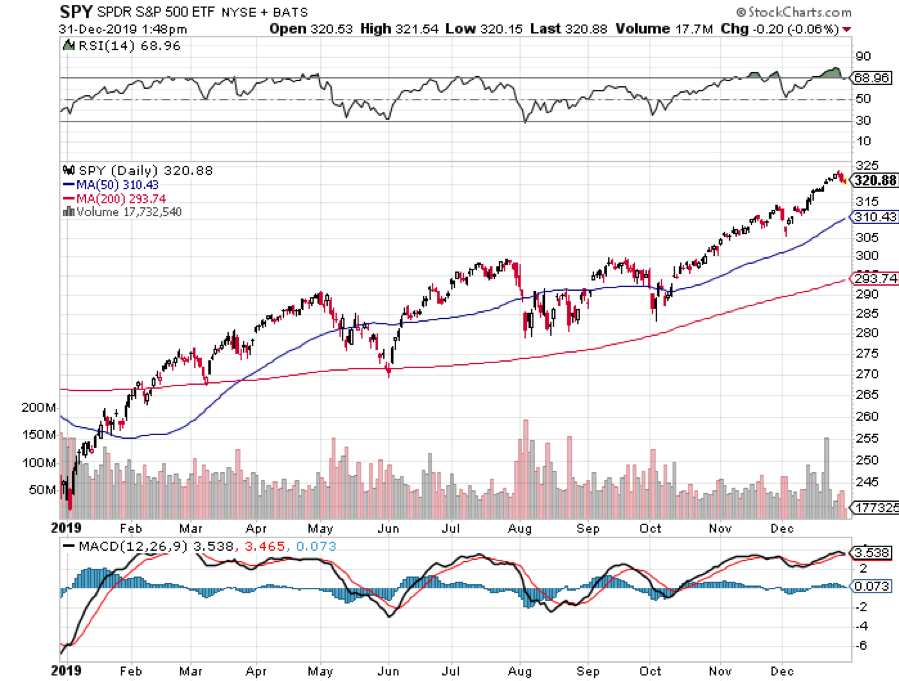
Equities - Go Long. The eleventh year of the bull market takes the S&P 500 up 5% to $3,390 during the first quarter, and then down by 10%-20% in the second half. Then we rally post-election to a new all-time high.
Technology, Pharmaceuticals, Healthcare, and Biotech will lead on the up moves, and now is a great entry point for all of these. Buy low, sell high. Everyone talks about it, but few ever actually execute this.
Bonds - Trade. With no Fed moves expected in 2020, look for a “bouncing along the bottom” kind of year.
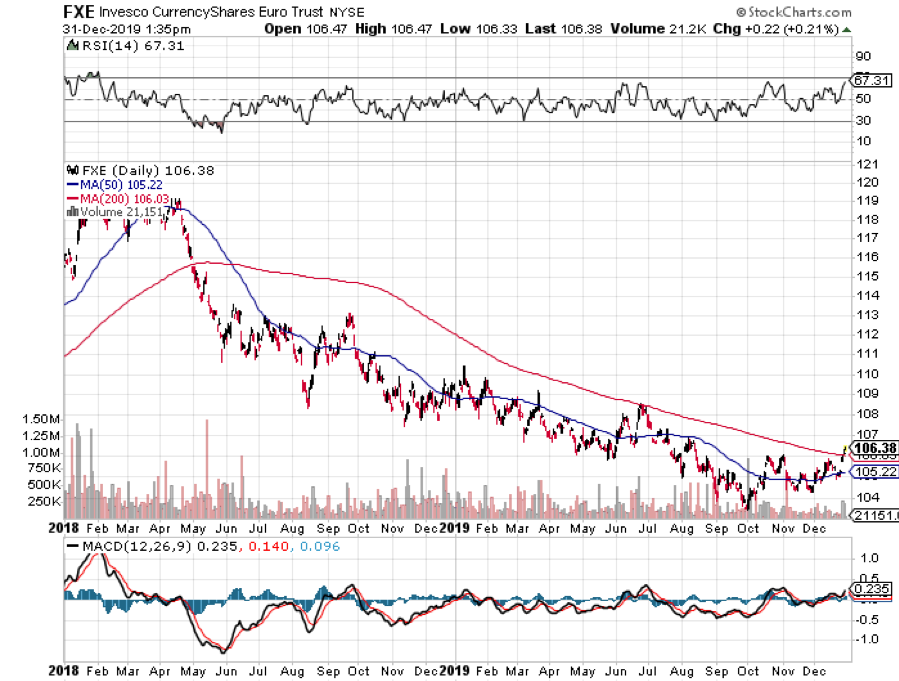
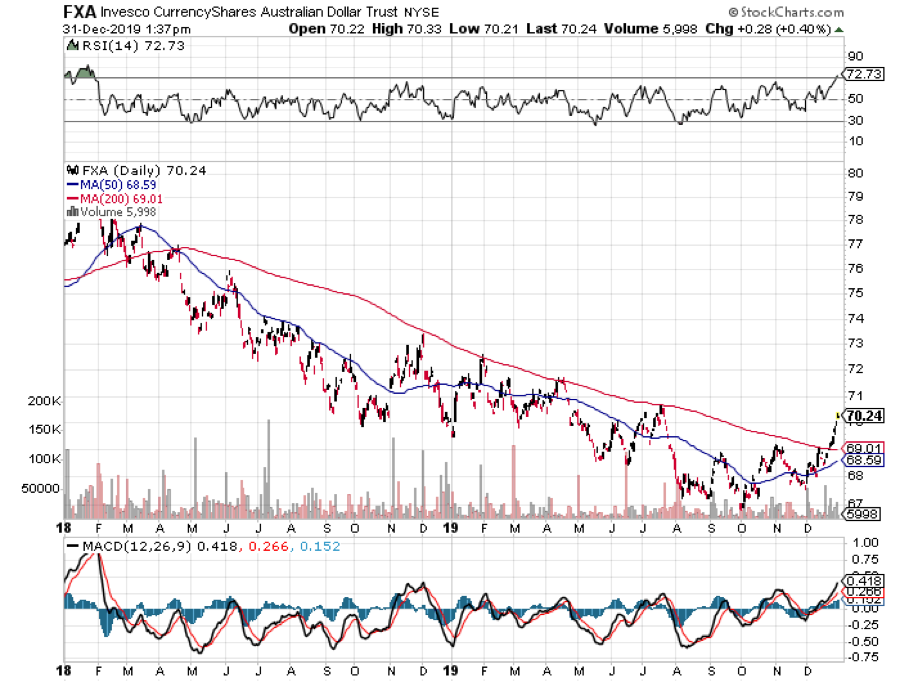
Foreign Currencies - Buy. The US dollar has just ended its six-year bull trend. Any pause in the Fed’s rate rising schedule will send the buck on a swan dive. The fat lady is singing for the greenback.
Commodities - Go Long. Global synchronized recovery continues in the new bull market.
Precious Metals - Buy. Emerging market central bank demand, accelerating inflation, and a pause in the rise of interest rates, will keep the yellow metal slowly appreciating.
Real Estate – Buy Dips. The Golden Age of real estate still has another decade to run. A multi-decade demographic tailwind is just starting, and it is just a matter of time before prices come roaring back.
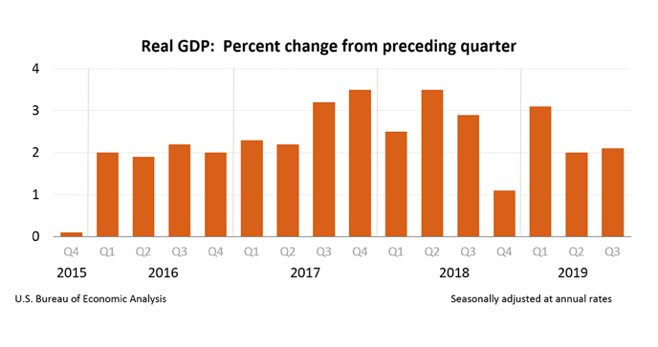
1) The Economy-Slowing
Economic growth has been in a downtrend that has been going on for two years now from 3.5% to possibly as low as 1.5% in the current quarter. The economy is now growing slower than at any time in the last decade.
In January 2020, we face a fiscal cliff when the last of the 2017 stimulus package has been spent. The trade war remains a major drag, possibly costing us 0.5% in GDP growth. You see this in capital spending, which has virtually ground to a halt, thanks to the uncertainty ignited by the trade wars.
CEOs would rather wait to see how things play out before making ANY long-term decisions. Even if a China deal is signed tomorrow, it will take six months for the economy to turn around. Many new higher tariffs will permanently remain.
Other countries are doing worse. The trade wars have shifted the global economy from a synchronized recovery to a US-only recovery, to a globally slowing one. It turns out that damaging the economies of your biggest customers is bad for your own business.
Hyper-accelerating and cross-fertilizing technology will remain a long term and underestimated positive. But you have to live here next to Silicon Valley to realize that.
The bull case for the economy in 2020 is that the trade war is settled, the Fed remains dormant, and recovering trade improves the global economy. This is certainly what the stock market thinks is going to happen.
The unknown is how much of those has already been discounted by the market. It is possible that ALL of it was discounted by the Q4 melt-up.
The party pooper could be the inflation rate, which has been running hot for the past three months. Entry-level wages are growing at the fastest pace in a decade. Too hot, and the Fed will raise interest rates, slowing the economy, and killing off the bull market.
It's also important to remember that current economic growth is entirely deficit-financed. It’s all being borrowed from the future. If the government were running a balanced budget now, the GDP growth rate would be zero. So, when the borrowing ends, so does the economy.
I never thought I’d see it, but my Mad Hedge Market Timing Index is closing out the year at an all-time high of 93.
Stocks will finish higher in 2020, but with much greater volatility. The entire gain in stocks last year came from a 36% expansion in multiples, from 14 to 19. Don’t count on lightening striking in the same place twice.
This meteoric gain was against an earnings improvement for the main market of absolutely zero. Tech stocks continued with prolific earnings growth, which is why I had followers up to their eyeballs in this sector for the entire year.
S&P 500 earnings per share will grow in 2020 from the current $180 to $190. If we can hold on to an earnings multiple of the current 19X, that brings us a gain of 5%. That will take the (SPX) from a current $3,230 to $3,392.
Stocks will rally from here because they are STILL receiving the greatest monetary stimulus in history. Quantitive easing has been running at a $100 billion monthly rate since the fall, and it jumps to $160 billion in January. That compares to $80 billion a month at the peak of QE3. ALL of it is going into the stock market either directly or indirectly.
And here’s the part you don’t want to hear. When QE ends and interest rates rise, the bull market in stocks will die a horrible death. I’ll give you the heads up.
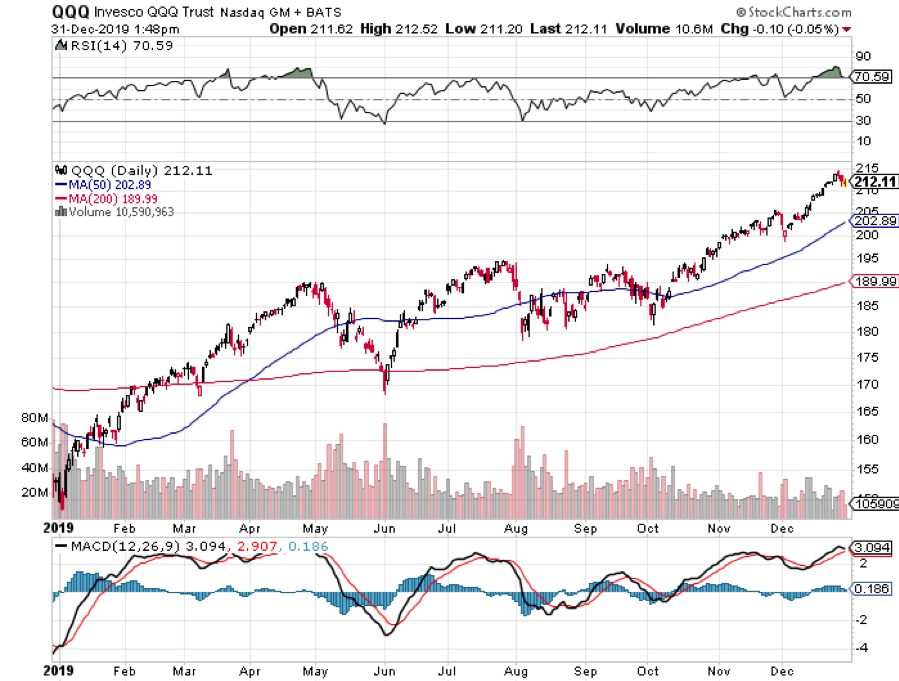
Technology stocks will continue their torrid rise until they don’t. Love them or hate them, big tech accounts for 26% of stock market capitalization but 50% of US profits. That is where the money is. However, in 2020 they will be joined by Biotech and Healthcare companies as market leaders, where political risk is being wildly overestimated.
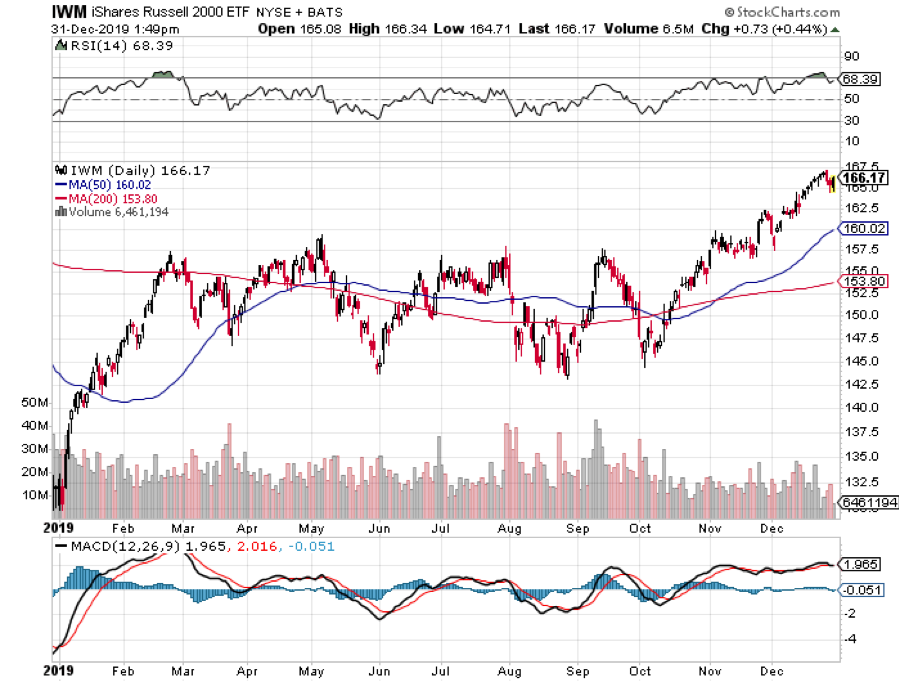
The golden age of passive index investing is over. This year portfolio managers are going to have to earn their crust of bread through perfect market timing, sector selection, and individual name-picking. Good luck with that. But then, that’s why you read this newsletter.
I expect the 2019 rally to continue into 2020. After that, I expect a 10%-20% correction, triggered by a failed trade deal or sudden uncertainty over the election. Then we rally into the yearend one more time once the election uncertainty is out of the way.
It makes no difference who wins. Your entire year will be made buying the next correction bottom. Piece of cake!
Amtrak needs to fill every seat in the dining car to get everyone fed, so you never know who you will share a table with for breakfast, lunch, and dinner.
There was the Vietnam Vet Phantom Jet Pilot who now refused to fly because he was treated so badly at airports. A young couple desperately fleeing Omaha who could only afford seats as far as Salt Lake City. After they sat up all night, I paid for their breakfast.
A retired British couple was circumnavigating the entire US in a month on a “See America Pass.” Mennonites returning home by train because their religion forbade automobiles or airplanes.
Government borrowing should balloon to an eye-popping $1.8 trillion in 2020, a post-World War II record. The national debt is on track to reach $24 trillion by the end of the year. Government borrowing is now so enormous that the issuance system is starting to break down, creating overnight interest rate spikes to an occasional 5%.
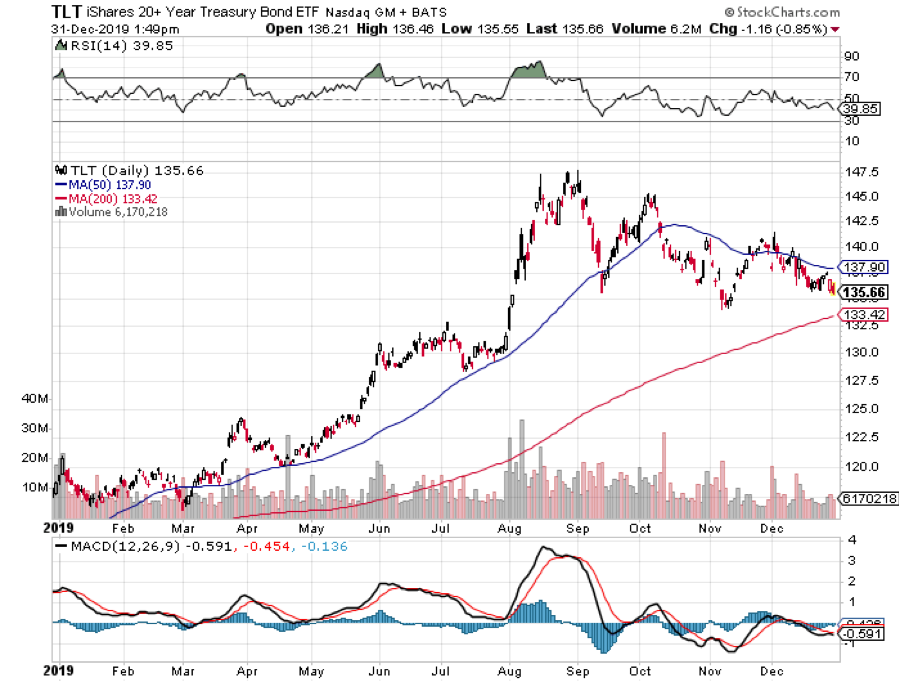
Yet, as long as global central banks are flooding the money supply with trillions of dollars in liquidity, bonds will not fall in value, and may even rise. Bonds with interest payments rose by 16% in 2019.
With a stable Fed, the best-case scenario is that they will remain unchanged in 2020 and the worst case is that they take bonds down -10%. That would take the yield on the Treasury bond from 2.90% to 3.4%. Remove any of that record liquidity, and the bond market crashes, causing interest rates to soar.
What is different this year is that the US dollar is peaking out. That will dampen foreign demand for US debt, about half of the total.
Bond investors today get an unbelievably bad deal. If they hang on to the longer maturities, they will get back only 90 cents worth of purchasing power at maturity for every dollar they invest a decade down the road, at best.
Throughout human history, whenever a country’s borrowing exceeded its GDP, their currency collapsed. It happened to the Roman Empire, Royal France, Weimer Germany, a shrinking Great Britain, and now the US. Quite simply, whenever you print more of a currency, it becomes less valuable.
The national debt just passed $23 trillion, 107% of US GDP, and could hit $25 trillion in a year. How many people noticed?
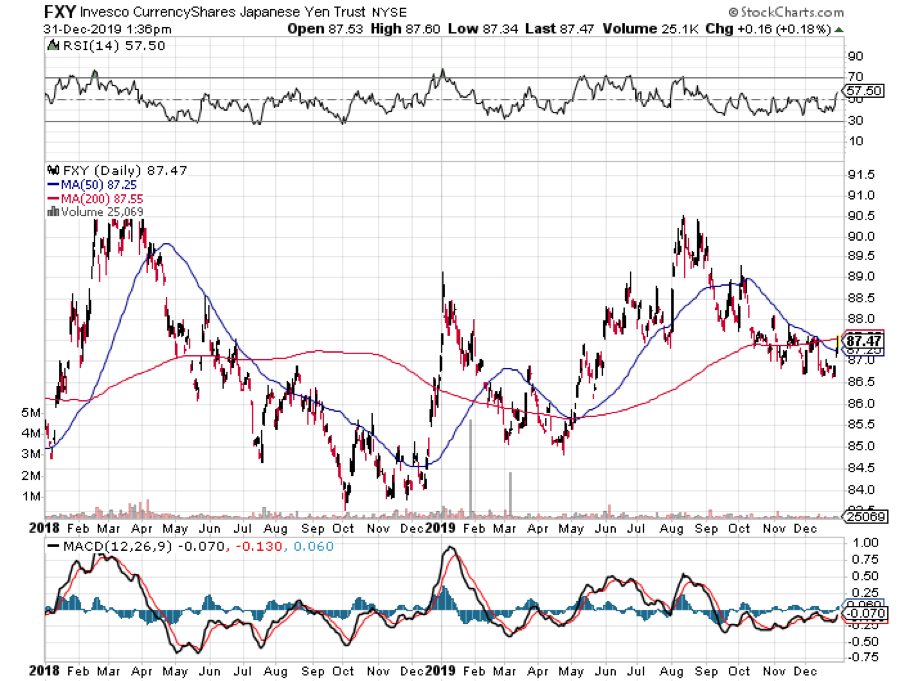
Check out your charts and you’ll see that last summer the US dollar started to depreciate while the Japanese yen and Euro started to gain, almost exactly when we topped the 100% mark.
There is even more trouble.
I have pounded away at you for years that interest rate differentials are far and away the biggest decider of the direction in currencies.
This year will prove that concept once again.
With American overnight rates now at 2.00% and ten-year Treasury bonds at 2.92%, the US has the highest interest rates of any major industrialized economy.
However, pause the Fed’s interest rate rises a year, and the dollar loses its mojo very quickly. In the meantime, foreign interest rates have been rising. German Bund yields have recovered from -90 basis points to -13, while Japanese government bond yields have jumped from -30 basis point to -.03.
Compounding the problem is that a weak dollar begets selling from foreign investors. The Chinese government, the world’s largest buyer of government bonds, have been boycotting US Treasuries for two years now. They are in a mood to do so anyway, as they see rising political instability in the US as a burgeoning threat to the value of the greenback.
So, the dollar will turn weak against all major currencies, especially the Japanese yen (FXY), the Australian (FXA), and Canadian (FXC) dollars.
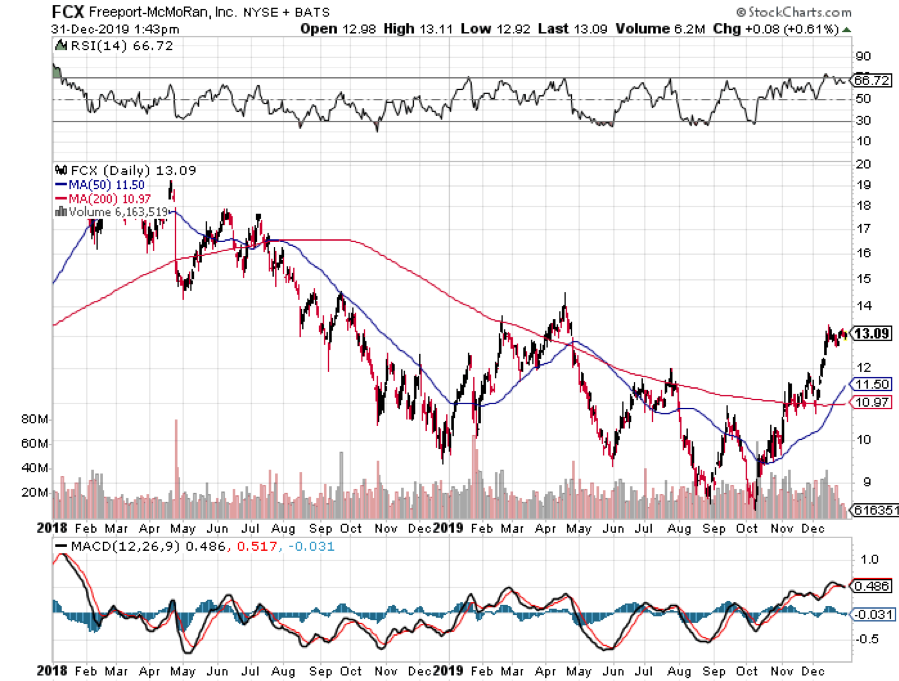
This points the way to all weak dollar plays that we haven’t seen for five years, including emerging markets (EEM), commodities (FCX), and precious metals (GLD).
You can take that to the bank!
5) Commodities (FCX), (VALE), (DBA)
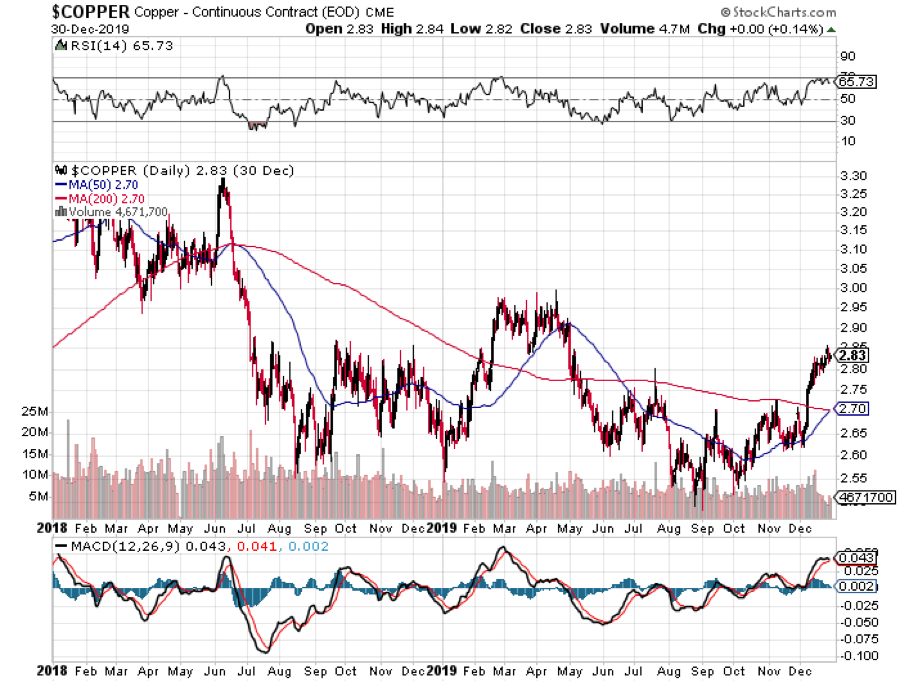
A global synchronized economic recovery, even a small one, can mean only one thing, and that is sustainably higher commodity prices.
Industrial commodities, like copper and iron ore, are literally crawling off of seven-year bottoms, dope-slapped by the twin evils of a strong dollar and the China trade war. Reverse those, and the sector starts to look pretty interesting.
We aren’t retuning to the heady days of the 2011 commodity bubble top anytime soon. That is a mid-2020’s game. Investors are already front-running that move.
However, now that this sector is getting the whiff of a weak dollar and higher inflation, it will take off like a scalded chimp.
China will still demand prodigious amounts of imported commodities, but not as much as in the past. Much of the country has seen its infrastructure build-out, and it is turning from a heavy industrial to a service-based economy, like the US.
The derivative equity plays here, Freeport McMoRan (FCX) and Companhia Vale do Rio Doce (VALE), have all been some of the best performing assets of 2019.
Snow Angel on the Continental Divide
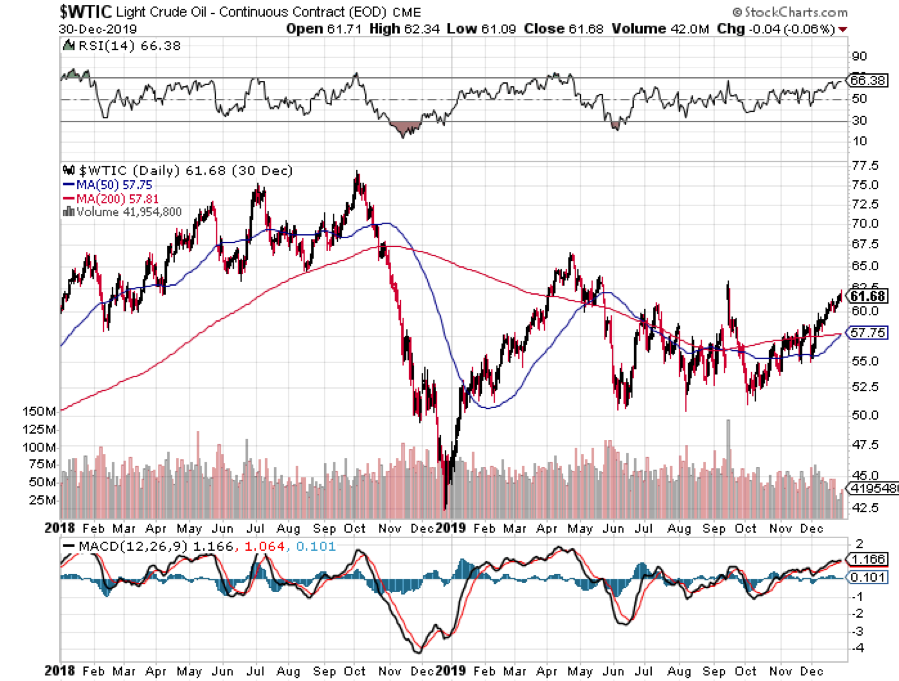
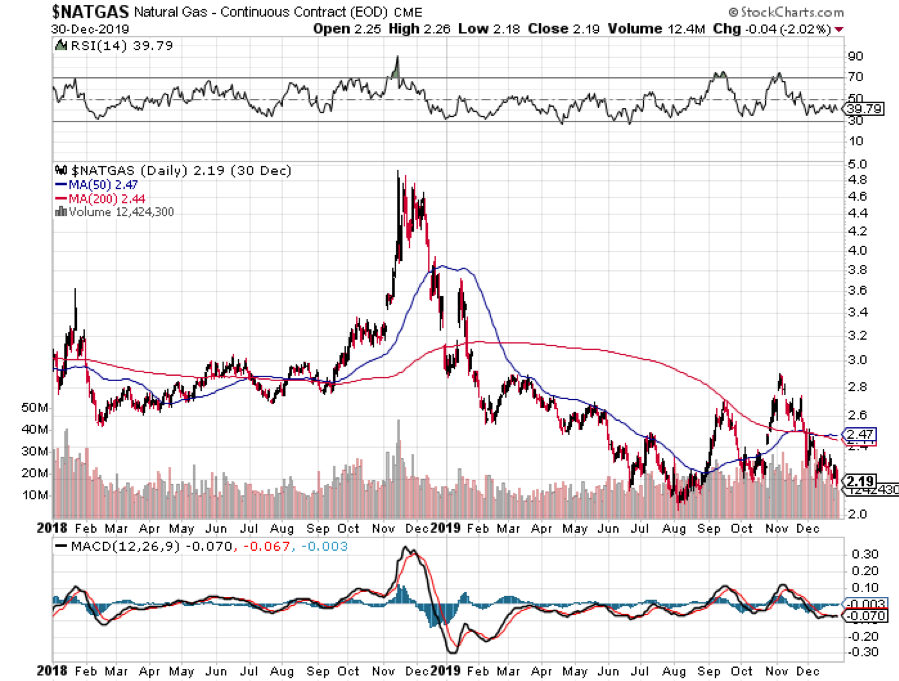
6) Energy (DIG), (RIG), (USO), (DUG), (UNG), (USO), (XLE), (AMLP)
One of my best predictions of 2019 was that energy would be a complete disaster, and so it was.
The industry invested trillions in infrastructure in a grand plan to export natural gas to China. Just as it was coming onstream, the president declared a trade war against China, its principal customer.
So, where does that leave us for 2020?
A lot of people have been piling into energy on the hope that happy days are here again.
They aren’t. Slowing global economies are just what the energy investor doesn’t want to hear.
I believe what we are seeing is a lot of buying on technicals, on cheap prices, and of dogs of the Dow. No one is talking about an embedded structural oversupply of oil that may never be unwound.
Saudi Arabia said as much with the flotation of Saudi Aramco, which has a monopoly on oil production in the kingdom. After a three-year effort, they were only able to shift 1.5% of the company in a local stock exchange listing. It was one of the greatest accounting frauds in history. Only global index funds that HAD to buy shares picked it up. When Saudi Arabia wants to get out of the oil business, so should you.
OPEC Plus engineered a modest 500,000 production cut at their December Vienna meeting, and that has helped prices rise 10%. It is no more than a band-aid on a great gaping wound. Economic growth prospects for 2020 are modest at best, and that does not auger well for the price of Texas Tea.
OPEC production versus American frackers will create the constant tension in the marketplace for all of 2019.
However, my argument in favor of commodities and emerging markets applies to oil as well. A weaker US dollar, trade war end, interest rate halt are all positives for any oil investment. The cure for low oil prices is always low prices.
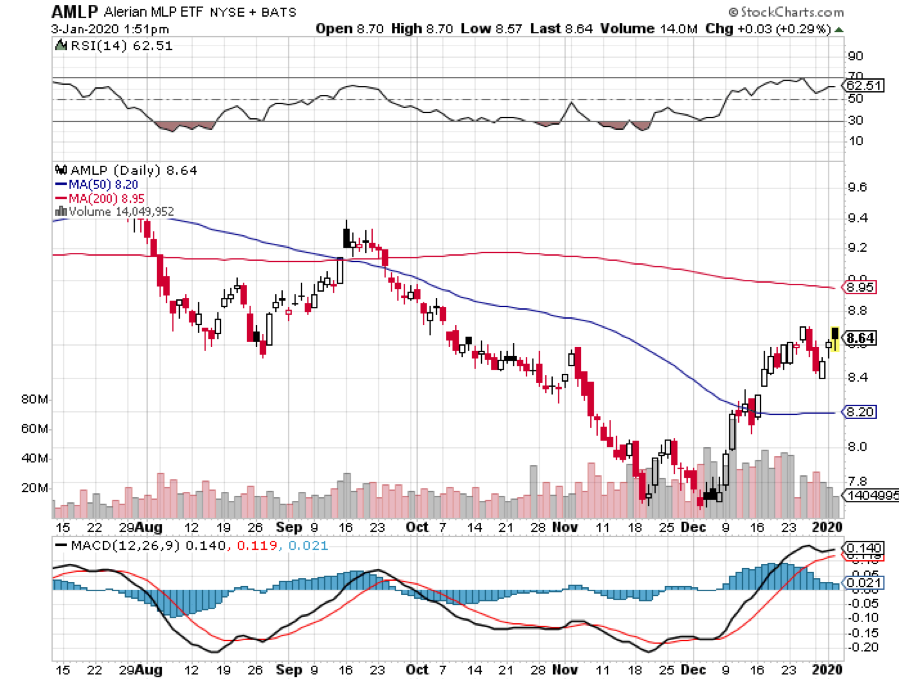
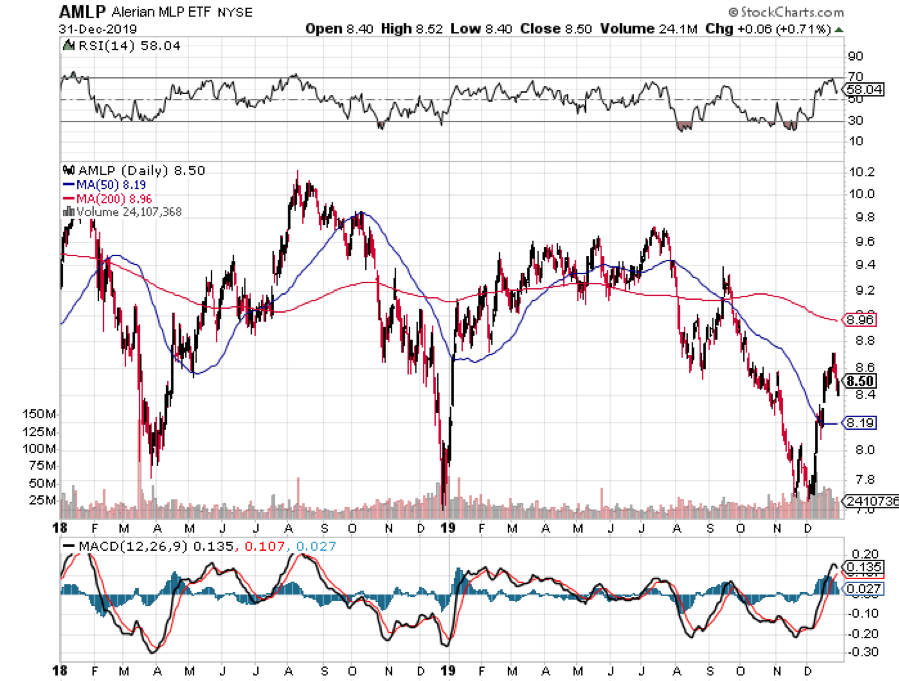
That makes energy Master Limited Partnerships, now yielding 6-10%, especially interesting in this ultra-low yield world. Since no one in the industry knows which issuers are going bankrupt, you have to take a basket approach and buy all of them.
The Alerian MLP ETF (AMLP) does this for you in an ETF format and offers a current massive 9.9% yield. Our train has moved over to a siding to permit a freight train to pass, as it has priority on the Amtrak system.
Three Burlington Northern engines are heaving to pull over 100 black, spanking brand-new tank cars, each carrying 30,000 gallons of oil from the fracking fields in North Dakota.
There is another tank car train right behind it. No wonder Warren Buffett tap dances to work every day, as he owns the railroad.
We are also seeing relentless improvements on the energy conservation front with more electric vehicles, high mileage conventional cars, and newly efficient building. Electric cars are now 4% of US car sales and that could rise to 25% by 2025. Conventional Energy doesn’t fit anywhere in this industry.
In addition, the next election could bring an administration that is distinctly pro-environment and anti-energy and could deep six a 100-year accumulation of oil and gas subsidies. The energy industry now carries far more political risk than the drug industry.
Anyone of these inputs is miniscule on its own. But, add them all together and you have a game-changer, a new paradigm.
We may never see $100/barrel crude again. In fact, the past peak in oil prices may be the last one we ever see. The word is that leasing companies will stop offering five-year agreements in five years because cars with internal combustion engines will become worthless in ten.
As a result, I think I will stand aside from the energy industry in 2020, and maybe, forever. You should too.
The train has added extra engines at Denver, so now we may begin the long laboring climb up the Eastern slope of the Rocky Mountains.
On a steep curve, we pass along an antiquated freight train of hopper cars filled with large boulders.
The porter tells me this train is welded to the tracks to create a windbreak. Once, a gust howled out of the pass so swiftly that it blew a train over on to its side.
In the snow-filled canyons, we sight a family of three moose, a huge herd of elk, and another group of wild mustangs. The engineer informs us that a rare bald eagle is flying along the left side of the train. It’s a good omen for the coming year.
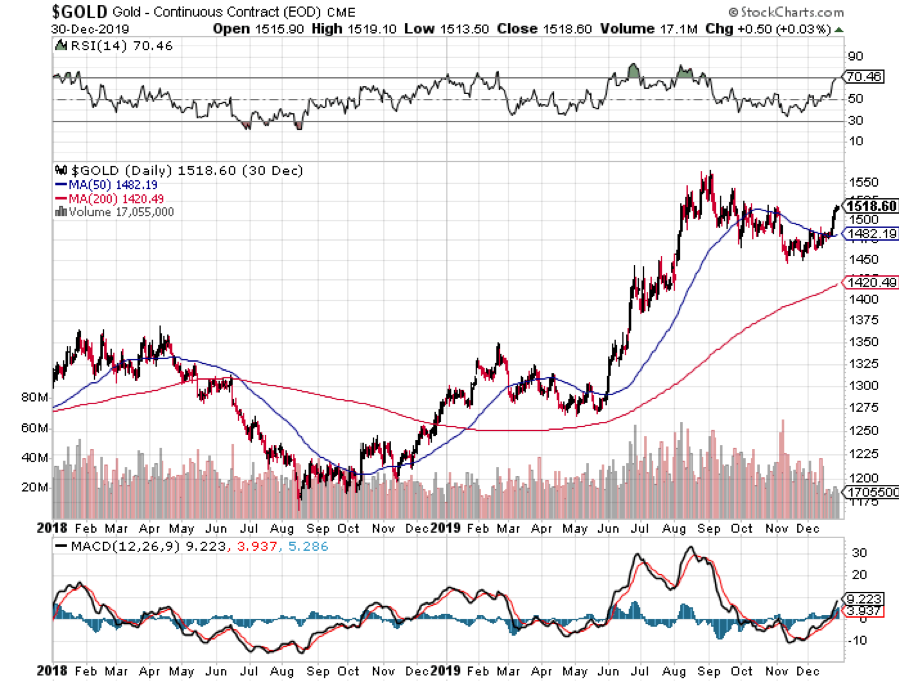
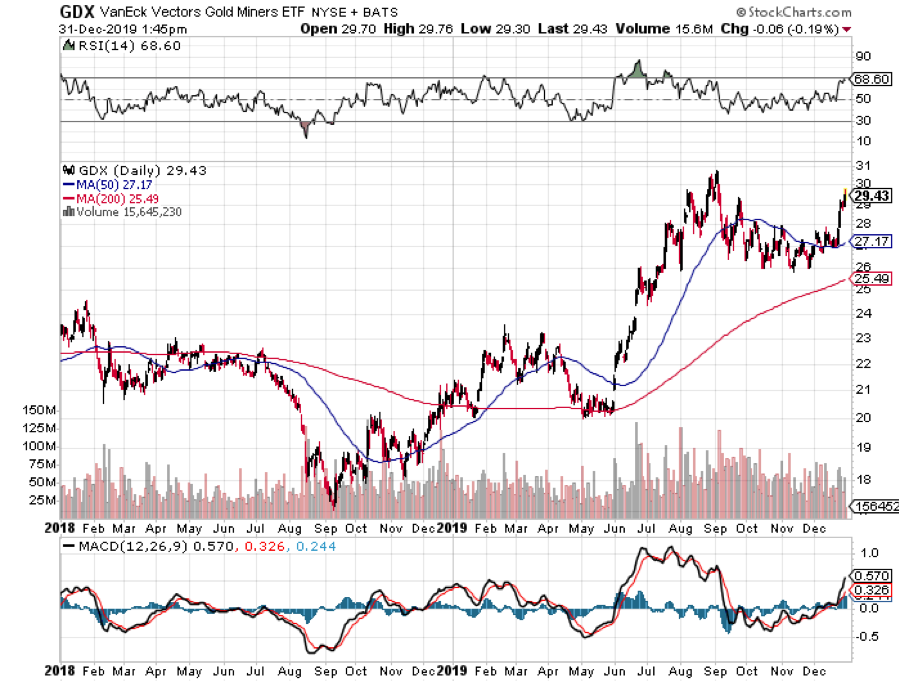
We also see countless abandoned 19th century gold mines and the broken-down wooden trestles leading to them, relics of previous precious metals booms. So, it is timely here to speak about the future of precious metals.
Gold (GLD) brought in a respectable 18% return in 2019, not as much as stocks, but better than a poke in the eye with a sharp stick.
In 2020, gold will finally come out of a long dark age. As long as the world was clamoring for paper assets like stocks, gold was just another shiny rock. After all, who needs an insurance policy if you are going to live forever?
But the long-term bull case is still there. Gold is not dead; it is just resting.
If you forgot to buy gold at $35, $300, or $800, there is another entry point up here for those who, so far, have missed the gravy train.
To a certain extent, the belief that high interest rates are bad for gold is a myth. Wealth creation is a far bigger driver, and we have had plenty of that lately. To see what I mean, take a look at a gold chart for the 1970s when interest rates were going through the roof.
Remember, this is the asset class that takes the escalator up and the elevator down, and sometimes the window.
If the institutional world devotes just 5% of their assets to a weighting in gold and an emerging market central bank bidding war for gold reserves continues, it has to fly to at least $2,300, the inflation-adjusted all-time high, or more.
This is why emerging market central banks step in as large buyers every time we probe lower prices. China and India emerged as major buyers of gold in the final quarters of 2019.
They were joined by Russia, which was looking for non-dollar investments to dodge US economic and banking sanctions.
That means it’s just a matter of time before gold breaks out to a new multiyear high, above $1,550 an ounce. ETF players can look at the 1X (GLD) or the 2X leveraged gold (DGP).
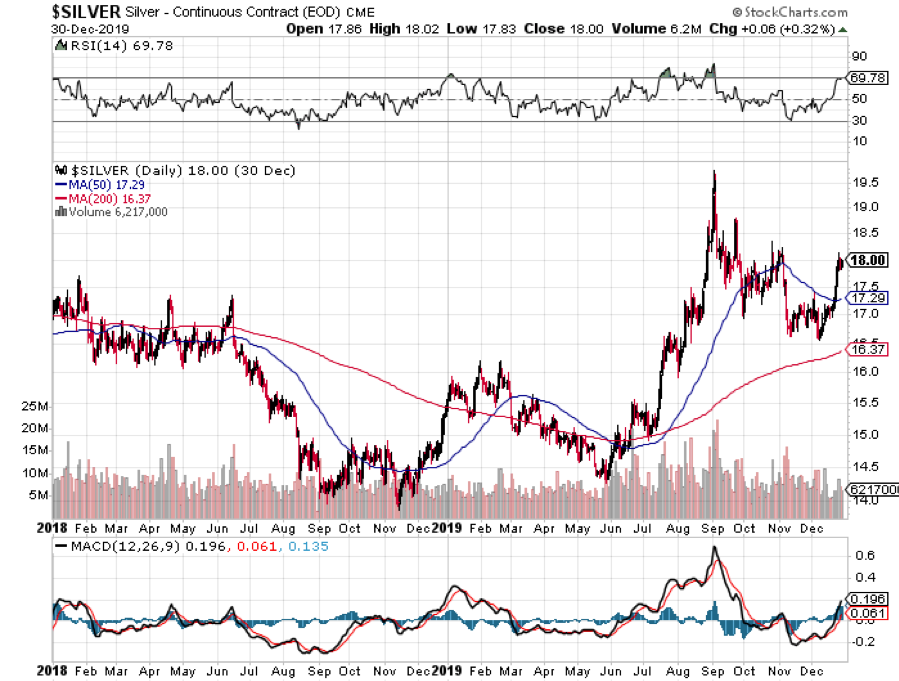
I would also be using the next bout of weakness to pick up the high beta, more volatile precious metal, silver (SLV), which I think could rise from the present $18 and hit $50 once more, and eventually $100.
The turbocharger for gold will hit sometime in 2020 with the return of inflation. Hello stagflation, it’s been a long time.
Would You Believe This is a Blue State?
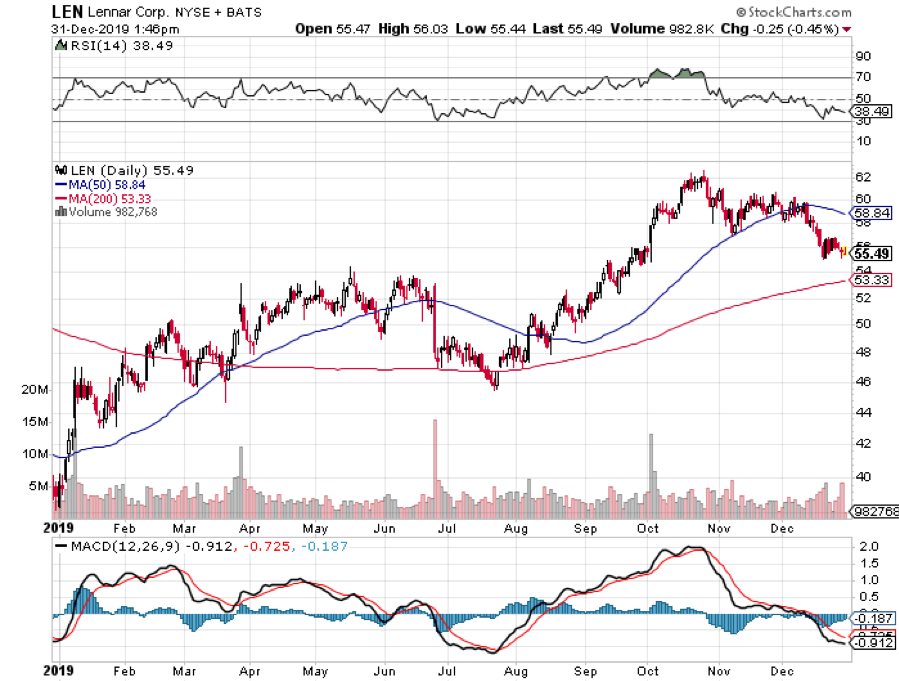
8) Real Estate (ITB), (LEN),
The majestic snow-covered Rocky Mountains are behind me. There is now a paucity of scenery with the endless ocean of sagebrush and salt flats of Northern Nevada outside my window so there is nothing else to do but write.
My apologies in advance to readers in Wells, Elko, Battle Mountain, and Winnemucca, Nevada.
It is a route long traversed by roving banks of Indians, itinerant fur traders, the Pony Express, my own immigrant forebearers in wagon trains, the transcontinental railroad, the Lincoln Highway, and finally US Interstate 80, which was built for the 1960 Winter Olympics at Squaw Valley.
Passing by shantytowns and the forlorn communities of the high desert, I am prompted to comment on the state of the US real estate market.
There is no doubt a long-term bull market in real estate is underway.
The good news is that we will not see a 2008 repeat when home values cratered by 50%-70%. There is just not enough leverage in the system to do any real damage. That has gone elsewhere, like in exchange-traded funds. You can thank Dodd/Frank for that, which imposed capital rules so strict, that it is now almost impossible for banks to commit suicide.
You are not going to see serious damage in a market where there is a generational structural shortage of supply.
We are probably ten years into an 18-year run at the next peak in 2028.
There are only three numbers you need to know in the housing market for the next 20 years: there are 80 million baby boomers, 65 million Generation Xers who follow them, and 86 million in the generation after that, the Millennials.
The boomers have been unloading dwellings to the Gen Xers since prices peaked in 2007. But there are not enough of the latter, and three decades of falling real incomes mean that they only earn a fraction of what their parents made. That’s what caused the financial crisis.
If they have prospered, banks won’t lend to them. Brokers used to say that their market was all about “location, location, location.” Now it is “financing, financing, financing.” Imminent deregulation is about to deep six that problem.
There is a happy ending to this story.
Millennials now aged 24-39 are already starting to kick in as the dominant buyers in the market. They are transitioning from 30% to 70% of all new buyers of homes.
The Great Millennial Migration to the suburbs has just begun. So has the migration from the coast to the American heartland. Personally, I like Reno, Nevada.
As a result, the price of single family homes should rocket tenfold during the 2020s as they did during the 1970s and the 1990s when similar demographic forces were at play.
This will happen in the context of a coming labor shortfall, soaring wages, and rising standards of living.
Rising rents are accelerating this trend. Renters now pay 35% of their gross income, compared to only 18% for owners, and less when multiple deductions and tax subsidies are taken into account.
Remember, too, that the US will not have built any new houses in large numbers in 12 years. The 50% of small homebuilders that went under during the crash aren’t building new homes today.
We are still operating at only a half of the peak rate. Thanks to the Great Recession, the construction of five million new homes has gone missing in action.
That makes a home purchase now particularly attractive for the long term, to live in and not to speculate with.
You will boast to your grandchildren how little you paid for your house, as my grandparents once did to me ($3,000 for a four-bedroom brownstone in Brooklyn in 1922), or I do to my kids ($180,000 for an Upper East Side Manhattan high-rise in 1983).
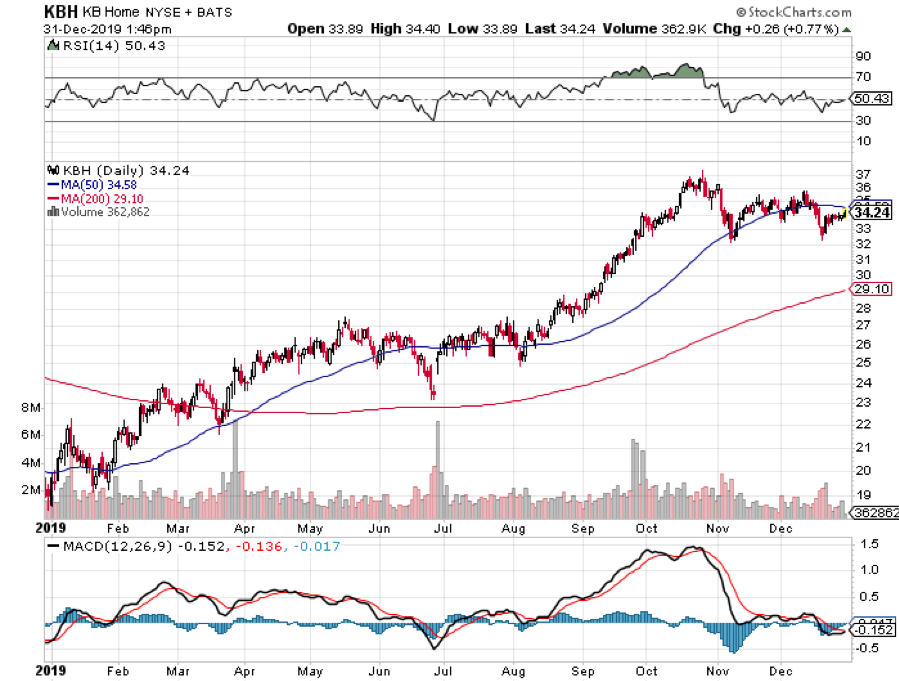
That means the major homebuilders like Lenar (LEN), Pulte Homes (PHM), and KB Homes (KBH) are a buy on the dip.
Quite honestly, of all the asset classes mentioned in this report, purchasing your abode is probably the single best investment you can make now.
If you borrow at a 4% 30-year fixed rate, and the long-term inflation rate is 3%, then, over time, you will get your house nearly for free.
How hard is that to figure out?
Crossing the Bridge to Home Sweet Home
9) Postscript
We have pulled into the station at Truckee in the midst of a howling blizzard.
My loyal staff have made the ten-mile treck from my beachfront estate at Incline Village to welcome me to California with a couple of hot breakfast burritos and a chilled bottle of Dom Perignon Champagne, which has been resting in a nearby snowbank. I am thankfully spared from taking my last meal with Amtrak.
After that, it was over legendary Donner Pass, and then all downhill from the Sierras, across the Central Valley, and into the Sacramento River Delta.
Well, that’s all for now. We’ve just passed the Pacific mothball fleet moored near the Benicia Bridge. The pressure increase caused by a 7,200-foot descent from Donner Pass has crushed my water bottle.
The Golden Gate Bridge and the soaring spire of Salesforce Tower are just around the next bend across San Francisco Bay.
A storm has blown through, leaving the air crystal clear and the bay as flat as glass. It is time for me to unplug my Macbook Pro and iPhone X, pick up my various adapters, and pack up.
We arrive in Emeryville 45 minutes early. With any luck, I can squeeze in a ten-mile night hike up Grizzly Peak and still get home in time to watch the ball drop in New York’s Times Square.
I reach the ridge just in time to catch a spectacular pastel sunset over the Pacific Ocean. The omens are there. It is going to be another good year.
I’ll shoot you a Trade Alert whenever I see a window open at a sweet spot on any of the dozens of trades described above.
Good luck and good trading in 2020!
John Thomas
The Mad Hedge Fund Trader
The Omens Are Good for 2020!
https://madhedgefundtrader.com/wp-content/uploads/2019/05/cropped-mad-hedge-logo-transparent-192x192_f9578834168ba24df3eb53916a12c882.png00Mad Hedge Fund Traderhttps://madhedgefundtrader.com/wp-content/uploads/2019/05/cropped-mad-hedge-logo-transparent-192x192_f9578834168ba24df3eb53916a12c882.pngMad Hedge Fund Trader2020-01-06 08:02:142020-01-06 08:52:572020 Annual Asset Class Review
To the dozens of subscribers in Afghanistan, Somalia, Iraq, and the surrounding ships at sea, thank you for your service!
I think it is very wise to use your free time to read my letter and learn about financial markets in preparation for an entry into the financial services when you muster out.
Nobody is going to call you a baby killer and shun you, as they did when I returned from Southeast Asia four decades ago. In fact, employers have been given fantastic tax breaks and other incentives to hire you.
I have but one request. No more subscriptions with .mil addresses, please. The Defense Department, the CIA, the NSA, Homeland Security, and the FBI do not look kindly on private newsletters entering the military network, even the investment kind.
If you think civilian spam filters are tough, watch out for the military kind! And no, I promise that there are no secret messages embedded with the stock tips. “BUY” really does mean “BUY.” “Sell” means “Sell” too.
If I did not know the higher-ups at these agencies, as well as the Joint Chiefs of Staff, I might be bouncing off the walls in a cell at Guantanamo by now wearing an orange jumpsuit.
It also helps that many of the mid-level officers at these organizations have made a fortune with their meager government retirement funds following my advice. All I can say is that if the Baghdad Stock Exchange ever becomes liquid, I'm going to own it.
Where would you guess the greatest concentration of readers The Diary of a Mad Hedge Fund Trader is found? New York? Nope. London? Wrong. Chicago? Not even close. Try a ten-mile radius centered on Langley, Virginia, by a large margin.
The funny thing is, half of the subscribing names coming in are Russian. I haven't quite figured that one out yet. Did we hire the entire KGB at the end of the cold war? If we did, it was a great move. Those guys were good. That includes you, Yuri.
So keep up the good work, and fight the good fight. But please, only subscribe to my letter with personal Gmail, Yahoo, or Hotmail addresses. That way my life can become a lot more boring.
Oh, and by the way, Langley, you're behind on your bill. Please pay up, pronto, and I don't want to hear whining about any damn budget cuts!
I Want My Mad Hedge Fund Trader!
https://www.madhedgefundtrader.com/wp-content/uploads/2017/06/army-cig-e1498672458898.jpg393557Mad Hedge Fund Traderhttps://madhedgefundtrader.com/wp-content/uploads/2019/05/cropped-mad-hedge-logo-transparent-192x192_f9578834168ba24df3eb53916a12c882.pngMad Hedge Fund Trader2020-01-03 08:04:062020-01-03 09:12:06Notice to Military Subscribers
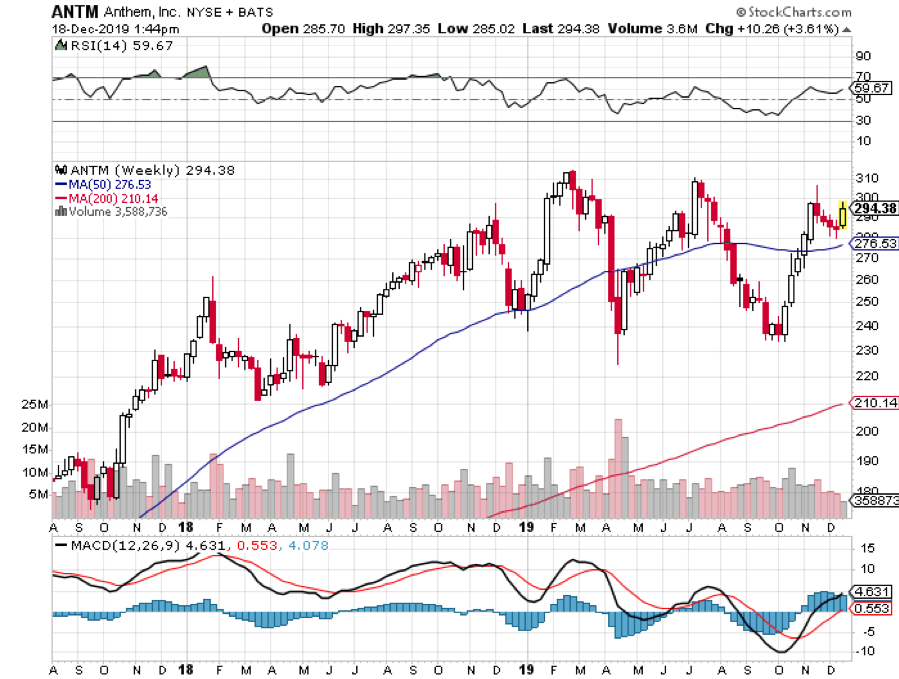
One of the notable lessons in value investing is this: boring is oftentimes a good thing. Tangible proof of this principle is to be found in Anthem Inc (ANTM), which is a virtually inconspicuous stock but is performing satisfactorily for its investors.
Here’s a brief background on this relatively obscure stock.
Anthem is offering various healthcare plans to corporations and individuals. The holding company also provides its services to Medicare and Medicaid markets, which are comprised of approximately 40 million Americans.
Aimed at becoming a one-stop-shop for its clients’ insurance needs, the company’s offerings include dental and vision services and life insurance. To date, Anthem is ranked among the top five healthcare and insurance providers in the United States while it placed No. 29 among Fortune 500 companies. Clearly, this “unknown” stock is one of the industry leaders today.
Where does Anthem currently stand?
While the healthcare industry seems to be struggling with countless changes courtesy of the Trump administration, Anthem appears to be well prepared to handle whatever comes its way.
Here’s a case in point.
Anthem had to retrench on their Obamacare services last year. Despite that, the company still impressed its investors with a 3.8% improvement in its operating revenue year over year. That's not bad for an insurance company.
How did the company manage to recoup its losses? The lost revenues from Obamacare were counterbalanced by a boost in new insurance premiums along with an increase in the number of Medicare enrollments.
Since its fourth-quarter results in 2018 pleasantly surprised investors and analysts alike, it’s anticipated that Anthem will perform just as well or even better this year. So far, predictions for Anthem’s performance in 2019 remain bullish.
The stock market noticed. Since October, the stock has gone ballistic, rocketing an impressive 30%.
However, no company is perfect. One major red flag for Anthem is its ongoing lawsuit against another healthcare provider, Cigna (CI), over their botched merger plans. If the legal battle continues, then Anthem is poised to incur substantial long-term expenses.
Bottom Line
All in all, Anthem is a solid stock that offers an attractive combination of stability and continuous long-term growth in anyone’s portfolio. Thus far, the company has performed well and managed to provide acceptable financial results to its investors.
Although its business has not grown by leaps and bounds, its modest growth in the past years and the projected consistency in its stock performance in the years to come make Anthem a reasonable investment.
Buy Anthem on the next decent dip.
https://madhedgefundtrader.com/wp-content/uploads/2019/05/cropped-mad-hedge-logo-transparent-192x192_f9578834168ba24df3eb53916a12c882.png00Mad Hedge Fund Traderhttps://madhedgefundtrader.com/wp-content/uploads/2019/05/cropped-mad-hedge-logo-transparent-192x192_f9578834168ba24df3eb53916a12c882.pngMad Hedge Fund Trader2019-12-19 07:02:132020-05-11 14:03:30Play It Safe With Anthem
What would happen if I recommended a stock that had no profits, was losing billions of dollars a year and had a net worth of negative $44 trillion?
Chances are, you would cancel your subscription to the Mad Hedge Fund Trader, demand a refund, unfriend me from your Facebook account, and unfollow me on Twitter.
Yet, that is precisely what my former colleague at Morgan Stanley did a few years ago, technology guru Mary Meeker.
Now a partner at venture capital giant Kleiner Perkins, Mary has brought her formidable analytical talents to bear on analyzing the United States of America as a stand-alone corporation.
The bottom line: the challenges are so great they would daunt the best turnaround expert. The good news is that our problems are not hopeless or unsolvable.
The US government was a miniscule affair until the Great Depression and WWII when it exploded in size. Since 1965 when Lyndon Johnson’s “Great Society” began, GDP rose by 2.7 times, while entitlement spending leapt by 11.1 times.
If current trends continue, the Congressional Budget Office says that entitlements and interest payments will exceed all federal revenues by 2025.
Of course, the biggest problem is with health care spending, which will see no solution until health care costs are somehow capped. Despite spending more than any other nation, we get one of the worst results, with lagging quality of life, life spans, and infant mortality.
Some 28% of Medicare spending is devoted to a recipient’s final four months of life. Somewhere, there are emergency room cardiologists making a fortune off of this. A night in an American hospital costs 500% more than in any other country.
Social Security is an easier fix. Since it started in 1935, life expectancy has risen by 26% to 78, while the retirement age is up only 3% to 66. Any reforms have to involve raising the retirement age to at least 70 and means testing recipients.
The solutions to our other problems are simple but require political suicide for those making the case.
For example, you could eliminate all tax deductions, including those for home mortgage deductions, charitable contributions, IRA contributions, dependents, and medical expenses, and raise $1 trillion a year. That would more than wipe out the current budget deficit in one fell swoop.
Mary reminds us that government spending on technology laid the foundations of our modern economy. If the old DARPANET had not been funded during the sixties, Google, Yahoo, eBay, Facebook, Cisco, and Oracle would be missing today. Tech generates about 50% of all the profits in the US today.
Global Positioning Systems (GPS) were also invented by and is still run by the government and has been another great wellspring of profits. I got to use it during the 1980s while flying across Greenland when it was still top secret. The Air Force base that ran it was called “Sob Story.”
There are a few gaping holes in Mary’s “thought experiment.” I doubt she knows that the Treasury Department carries the value of America’s gold reserves, the world’s largest at 8,965 tons worth $576 billion, at only $34 an ounce, versus an actual current market price of $1,288.
Nor is she aware that our ten aircraft carriers are valued at $1 each, against an actual cost of $10 billion each in today’s dollars. And what is Yosemite worth on the open market, or Yellowstone, or the Grand Canyon? These all render her net worth calculations meaningless.
Mary expounds at length on her analysis which you can buy in a book entitled USA Inc. at Amazon by clicking here.
Worth More Than a Dollar?
https://www.madhedgefundtrader.com/wp-content/uploads/2019/01/naval-fleet.png387516Mad Hedge Fund Traderhttps://madhedgefundtrader.com/wp-content/uploads/2019/05/cropped-mad-hedge-logo-transparent-192x192_f9578834168ba24df3eb53916a12c882.pngMad Hedge Fund Trader2019-11-27 04:04:272019-11-26 07:00:55Is USA Inc. a Short?
Legal Disclaimer
There is a very high degree of risk involved in trading. Past results are not indicative of future returns. MadHedgeFundTrader.com and all individuals affiliated with this site assume no responsibilities for your trading and investment results. The indicators, strategies, columns, articles and all other features are for educational purposes only and should not be construed as investment advice. Information for futures trading observations are obtained from sources believed to be reliable, but we do not warrant its completeness or accuracy, or warrant any results from the use of the information. Your use of the trading observations is entirely at your own risk and it is your sole responsibility to evaluate the accuracy, completeness and usefulness of the information. You must assess the risk of any trade with your broker and make your own independent decisions regarding any securities mentioned herein. Affiliates of MadHedgeFundTrader.com may have a position or effect transactions in the securities described herein (or options thereon) and/or otherwise employ trading strategies that may be consistent or inconsistent with the provided strategies.