• support@madhedgefundtrader.com
  • Member Login
Mad Hedge Fund Trader
  • Home
  • About
  • Store
  • Luncheons
  • Testimonials
  • Contact Us
  • Click to open the search input field Click to open the search input field Search
  • Menu Menu
Mad Hedge Fund Trader

Perfect Storm Hits the Banks

Diary, Newsletter, Research

There is no better sight to a hungry trader than blood in the water.

?Buy them when they?re cryin? is an excellent investment strategy that always seems to work.

There are rivers of tears being shed over the banking industry right now.

Federal Reserve officials openly told investors that after the December ?% rate hike that they would continue to do so on a quarterly basis. Only weeks later, a collapse in the stock market shattered this scenario to smithereens.

I doubt we?ll see any more Fed action in 2016.

This caught investors in bank shares wrong footed in a major way.

But wait! It gets worse!

Among the largest holders of American bank shares are the Persian Gulf sovereign wealth funds, including those for Saudi Arabia, Kuwait, Oman, Qatar, and the United Arab Emirates, my old stomping grounds. Pieces of me are still there.

The collapse in oil prices (USO) has put their budgets in tatters and they now have to sell stock to fund wildly generous social service programs. The farther Texas tea drops, the more shares they have to sell, and at $26 a barrel they have to sell bucket loads.

Had enough? There?s more.

The junk bond market (JNK) and oil company shares are suggesting that up to half of all American oil companies will go bankrupt sometime this year, mostly small ones. It all depends on how long oil stays under $40.

Unfortunately, the oil industry has been the most prolific borrower from banks for the last decade. The covenants on many of these loans require borrowers to pump and sell oil to meet interest payments NO MATTER THE PRICE! It?s a perfect formula for maxing out production and selling into a hole.

So fear of widespread energy defaults has also been dragging down bank shares as well.

Some of the moves so far in this short year have been absolutely eye popping. Bank of America (BAC) has plunged 31% from its recent high, while Citibank (C) is down 32% and JP Morgan is off 19%. Basically, they all had a terrible year just in the month of January.

Bank shares have been beaten so mercilessly that they are approaching levels last seen at the nadir of the 2009 financial crisis.

Except that this time, there is no financial crisis, not even the hint of one. For the past seven years, banks have been relentlessly raising capital, reducing leverage, and growing BIGGER.

They proved last time that they were too big to fail. Now they are REALLY too big to fail. Default rates aren?t even a fraction of what we saw during the bad old days. Energy industry borrowing is only a tenth the size of bank home loan portfolios going into the crisis.

Blame the Dodd-Frank financial regulation bill, which requires banks to hold far more capital In US Treasury bonds (TLT) than in the past, which by the way, are doing spectacularly well.

Blame ultra cautious management.

Whatever the reason, Big US banks are now solid as the Rock of Gibraltar.

Which means I?m starting to get interested. Interest rates don?t go down forever, nor does the price of oil. And scares about loan defaults are being wildly exaggerated by the media, as always.

But there is more than one way to skin a cat.

All of these companies issue high yield preferred stock with exceptionally high dividends. For example, Bank of America issued 6.2% yielding paper as recently as October. It is paying something like 8% now.

Since these securities are stock, you get to participate in price appreciation when the panic subsides. A guaranteed 8% return, plus the prospect of substantial capital appreciation? Sounds like a pretty good deal to me.

Google bank preferred shares and you will find an entire world out there of specialist advisors, dedicated newsletters and even day trading and hedging recommendations.

One thing to keep in mind here is that you should only buy ?non callable? paper. This prevents issuers from stealing your paper when better times return to cut their interest payouts.

There is another way to play this beleaguered sector.

You can buy the iShares S&P US Preferred Stock Index Fund ETF (PFF), which owns a basket of preferred stocks almost entirely made up of bank shares. As of today it was yielding 5.62%. To visit the fund?s website, please click link: https://www.ishares.com/us/products/239826/ishares-us-preferred-stock-etf.

BAC2-3-16

C 2-3-16

JPM 2-3-16

PFF 2-3-16

ATM-CrashTime to BUY?

https://www.madhedgefundtrader.com/wp-content/uploads/2016/02/ATM-Crash-e1454593247769.jpg 299 400 Mad Hedge Fund Trader https://madhedgefundtrader.com/wp-content/uploads/2019/05/cropped-mad-hedge-logo-transparent-192x192_f9578834168ba24df3eb53916a12c882.png Mad Hedge Fund Trader2016-02-04 01:08:092016-02-04 01:08:09Perfect Storm Hits the Banks
Mad Hedge Fund Trader

Bank of Japan Bombshell Boosts Markets

Diary, Newsletter, Research

I was just about to don my backpack and head out for my evening hike when I caught a phone call from Tokyo.

The Bank of Japan had just announced they were implementing negative interest rates for the first time in history. The Japanese yen (FXE), (YCS) was in free fall and the stock market (DXJ) was soaring.

Note to self: don?t ever answer the phone just as I?m heading out the door. Good-bye hike, hello another inch on my waistline.

However, bank stocks were getting destroyed, as they would now have to pay money to the central bank to accept deposits, as they already do in Europe and Switzerland.

The overnight trading in S&P 500 (SPY) futures jumped from unchanged to up 100 points. It looked like January was going to go out with a bang. This could be the mother of all month end window dressings.

It really was a day for moves that made no sense. Bonds (TLT) rose with stocks on the hopes that any Fed interest rate hikes for this year will be cancelled. That?s like dogs and cats laying together.

Gold (GLD) rose modestly, even though the prospect of more quantitative easing anywhere in the world should have caused it to crater.

The US dollar was robust (UUP), just when you?d think that lower for longer interest rates should weaken it. I guess it?s a case of being the best house in a bad neighborhood.

Oil (USO), the main driver of all process for the past six months, was strangely unchanged for a change.

It was really one of those days when you wanted to hurl your empty beer cans at the TV, throw up your hands, and cry.

Personally, I don?t think US risk markets are out of the woods yet. We can?t escape the reality that earning multiples for American companies are falling.

You have to ask the question of what do negative interest rates really mean for the global economy? Hint: none of the answers are good.

Blame it on a Fed tightening cycle, which has just been shifted from second gear back to first. Blame it on a decade long GDP growth rate, which is stuck at 2%. That is caused by demographic headwinds that we can do nothing about.

Whatever the reason, stocks are not headed straight up from here. I think we are just squeezing out the shorts for the umpteenth time. They could all be cleaned out by the time the (SPY) hits $195.

Then it will be back to the low end of our new, violent range, probably just above $182.

DXJ 1-29-16

FXY 1-29-16

YCS 1-29-16

Bank of JapanSurprise!

https://www.madhedgefundtrader.com/wp-content/uploads/2016/01/Bank-of-Japan-e1454176764535.jpg 227 400 Mad Hedge Fund Trader https://madhedgefundtrader.com/wp-content/uploads/2019/05/cropped-mad-hedge-logo-transparent-192x192_f9578834168ba24df3eb53916a12c882.png Mad Hedge Fund Trader2016-02-01 01:07:452016-02-01 01:07:45Bank of Japan Bombshell Boosts Markets
Mad Hedge Fund Trader

Ten Stocks to Buy at the Bottom

Diary, Newsletter, Research

Suddenly, the consolidation turned into a correction and maybe even a bear market.

A crucial part of trading a crash is knowing what to do at the bottom. Don?t worry. You?ll receive a flurry of text alerts from me right when that happens.

Many individual investors simply run to the bathroom and lock the door, hoping nobody knocks on the door for a couple of days.

Worse, they dump every stock they have. That?s what makes market bottoms.

Trades that once seemed impossible can now get done, provided you use limit orders.

Let me get this right. Stocks are crashing because:

1) The Federal Reserve isn?t going to raise interest rates anymore.
2) The price of oil has dropped 84% in five years.
3) Commodities have reached multi-decade lows.
4) The US dollar has suddenly stabilized.
5) Investors are yanking money from abroad and pouring it into the US on a flight to safety trade because it is the only place they can obtain a positive return, especially in stocks.

May I point out the screamingly obvious right here?

These are all reasons for 90% of US companies that borrow money and consume energy and commodities to increase earnings and to boost their share prices.

Only the 10% that derive revenues from ripping oil and commodities out of the ground should get hurt here.

Of course the market doesn?t know that. It is anything but rational when we hit big triple digit declines. There was only one direction on, and that was OUT.

And that is where you make your money

Margin clerks rule supreme, squeezing every bit of leverage out of their clients they can find.

The Dow and (SPY) are already posting large negative numbers for 2016.

Of course, I saw all of this coming a mile off.

I have been banging drums, pulling fire alarms, shooting off flare guns, and otherwise warning readers that the technical situation for the market was terrible ever since I went 100% into cash in December.

When the breakdown appeared imminent, I shot out Trade Alerts to sell short the S&P 500 (SPY) in size as fast as I could write them. And I started buying outright (SPY) puts for the first time in ages.

As a result of these sudden tactical moves, my model-trading portfolio has been keeping its head above water all month, up 2%. The Dow Average is off by a nausea inducing -10.7% at today?s low.

Yes, yes! All the hard work and research is paying off!

Ignore my musings at your peril!

What is even more stunning is that these declines are occurring in the face of US macro economic numbers that are going from strength to strength. The blockbuster December nonfarm payroll report of 292,000 is the real writing on the wall.

Housing, which accounts for about one third of the US economy, has been on fire. I?m sorry, but if you can?t find a parking space at Target, there is no recession.

Another crucial leg of the US economy, auto manufacturing, has been in overdrive. Auto sales are at a record 18 million annual rate, and some summer production shut downs have been cancelled.

That is, everywhere except Volkswagen.

With two of the most important legs firing on all cylinders, it?s clearly not about the economy, stupid!

There certainly hasn?t been a geopolitical event to justify moves of this magnitude.

As far as I can tell, Hitler has not invaded Poland, nor have the Japanese attacked Pearl Harbor.

Sure, there is whining about China, which has the Shanghai Index approaching the 2,900 level once again, down 40% from the top.?

Which leads me to believe that all of this is nothing more than a temporary hiccup. A BIG Hofbrauhouse kind of hiccup, but a hiccup nonetheless.

In a zero interest rate world, stocks only have to fall back from a price earnings multiple of 18 to 15 to flush out a ton of buying, and they will have done just that when the (SPY) hits $174.

THAT IS MY LINE IN THE SAND.

If nothing else, corporate buybacks should reaccelerate here, which could reach $1 trillion in 2016. Some 75% companies exit their quiet period by February 5 and can resume buying.

That could signal an interim market bottom.

The great thing about this selloff is that the best quality companies have fallen the most. This has been a function of the heavy sovereign wealth fund selling the bridge oil deficits.

After all, when share prices are in free fall, you have to sell what you can, not what you want to. It is only human to realize profits rather than incur losses, so quality has been trashed.

I am therefore going to give you a list of ten of my favorite stocks to buy at the bottom, highlighting the sectors that will lead us into a yearend rally.

The themes here are home builders, consumer discretionary, autos, solar, old technology, and international. I?m sorry, but the entire interest sensitive sector is on hold for the rest of the year, thanks to likely Fed inaction.

Watch out, because when I sense that the market has burned itself out on the downside, the Trade Alerts are going to be coming hot and heavy.

You have been forewarned!

Read ?em and weep with joy!

10 Stocks to Buy at the Bottom

Lennar Homes (LEN)
Home Depot (HD)
Microsoft (MSFT)
General Electric (GE)
Tesla (TSLA)
Apple (AAPL)
First Solar (FSLR)
Palo Alto Networks (PANW)
Wisdom Tree Japan Hedged Equity (DXJ)
Wisdom Tree Europe Hedged Equity (HEDJ)

SSEC 1-20-16

INDU 1-20-16

USO 1-20-16

VIX 1-20-16

JNK 1-20-16

John ThomasFinally, All the Hard Work is Paying Off

https://www.madhedgefundtrader.com/wp-content/uploads/2015/07/John-Thomas5-e1437678792272.jpg 299 400 Mad Hedge Fund Trader https://madhedgefundtrader.com/wp-content/uploads/2019/05/cropped-mad-hedge-logo-transparent-192x192_f9578834168ba24df3eb53916a12c882.png Mad Hedge Fund Trader2016-01-21 01:06:152016-01-21 01:06:15Ten Stocks to Buy at the Bottom
Mad Hedge Fund Trader

The Game Changer for Solar

Diary, Newsletter, Research

With great fanfare, congress passed a blockbuster $1.8 trillion spending bill in December. President Obama hastily signed the bill into law the next day.

Barley noticed was a measure included in the bill, which extends the 30% investment tax credit for alternative energy investments by five more years, until the end of 2021.

Barely, that is, unless you owned solar stocks.

Since the intention to include this pet democratic program started leaking out in November, shares of the entire industry doubled in value.

Solar City (SCTY) rocketed by 136%. First Solar (FSLR) soared by 81%. Even the normally quiescent Guggenheim Solar ETF (TAN) gained an impressive 28%.

Since then, these shares have given up a big chunk of their gains, thanks to the ongoing stock market correction. Better look hard at this group. They could become one of the top performers this year.

In exchange for the solar extension, the president agreed to permit oil exports for the first time in 40 years. The fact that the country has run out of storage and already has 50 filled takers sitting offshore in the Gulf of Mexico makes this an easy move.

House Minority leader, Nancy Pelosi, my local congressperson, told me the republicans were willing to ?Give away the store? to get the export measure through.

It seems that the Koch Brothers, the republican party?s largest donors and funders of global warming deniers, wanted to use the oil export measure as the means to offshore the entire US petrochemical industry.

It is headed for emerging nations, where labor is cheaper, taxes are lower, and regulation nil. That means the loss of tens of thousands of US jobs, many in California, over which Pelosi complained.

Pelosi complaining about the loss of petrochemical jobs? It?s proof that if you live long enough, you see everything.

Whatever jobs the Golden State loses here, it will make back with solar, big time. Industry analysts estimate that the five-year extension is worth a STAGGERING $125 BILLION IN ADDITIONAL SALES!

That is a multiple of the entire solar industry?s current total annual sales.

What?s more, this is five years during which the solar industry can dramatically improve panel output efficiencies, inverters, designs, and cut costs (remember that the cost of labor and regulation, about half the cost of a solar installation, is still rising).

Solar is already close to grid parity on costs now. It is even competitive in Texas. It will be substantially cheaper in five years.

During the same time, the cost of grid power will keep rising continuously, thanks to rising capital cost of replacing aging infrastructure.

I?m not saying you should rush out and buy solar today. But when the bull market resumes later this year, this group should be at the top of your list.

As for me, I am already getting estimates for a doubling of my existing solar roof system to accommodate the charging of my second Tesla, the Model X.

To learn all the ins and outs of buying and installing a solar roof system for you self, please read ?How to Buy a Solar System? by clicking here.

SCTY 1-15-16

FSLR 1-15-16

TAN 1-15-16

WTIC 1-14-16

Solar Panel Installation 2Better Bring Some More Panels

John Thomas Solar Panal

https://www.madhedgefundtrader.com/wp-content/uploads/2015/10/John-Thomas-Solar-Panal-e1444422199491.jpg 296 400 Mad Hedge Fund Trader https://madhedgefundtrader.com/wp-content/uploads/2019/05/cropped-mad-hedge-logo-transparent-192x192_f9578834168ba24df3eb53916a12c882.png Mad Hedge Fund Trader2016-01-19 01:08:582016-01-19 01:08:58The Game Changer for Solar
Mad Hedge Fund Trader

Volatility Here is Peaking

Diary, Newsletter, Research

It is often said that the stock market has discounted 12 out of the last four recessions.

While the market is discounting another recession now, I believe it is one of the many previously forecast that will never happen, a lot like to 18% swoon in the futures markets we saw last summer.

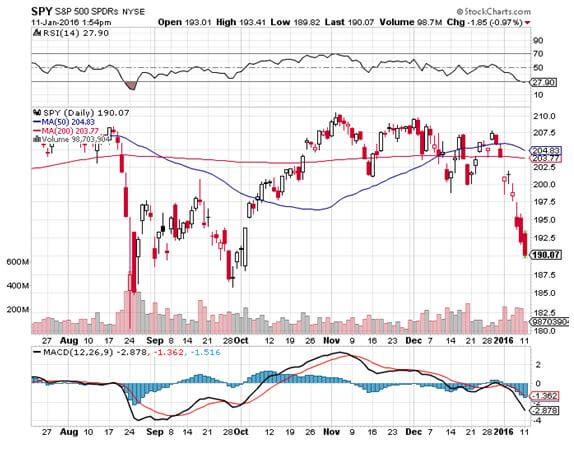
If anything, the reported hard data are showing that the economy is strengthening now, not weakening. The December nonfarm payroll hit a one-year high at 292,000. Christmas sales were off the charts for online merchants.

Auto production topped an 18 million rate. And this is an industry that was bankrupt only seven years ago.

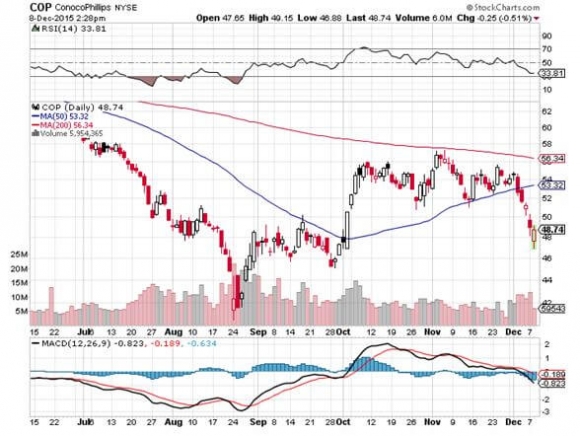
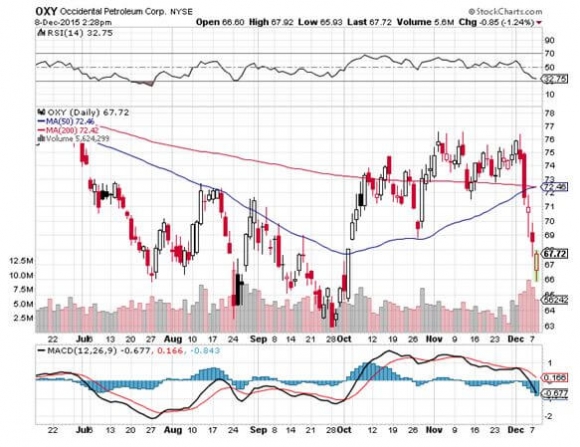
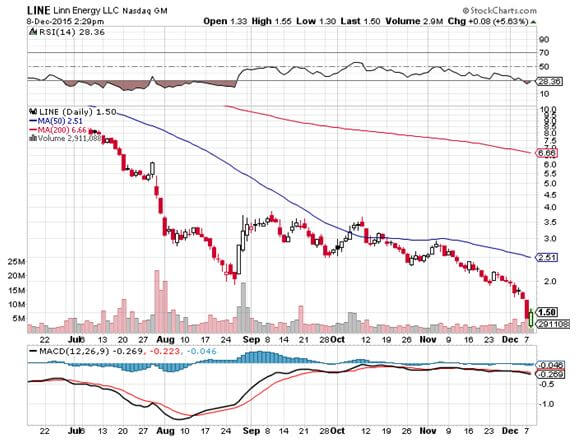
But what else would you expect from a global economy that just has a $2 trillion annual tax cut dumped in its lap, thanks to lower energy prices.

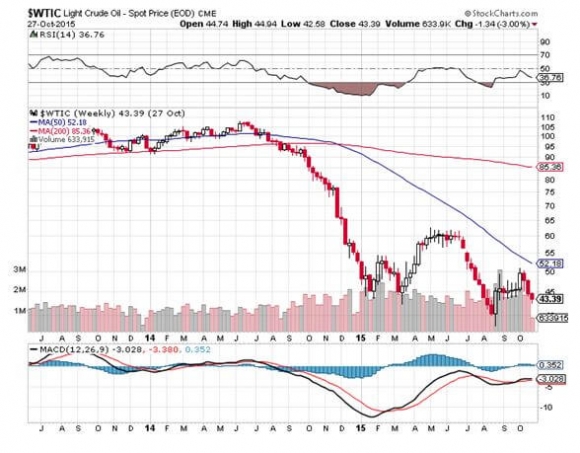
I therefore think we are within days of the final capitulation of this move. That means the Volatility Index (VIX) will peak as well, probably around $30, the top that defined the top of every spike for all of 2015, except for the August 24 flash crash day. That apex is probably only days away.

I am one of those cheapskates who buys Christmas ornaments by the bucket load from Costco in January for ten cents on the dollar, because my eleven month theoretical return on capital comes close to 1,000%.

I also like buying flood insurance in the middle of the summer when the forecast here in California is for endless days of sunshine.

That is what we are facing now with the volatility index (VIX) where premiums have just doubled, from $15 to near $30. Get this one right, and the profits you can realize are spectacular.

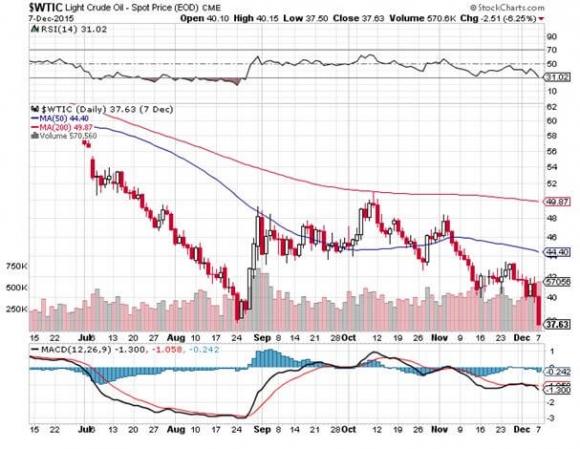
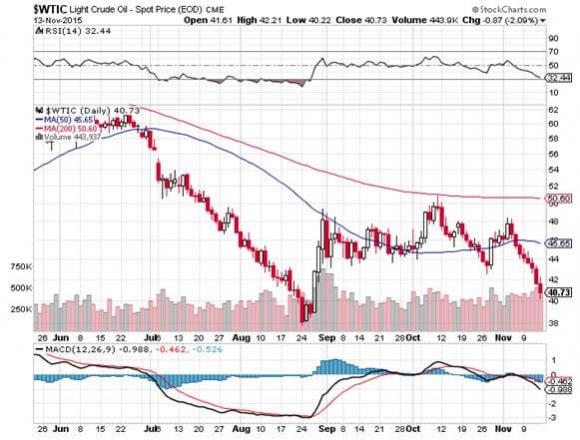
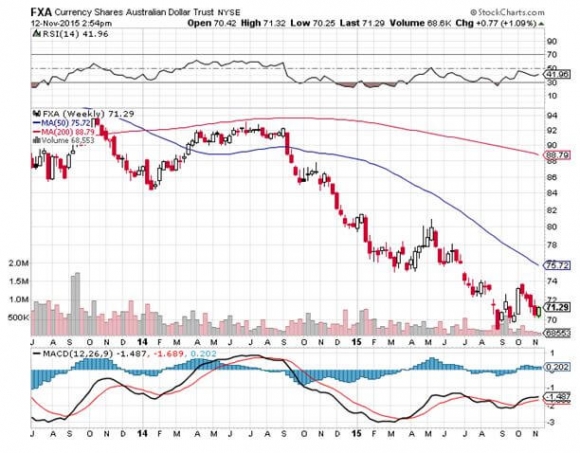
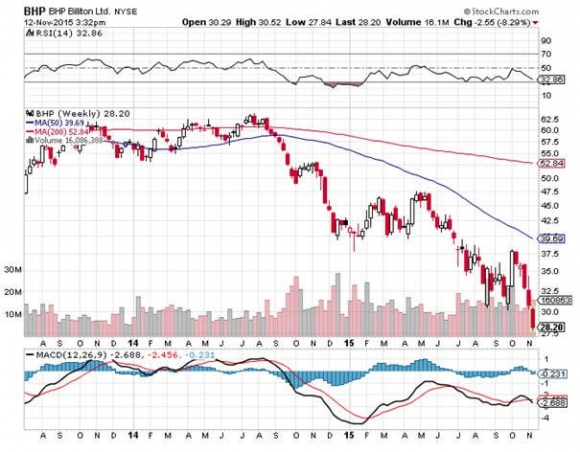
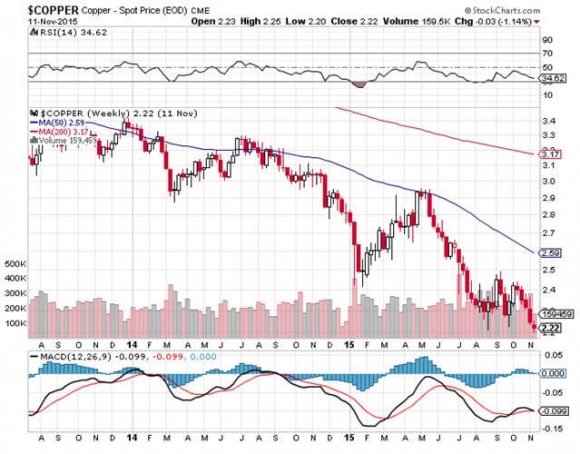
Watch carefully for other confirming trends to affirm this trade is unfolding. Those would include a strong dollar, collapsing stocks, and oil in free fall, and a weak Japanese yen, Euro.

I don?t know about you, but I am seeing seven out of seven cross asset confirming price action.

The CBOE Volatility Index (VIX) is a measure of the implied volatility of the S&P 500 stock index, which has been rallying hard since oil began its precipitous slide three weeks ago.

You may know of this from the many clueless talking heads, beginners, and newbies who call this the ?Fear Index?. Long-term followers of my Trade Alert Service profited handsomely after I urged them to sell short this index three years ago with the heady altitude of 47%.

For those of you who have a PhD in higher mathematics from MIT, the (VIX) is simply a weighted blend of prices for a range of options on the S&P 500 index. The formula uses a kernel-smoothed estimator that takes as inputs the current market prices for all out-of-the-money calls and puts for the front month and second month expiration's.

The (VIX) is the square root of the par variance swap rate for a 30 day term initiated today. To get into the pricing of the individual options, please go look up your handy dandy and ever useful Black-Scholes equation. You will recall that this is the equation that derives from the Brownian motion of heat transference in metals. Got all that?

For the rest of you who do not possess a PhD in higher mathematics from MIT, and maybe scored a 450 on your math SAT test, or who don?t know what an SAT test is, this is what you need to know. When the market goes up, the (VIX) goes down. When the market goes down, the (VIX) goes up. End of story. Class dismissed.

The (VIX) is expressed in terms of the annualized movement in the S&P 500, which today is at 1,800. So a (VIX) of $14 means that the market expects the index to move 4.0%, or 72 S&P 500 points, over the next 30 days.

You get this by calculating $14/3.46 = 4.0%, where the square root of 12 months is 3.46. The volatility index doesn?t really care which way the stock index moves. If the S&P 500 moves more than the projected 4.0%, you make a profit on your long (VIX) positions.

Probability statistics suggest that there is a 68% chance (one standard deviation) that the next monthly market move will stay within the 4.0% range. I am going into this detail because I always get a million questions whenever I raise this subject with volatility-deprived investors.

It gets better. Futures contracts began trading on the (VIX) in 2004, and options on the futures since 2006. Since then, these instruments have provided a vital means through which hedge funds control risk in their portfolios, thus providing the ?hedge? in hedge fund.

But wait, there?s more. Now, erase the blackboard and start all over. Why should you care? If you sell short the (VIX) here at $24, you are picking up a derivative at a nice overbought level. Only prolonged, ?buy and hold? bull markets see volatility stay under $14 for any appreciable amount of time. That?s probably what we have now.

If you are a trader you can sell short the (VIX) futures somewhere over $20 and expect an easy profit sometime in the coming weeks. If we get another 5% rally somewhere along that way, that would do it.

If you don?t want to sell the (VIX) futures or options outright, then you can always sell short the iPath S&P 500 VIX Short Term Futures ETN (VXX). Better yet, you can buy a short (VIX) ETN outright, the Velocity Shares Daily Inverse VIX Short Term ETN (XIV).

If you make money on this trade, it will offset losses on other long positions.

No one who buys fire insurance ever complains when their house doesn?t burn down.

VIX 1-11-15

VXX 1-11-16

1-11-16

Tiger hugs ManVolatility Can Be Your Friend

https://www.madhedgefundtrader.com/wp-content/uploads/2014/12/Tiger-hugs-Man-e1452549843482.jpg 400 262 Mad Hedge Fund Trader https://madhedgefundtrader.com/wp-content/uploads/2019/05/cropped-mad-hedge-logo-transparent-192x192_f9578834168ba24df3eb53916a12c882.png Mad Hedge Fund Trader2016-01-12 01:06:382016-01-12 01:06:38Volatility Here is Peaking
Mad Hedge Fund Trader

Here Comes the Final Bottom in Oil

Diary, Newsletter, Research

I had a fascinating dinner last week at Morton?s, San Francisco?s best steak restaurant, with one of John Hamm?s original investors.

You remember John, the legendary Texas oilman who saw fracking coming a mile off and made billions?

Since some of what my friend had to say came true in a matter of days, I thought I?d pass on the essence of our conversation.

The oil storage facility at Cushing, Oklahoma is full, at 480 million barrels. The US Strategic Petroleum Reserve has been full for a long time, with 713 million barrels (36 days of US consumption).

Contangos are exploding. It might as well be the end of the world for the oil industry.

The oil Armageddon is here, and the final flush is upon us.

There is a 50% chance we will bottom at $32/barrel, and another 50% chance that we go all the way down to $20. If we go down to $20, the last three ticks of the move will be $22?.$20?.$22. Then a saw tooth bottom will unfold between $24 and $32 which will last for several months.

There will be many chances to buy this bottom. There isn?t going to be a ?V? shaped bottom in oil this time, like we saw in past energy crashes.

The margin clerks and risk control managers are in control now, so we may see the final low sooner than you think. But it could be some time before we break $40 again to the upside and hold it.

The industry was really drinking the Kool-Aid with both hands to get it this wrong. Ultra low interest rates drove in billions in capital from first time oil investors looking to beat zero interest rates. They also saw China continuing an endless economic boom forever, and the energy demand that went with it.

In the end, they got both the supply and demand sides of the equation completely wrong on a global scale, always a recipe for disaster.

Many of the fields drilled in places like North Dakota would never have been touched during normal times. Then Saudi Arabia came out of left field with a grab for global market share that has yet to play out.

The seeds of this recovery are already evident. Chinese auto sales are up 19% YOY. China is buying all the cheap oil it can to fill up its own strategic oil reserve. Miles driven in the US are already up 4.6% YOY, which is a huge gain.

All of this will contribute to a higher US GDP in 2016.

Once we put in a final bottom in oil, don?t expect $100 a barrel any time soon. The ma and pa investor in the oil patch will not be back in this generation.

Marginal sources, like high cost Canadian tar sands, deep offshore, and some in North Dakota aren?t coming back either. These supplies needed $100/barrel just to break even.

Personally, my friend does not see oil topping $80/barrel this decade. He see?s a $62-$80 trading range persisting for a long time.

As the US has become more energy independent, the geopolitical factors have mattered less and less. That is why oil moved only $1 on an ISIS victory, the Paris attacks, or some other disaster.

To call the bottom in oil, watch the shares of ExxonMobil (XOM), Conoco Phillips (COP), and Occidental Petroleum (OXY). When they revisit their August lows, down 5%-10% down from here, that will be a great time to jump back into the oil space.

None of these companies are going under, and the dividend payouts are now enormous, (XOM) at (3.7%), (COP) at (5.8%), and (OXY) at (4.2%).

Distressed debt is where the smart money is focusing now, where double-digit returns have become common. If the issuer goes bankrupt the equity owners get wiped out while the bondholders get the company for pennies on the dollar.

Energy companies and master limited partnerships (MLP?s) have far and away been the biggest borrowers in the high yield market in recent years.

There is a junk maturity cliff looming, with $145 billion in bonds due for refinancing from 2017-2021. Expect the default ratio to rocket from this year?s 2.8% to 25%. A 12% default rate is a normal peak in a recession.

Individual company research now has a bigger payoff than in any time in history, even the 2008-09 crash.

Small leveraged companies with exposure to the price of oil are toast.

The play is for the toll takers, master limited partnerships that profit from the volume of oil pumped, and not the price of oil. Over time, volumes will increase, and so will the profits at these MLP?s.

In the meantime, everything is getting thrown out with the bathwater, regardless of fundamentals. People just don?t want to be near the space, especially going into yearend book closing.

Nobody wants to be seen as the idiot who owned oil in 2015.

Linn Energy (LINE) is a perfect example of this. It suspended its dividend so it could buy more assets on the cheap. It has plenty of cash, and will be backstopped by Blackrock with additional credit lines, if necessary.

While this raises volatility for the short term, it increases returns over the long term. It?s definitely your ?E? ticket ride.

I pointed out that President Obama did the oil industry the biggest favor in history by dragging his feet on the Keystone Pipeline, and then ultimately killing it. It prevented US consumers from loading the boat with $100/barrel tar sands crude at the top of the market.

My friend conceded that it is unlikely the pipeline would ever be built. The market has moved away.

I have accumulated a variety of odd tastes in my half-century of traveling around the world.

So when I heard we were eating at Morton?s, I brought my own jar of Coleman?s hot English mustard. It makes a medium rare cooked filet mignon taste perfect, but my action always puzzles the waiters. They never have it.

John Hamm gained public notoriety last year when he wrote a $974 million divorce settlement check to is ex wife and she refused to cash the check. I asked if the check ever got cashed?

?She cashed the check,? he said.

Needless to say, my friend picked up the check for the dinner as well. I let him drive my Tesla Model S-1 back to his hotel.

WTIC 12-7-15

XOM 12-7-15

COP 12-8-15

OXY 12-8-15

LINE 12-8-15

Hamm Check

Tesla

https://www.madhedgefundtrader.com/wp-content/uploads/2015/12/Hamm-Check-e1449609624300.jpg 299 400 Mad Hedge Fund Trader https://madhedgefundtrader.com/wp-content/uploads/2019/05/cropped-mad-hedge-logo-transparent-192x192_f9578834168ba24df3eb53916a12c882.png Mad Hedge Fund Trader2015-12-09 01:07:212015-12-09 01:07:21Here Comes the Final Bottom in Oil
Mad Hedge Fund Trader

Saudi Arabia?s Secret Plan for Global Prosperity

Diary, Newsletter, Research

Friends of mine at my former employer, the Financial Times, have met with the senior Saudi leadership in recent weeks and confirmed what I already knew.

The implications for your trading account and retirements funds are nothing less than far reaching.

The Kingdom?s long-term strategic goal is to create a global economic boom.

If they are successful, the value of all assets sensitive to the business cycle will explode in value. Those include stocks, commodities real estate, precious metals, and commodities. Only bonds, and other fixed income investments will suffer.

Saudi financial planners are betting that such a comeback is only one to two years off.

They will accomplish this by creating a world wide economic recovery that will eventually take the price of oil back up to at least $70-$80 a barrel, close to the price they need to maintain the world?s most generous social service system and balance their budget.

But to get there, they have to keep the price lower for longer.

So far, so good.

Since Saudi Arabia began its war for market share 18 months ago, $40 West Texas Intermediate is 63% off its 2014 high, and 74% down from the 2011 all time high.

At today?s prices, the global tax cut amounts to $2.24 trillion a year ($67/barrel saved X 92 million barrels/day global consumption X 365 days).

Saudi Arabia can easily add 1%-2% to global growth simply by keeping oil prices at the present level.

They can do this because they have oil reserves far beyond the understanding of all but a few industry experts.

I have traveled in the Middle East for 48 years.

I covered the neighborhood wars for The Economist magazine during the 1970?s.

When representing Morgan Stanley in the firm?s dealings with the Saudi royal family in the 1980?s, I paused to stick my finger in the crack in the Riyadh city gate left by a spear thrown by King Abdul Aziz al Saud when he captured the city in the 1920?s, creating modern Saudi Arabia.

The only mistake I made in my Texas fracking investments is that I sold out too soon in 2005, when natural gas traded from $2 a BTU to $5, and missed the spike to $17.

So let me tell you about the price of oil.

I?ll make it easy, and distill everything down to one single fact.

Saudi Arabia?s entire production of 11.5 million barrels a day, 14% of the world?s total, comes from 11 major fields.

THEY HAVE 70 OTHER SUCH FIELDS, which have yet to be surveyed and drilled. We know they are there because the geology is identical and the ultrasound data pans out.

So if Saudi Arabia wants to increase production to the point where every other producer in the world goes broke, THEY HAVE THE RESOURCES TO DO SO FOR ANOTHER CENTURY!

Saudi Arabia is not undergoing their current aggressive strategy without any pain. They are currently running an unprecedented 20% budget deficit (compared to America?s 12% in red ink).

For the first time, they have also emerged as massive borrowers in the international debt markets to bridge the funding gap.

But don?t expect the Saudis to change their posture one iota at the upcoming December 4 OPEC meeting in Vienna. They clearly see the present low price strategy as in their own best interest.

In my many dealings with the Saudis I have learned one thing.

They are playing the long game, the very long game. They obviously believe that global oil consumption will be greater over the next decade by keeping prices lower for longer, now.

And if every producer in the Bakken shale, the Marcellus shale, the Eagleford shale, and the Monterrey shale goes bankrupt first, that?s fine too.

It?s all about maximizing long-term market share.

Saudis have grown weary of being the free de facto put option for the world?s high cost producers, like American shale, Canadian tar sands, the Arctic, and offshore anywhere.

There has long been a belief that if oil prices fell below $100 for any period of time, the Saudis would simply throttle back their production and bump it back up.

Those days are long gone.

I have another theory about what?s going on.

If alternative energy sources maintain their current rate of expansion, oil will be rendered worthless by 2035.

For example, California has mandated that 50% of its energy will come from alternatives within 15 years. Many other states and countries will follow.

Therefore, it?s in the Kingdom?s interest to shift as much of their inventory before prices collapse to their production cost of $5/barrel.

If they can accomplish this faster than their oil producing, hostile competitors in the Middle East and Russia, so much the better.

You may say this all sounds like pie in the sky stuff.

But I happen to know that the Saudis are massive investors throughout the entire alternative energy venture capital spectrum, including solar, wind, ocean waves, geothermal, and even biodiesel (which I don?t believe in for two seconds).

They are NOT doing this because they need new energy sources for themselves.

The irony here is that if the Saudi plan is successful, it will add another 2-3 years to the Great American bull market that is now entering its sixth year.

The Saudis are also one of the biggest foreign Investors in US shares. It?s in their own self-interest to keep prices rising.

You have more in common with the Saudi royal family than you think.

WTIC 11-13-15

Oil FieldHow Much Did You Say You Wanted?

https://www.madhedgefundtrader.com/wp-content/uploads/2015/11/Oil-Field-e1447682600875.jpg 248 400 Mad Hedge Fund Trader https://madhedgefundtrader.com/wp-content/uploads/2019/05/cropped-mad-hedge-logo-transparent-192x192_f9578834168ba24df3eb53916a12c882.png Mad Hedge Fund Trader2015-11-16 01:07:522015-11-16 01:07:52Saudi Arabia?s Secret Plan for Global Prosperity
Mad Hedge Fund Trader

Woe the Australian Dollar!

Diary, Newsletter, Research

If I warned them once, I warned them 1,000 times!

The Australian dollar (FXA) is going to fall.

That?s why I cautioned my Aussie friends to sell their homes, get the money the hell out of the country, and pay for their overseas vacations in advance.

As long as it is a de facto colony of China, the fortunes of the Land Down Under are completely tied to economic prospects there.

It is almost a waste of time looking at the Reserve Bank of Australia?s data releases. They have become a deep lagging, and really irrelevant indicators. You are better off going to the source, and that is in Beijing.

And therein lies the problem.

It is highly unlikely that the government in China has any idea what their economy is actually doing. Sure, they pump out the usual figures on a reliable basis like clockwork. These are educated guesses, at best.

Even in a perfect world, collecting numbers from 1.3 billion participants is a hopeless task. The US is unable to do these with any real accuracy, and we have one quarter of their population and vastly superior technology.

For what it is worth, Chinese President Xi Jinping has promised that his country?s GDP growth will not fall below a 6.5% annual rate for the next five years. At this pace, China is still creating more economic activity that any other country in the world.

Which leaves us nothing else to rely on but commodity prices to look at, far an away Australia?s largest earner. These are suggesting that the worst has yet to come.

Virtually the entire asset class hit new six year lows yesterday. I had to go to the weekly charts to see how ugly things really are.

Australia?s largest exports are iron ore (26%, or $68.2 billion worth), coal (KOL) (16%), gold (GLD) (8.1%), and petroleum (USO) (5.7%). When the world?s largest consumer of these slows down, so does demand for these commodities.

BHP Billiton Ltd. (BHP), the largest producer of iron ore, has seen its shares plunge 57% from last year?s high.

But wait! It gets worse.

I have written at length about the transition of China from an industrial to a services based economy. You would expect this, as the Middle Kingdom has virtually no commodity resources of its own, but lots of smart people.

In a nutshell, they wish they had America?s economy. Where services now account for a staggering 68% of all economic activity.

This is why China?s future lies with Alibaba (BABA), Baidu (BIDU), and JD.com (JD). It does NOT lie with its steel factories and coalmines, which by the way, recently announced layoffs of 100,000, the largest in history.

To learn more about the structural remaking of China, please click here for ?End of the Commodities Super Cycle?.

There is one bright spot to mention. Australia is making a transition to a services based economy of its own. Tourism is rocketing, as is the influx of flight capital from the Middle Kingdom.

Walk the streets of Brisbane these days, and you are overwhelmed by the abundance of Asians coming here to learn English, attain a high education, or start a new business. When I came here 40 years ago, they were virtually absent.

How low is low?

It doesn?t help that the governor of the Reserve Bank of Australia, Australia?s central bank, Glenn Stevens, despises his nation?s currency.

He has used every rally this year to talk down the Aussie, threatening interest rate cuts and quantitative easing.

The hope is that a deep discount currency will allow the exporters to maintain some pricing edge on the commodities front.

The market chatter is that the Aussie will take a run as low as $0.55, the 2008-09 Great Recession low.

Whether we actually get that far or not is a coin toss.

And will even $0.55 below enough for Glenn Stevens?

FXA 11-12-15

BHP 11-12-15

COPPER 11-11-15

GOLD 11-11-15

Australian Energie Ressources

Glenn StevensNoted Aussie Dollar Hater

https://www.madhedgefundtrader.com/wp-content/uploads/2015/11/Glenn-Stevens-e1447366356714.jpg 226 400 Mad Hedge Fund Trader https://madhedgefundtrader.com/wp-content/uploads/2019/05/cropped-mad-hedge-logo-transparent-192x192_f9578834168ba24df3eb53916a12c882.png Mad Hedge Fund Trader2015-11-13 01:08:222015-11-13 01:08:22Woe the Australian Dollar!
Mad Hedge Fund Trader

Bank of America is Breaking Out All Over

Diary, Newsletter, Research

In view of the blockbuster October nonfarm payroll report, and the collapse of the bond market that followed, it is time to take a cold, steely eyed look, and the financials, especially Bank of America (BAC).

What did the stock do? It rocketed by 6.5%, along with the rest of the market, hitting four month high of $18.09. I hate it when that happens, being right on the fundamentals, and wrong on the market timing.

You are getting the reaction that the bang up Q3 earnings report should have delivered, just one week late. The shares appear to be taking a run at a new multi year high.

It was a stellar report, with earnings beating expectations handily on both the top and the bottom lines. Expenses are in free-fall, and the company?s cost of funds is plummeting, as lower cost deposit surge.

Analysts were blown away when they saw after tax profits come in at $4.5 billion, producing a diluted earnings per share of $0.37. The company returned a staggering $3 billion to shareholders in the form of dividends and an aggressive share buy back program.

Every major business segment showed big year on year improvements, including consumer and business banking. Global wealth and investment management knocked the cover off the ball.

The sudden burst of market volatility gave a nice push in income to the global banking division.

Deposits from mobile banking jumped. Average deposits are up 4%. Subterranean interest rates kept income there flat.

Given the bank?s tremendous upside leverage, many analysts are now pegging the stock with a $30 handle.

There is another play here. (BAC) is highly geared to raising interest rates, which will enable them to lend money out at higher interest rates, increasing their spread. Think of it as long dated put option on the iShares Barclays 20+ Treasury Bond ETF (TLT).

That is not a bad position to have on board, given that we probably put in a multigenerational spike in bond prices last week.

Because of the bank?s long and well-publicized problems with regulators dating back to before the 2008 financial crisis, (BAC) became toxic waste for many portfolio mangers.

The end result of that has been to make the best-run banks in the industry also the cheapest.

I have a feeling that I will be visiting the trough here often, and generously.

BAC 11-6-15

C 11-6-15

XLF 11-6-15

Bank of America - ATMTime to Visit the ATM Again

0 0 Mad Hedge Fund Trader https://madhedgefundtrader.com/wp-content/uploads/2019/05/cropped-mad-hedge-logo-transparent-192x192_f9578834168ba24df3eb53916a12c882.png Mad Hedge Fund Trader2015-11-09 01:07:342015-11-09 01:07:34Bank of America is Breaking Out All Over
Mad Hedge Fund Trader

Keep American Express on Your Short List

Diary, Newsletter, Research

I remember that the highlight of my 1968 trip to Europe was always my visit to the nearest American Express (AXP) office to pick up my mail.

In those pre Internet and email days, it was the only way that a fresh faced 16 year old could stay in touch with a hand wringing family while traveling around the world.

They just wrote ?John Thomas, c/o American Express, Paris, France,? and the letters never failed to get through to me.

It was also a great place to meet other vagabonding Americans my age--of the female persuasion. At least they spoke English. Almost.

That was a very long time ago.

So I got to know well the American Express locations off the Spanish Steps in Rome, Saint Mark?s Square in Venice, Berlin?s Kurfurstendamm, and the Champs-Elysees in Paris.

I have a feeling that American Express is about to give me a warm and fuzzy feeling once again.

After being taken out to the woodshed and getting beaten senseless in the wake of getting fired by Costco, one of the biggest customers, the shares appear poised for a comeback.

We have a rare occasion where the highest quality stock in a sector with the best business model is selling cheaper than its cohorts for a series of temporary reasons.

Take a look at the charts for (AXP) and Visa (V) below, and one of the greatest pairs trades of all time may be setting up, whereby you want to buy for the former and sell short the latter against it.

At the very least, you should be taking your monster profits on Visa and rolling the money into American Express.

Since its inception in 1958, that flashy green (or platinum) piece of plastic has long been a status symbol, and owned the premium end of the credit card market.

As a result, it earns more fees and extends fewer loans than its competitors. The loans it does have enjoy a far lower default rate. There are now 107 million Amex cards in circulation, compared to only 55 million in 2001. Thank you 1%!

American Express cardholders run balances three times larger than the average Master Card holder. That?s what happens when you buy a Ferrari on your Amex card, as I once did (to get the frequent flier points).

Merchants pay very high fees, usually 5% of the purchase. That?s why many shun the card. (AXP) is currently running a credit card balance of $940 billion, versus $3.1 trillion for Visa (V).

Fees accounted for an impressive 57% of the company?s revenues, a far higher ratio than other credit card companies. Better yet, (AXP)?s fees are rising, while those of others are falling. Interest on balances brings in 15% and cardholder fees 8%.

(AXP) is expected to earn $5.8 billion in net income on $33.9 billion in revenues this year, up 9.4%. With the US economy recovering, growing by 2.6% this year and 3.0% plus in 2015, the company is in the sweet spot for capturing more profits.

Morgan Stanley estimates that cardholder spending grows at 4.5 times the US GDP growth rate. That should cause (AXP)?s earnings to double, and the stock as well. An extra tailwind will be the company?s new strategy of moving down market to expand market share.

Despite all this good news, (AXP) shares are selling at a 13.4X multiple, a discount to its industry (21X), and the main market (18X). An ambitious share buy back program should put a floor under the stock.

Part of the discount can be explained by a Justice Department suit claiming that the company overcharges merchants. Amex correctly argues that, as the smallest of the major credit card companies, it has nowhere near monopoly pricing power.

It will be interesting to see how aggressively the government pursues its action, now that attorney general Eric Holder, has moved on to retirement.

You all know by now that I think financials are the place to be for years going forward because of imminently rising interest rates. But I?ll hold back on pulling the trigger on single name long side stocks plays until the carnage in the markets abate.

When I?m ready to shoot out a Trade Alert, you?ll be the first to know.

When I do, don't even think about putting it on your credit card.

AXP 11-4-15

V 11-4-15

John Thomas-16 yrs oldJust Stopping By to Pick Up the Mail

https://www.madhedgefundtrader.com/wp-content/uploads/2014/10/John-Thomas-16-yrs-old.jpg 349 348 Mad Hedge Fund Trader https://madhedgefundtrader.com/wp-content/uploads/2019/05/cropped-mad-hedge-logo-transparent-192x192_f9578834168ba24df3eb53916a12c882.png Mad Hedge Fund Trader2015-11-05 01:06:302015-11-05 01:06:30Keep American Express on Your Short List
Page 33 of 43«‹3132333435›»

Legal Disclaimer

There is a very high degree of risk involved in trading. Past results are not indicative of future returns. MadHedgeFundTrader.com and all individuals affiliated with this site assume no responsibilities for your trading and investment results. The indicators, strategies, columns, articles and all other features are for educational purposes only and should not be construed as investment advice. Information for futures trading observations are obtained from sources believed to be reliable, but we do not warrant its completeness or accuracy, or warrant any results from the use of the information. Your use of the trading observations is entirely at your own risk and it is your sole responsibility to evaluate the accuracy, completeness and usefulness of the information. You must assess the risk of any trade with your broker and make your own independent decisions regarding any securities mentioned herein. Affiliates of MadHedgeFundTrader.com may have a position or effect transactions in the securities described herein (or options thereon) and/or otherwise employ trading strategies that may be consistent or inconsistent with the provided strategies.

Copyright © 2025. Mad Hedge Fund Trader. All Rights Reserved. support@madhedgefundtrader.com
Scroll to top