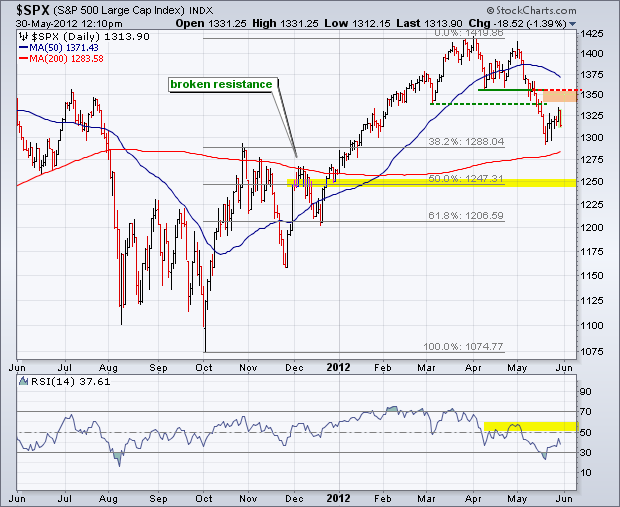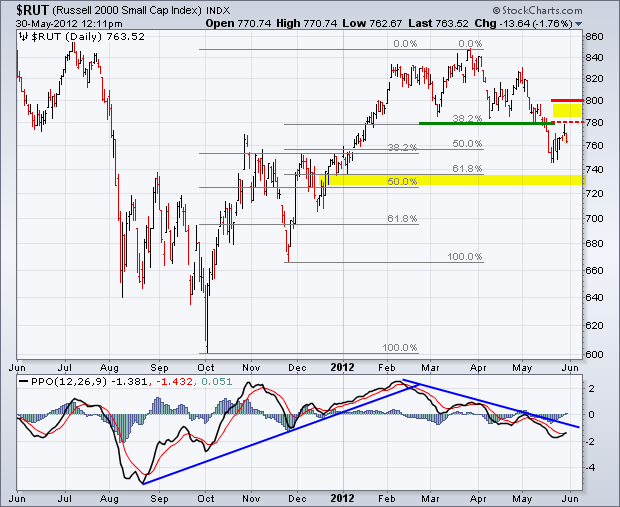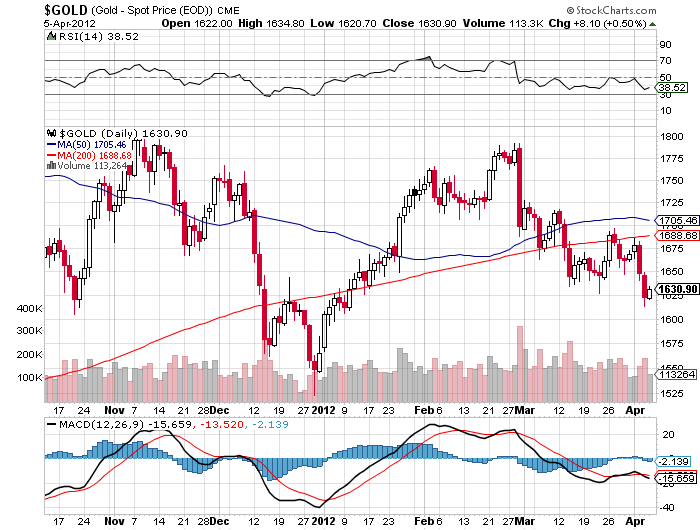
Since Ben Bernanke?s announcement of QE3 last week, new forecasts for gold have been popping up like acne at a high school prom. They range from the conservative to the absurd, from $1,900 to $55,000. But they all have one thing in common: higher. Before you head down to the local coin store to load up on bags of one ounce American gold eagles, let me go through the simplest of the many bull arguments.
The most positive interpretation of QE3 is that it will expand the Federal Reserve?s balance sheet from $2.7 trillion to $5 trillion over the next two years. This is up from only $800 billion in 2008. QE1&2 took the Fed balance sheet up by $2 trillion, but the money supply (M0) increased by only $300 billion. Where did the rest of the money go?
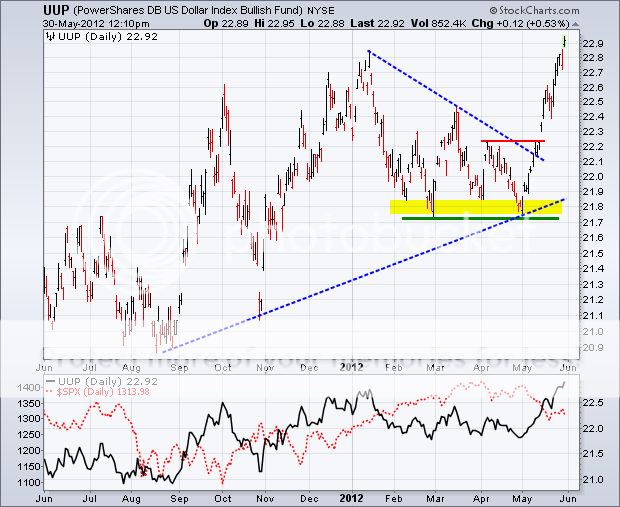
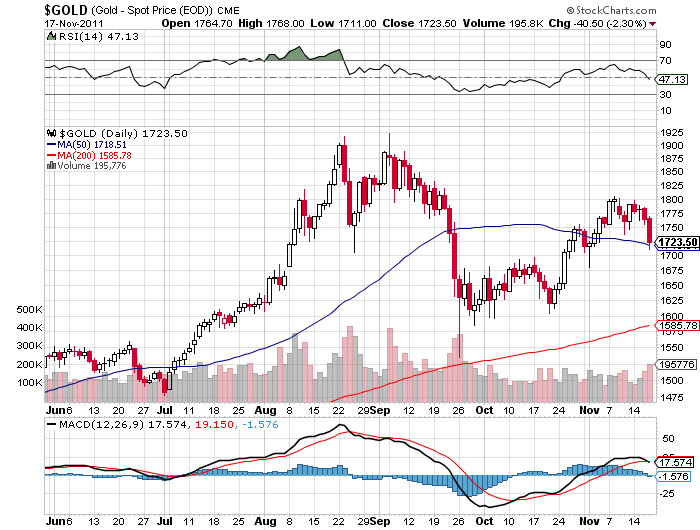
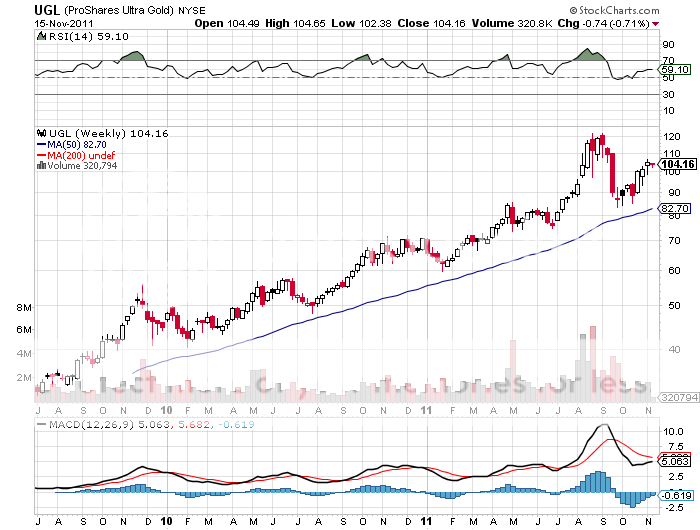
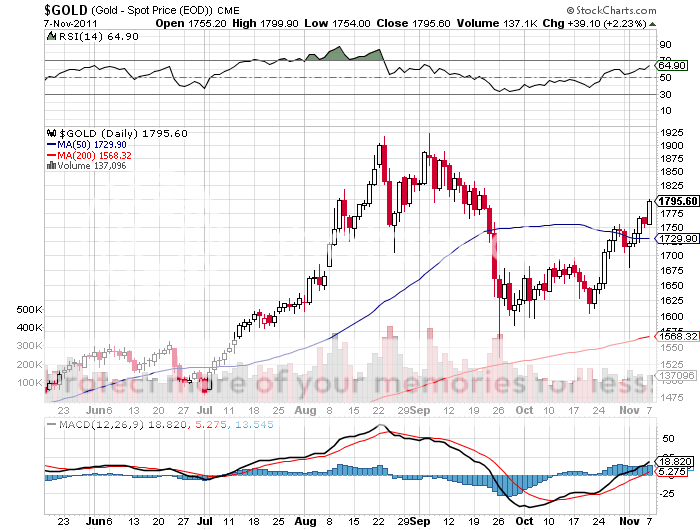
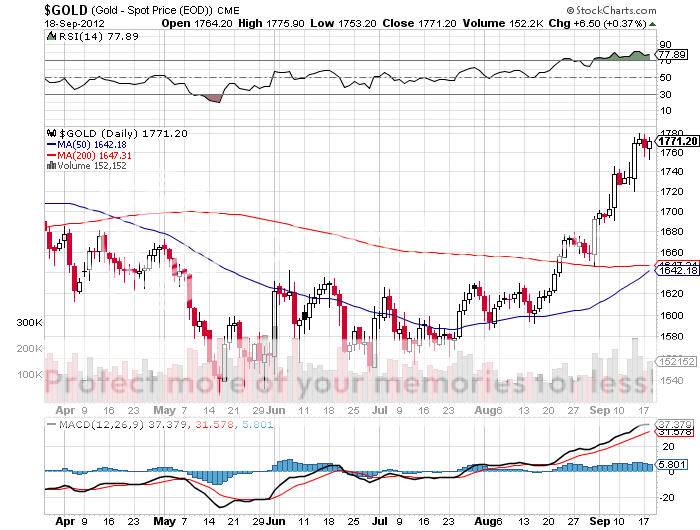
The answer is that it went into the reserves of private banks, where it still sits today. When these funds are released, everyone will rush out and buy stuff, and the inflationary implications will be awesome. This is bad news for the dollar. As gold is priced in dollars, it will be the first to feel the impact. Witness the 18% rise we have seen off of the July bottom.
How far does it have to run? The correlation between the price of gold and the broader money supply M1, a measure of the currency in circulation plus demand deposits or checking account balances at banks, is almost 1:1. In 2008, M1 doubled from $800 billion to $1.6 trillion, and so did the yellow metal, from $500 to $1,000. The Fed?s balance sheet is roughly equivalent to M1. So a near doubling of the balance sheet to $5 trillion should take gold up a similar amount. Using $1,720 as the base level before the Fed?s announcement, that takes the barbarous relic up to $3,440 over the next two years.
Spoiler alert! Gold tends to front run the growth of M1. So while we may see a disciplined straight-line rise in the Fed balance sheet as it diligently buys $40 billion a month in mortgage-backed securities, gold won?t be so patient. It could go parabolic at any time. My first target: the old inflation adjusted high of $2,300, which we could see some time in 2013.
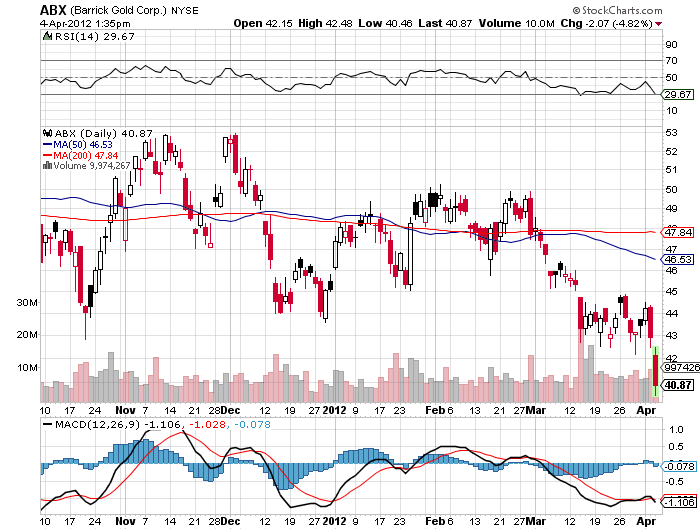
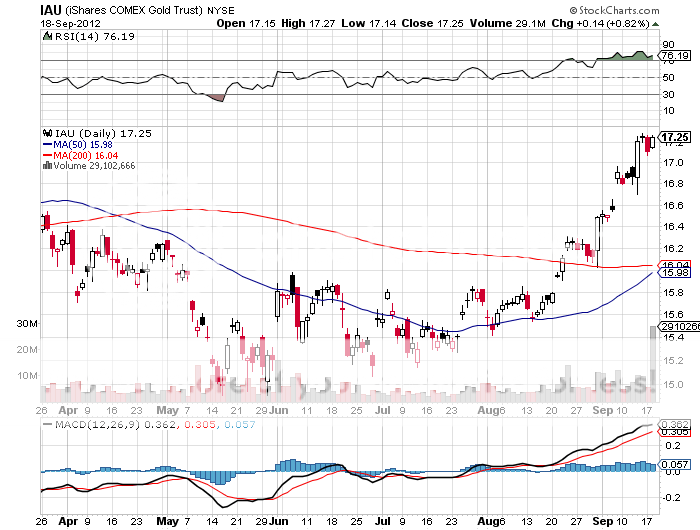
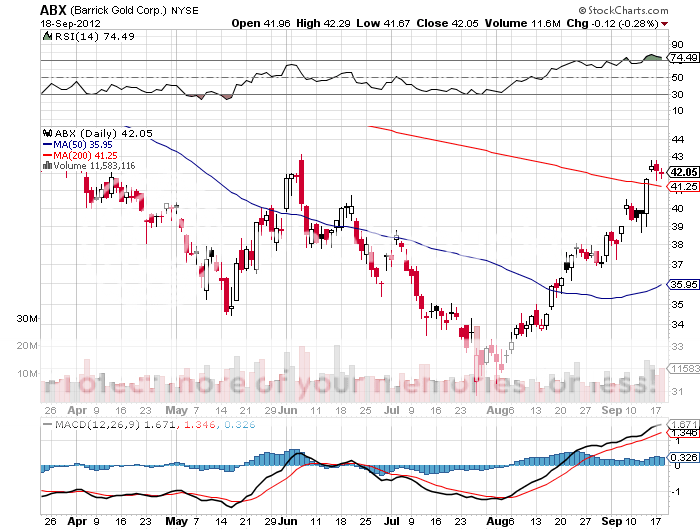
The instruments to entertain here are the gold ETF?s (GLD) and (IAU), gold miners like Barrick Gold (ABX), and the gold miners ETF (GDX). If you are hyper aggressive, you might look into 100 ounce gold futures contracts traded on the COMEX. They offer leverage of 19:1, with an initial margin requirement of $9,113. ?If my $3,440 target is achieved, the value of one contract would rocket to $166,800, an increase of 17,300%. But this is only for those who wish to play at the deep end of the pool and are authorized for futures trading.
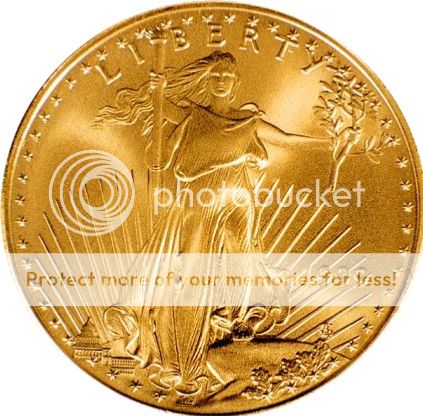
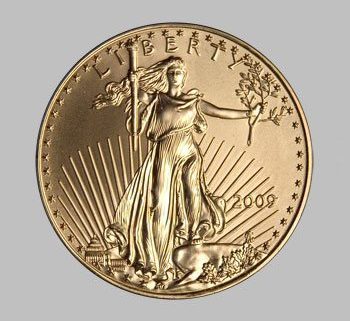
And then there are those one-ounce American gold eagles, now retailing for $2,300.
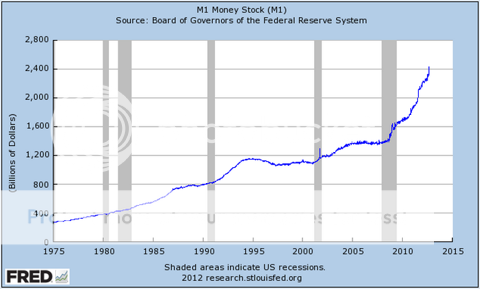
Growth of M1 to 2014
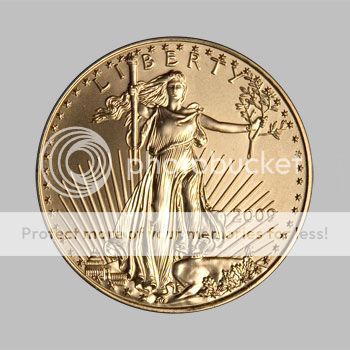
One Ounce American Gold Eagle