• support@madhedgefundtrader.com
  • Member Login
Mad Hedge Fund Trader
  • Home
  • About
  • Store
  • Luncheons
  • Testimonials
  • Contact Us
  • Click to open the search input field Click to open the search input field Search
  • Menu Menu

Tag Archive for: (RSP)

Mad Hedge Fund Trader

Why Technical Analysis Doesn?t Work

Diary, Newsletter

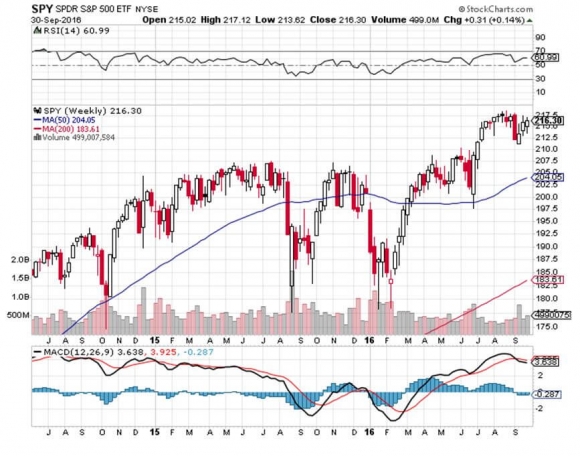
The S&P 500 has just bounced off the 214 level for the second time this month.

Is it safe to come out of your cave? Is to time to take the hard hat back to the basement?

If you had taken Cunard?s round-the-world cruise three months ago, as I recommended, you would be landing in New York about now, wondering what the big deal was. Indexes are unchanged since you departed.

This truly has been the Teflon market. Nothing will stick to it. In June when Brexit hit, many predicted the end of the world. The market crashed. Then within days, it recovered the loss and moved on to new all time highs..

Go figure.

It makes you want to throw up your hands in despair and throw your empty beer can at the TV. All this work, and I?ve delivered the perfectly wrong conclusions?

Let me point out a few harsh lessons learned from this most recent melt down, and the rip your face off rally that followed.

Remember all those market gurus poo pooing the effectiveness of the ?Sell in May and go away? strategy? This year it worked better than ever.

This is why almost every Trade Alert I shot out for the past five months has been from the short side. It is also why I was so quick to cover my most recent shorts for a loss.

We are about to move from a ?Sell in May? to a ?Buy in November? posture.

The next six months are ones of historical seasonal market strength (click here for the misty origins of this trend at ?If You Sell in May, What To Do in April??).? You must be logged into your account to read this article.

The other lesson learned this summer was the utter uselessness of technical analysis. Usually these guys are right only 50% of the time. This year, they missed the boat entirely.

When the S&P 500 (SPY) was meandering in a narrow nine point range, and the Volatility Index ($VIX) hugged the 12-15 neighborhood, they said this would continue for the rest of the year.

It didn?t.

When the market finally broke down in June, cutting through imaginary support levels like a hot knife through butter, they said the market would plunge to 175, and possibly as low as 158.

It didn?t do that either.

When the July rally started, pitiful technical analysts told you to sell into it.

If you did, you lost your shirt. The market just kept going, and going, and going like the Energizer Bunny.

This is why technical analysis is utterly useless as an investment strategy. How many hedge funds use a pure technical strategy?

Absolutely none, as it doesn?t make any money.

At best, it is just one of 100 tools you need to trade the market effectively. The shorter the time frame, the more accurate it becomes.

On an intraday basis, technical analysis is actually quite useful. But I doubt few of you engage in this hopeless pursuit.

This is why I advise portfolio managers and financial advisors to use technical analysis as a means of timing order executions and nothing more.

Most professionals agree with me.

Technical analysis derives from humans? preference for looking at pictures instead of engaging in abstract mental processes. A picture is worth 1,000 words and probably a lot more.

This is why technical analysis appeals to so many young people entering the market for the first time. Buy a book for $5 on Amazon, and you too can become a Master of the Universe.

Who can resist that?

The problem is that high frequency traders also bought that same book from Amazon a long time ago and have designed algorithms to frustrate every move the technical analyst makes.

Sorry to be a buzz kill, but that is my take on technical analysis.

Hope you enjoyed your cruise.

spy

John Thomas-breakfastCorrection? What Correction?

https://www.madhedgefundtrader.com/wp-content/uploads/2013/07/John-Thomas-breakfast.jpg 364 490 Mad Hedge Fund Trader https://madhedgefundtrader.com/wp-content/uploads/2019/05/cropped-mad-hedge-logo-transparent-192x192_f9578834168ba24df3eb53916a12c882.png Mad Hedge Fund Trader2016-10-03 01:06:162016-10-03 01:06:16Why Technical Analysis Doesn?t Work
Mad Hedge Fund Trader

The Unintended Consequences of the Euro Crash

Diary, Free Research, Newsletter

For those of you who heeded my expert advice to buy the ProShares Ultra Short Euro ETF (EUO) last July, well done!

You are up a massive 48%! This is on a move in the underlying European currency of only 18.5%.

My browsing of the Galleria in Milan, the strolls through Spanish shopping malls, and my dickering with an assortment of dubious Greek merchants, all paid off big time. It turns out that everything I predicted for this beleaguered currency came true.

The European economy did collapse. Cantankerous governments made the problem worse by squabbling, delaying and obfuscating, as usual.

The European Central Bank finally threw in the towel and did everything they could to collapse the value of the Euro and reinvigorate their comatose economies. This they did by imitating America?s wildly successful quantitative easing, which they announced with local variations last Thursday.

And now for the good news: The best is yet to come!

Europe is now six days into a strategy of aggressive monetary easing which may take as long as five years until it delivers tangible, sustainable results. That?s how long it took for the Federal Reserve?s QE to restore satisfactory levels of confidence in the US economy.

The net net is that we have almost certainly only seen the first act of a weakening of the Euro which may last for years. A short Euro could be the trade that keeps on giving.

The ECB?s own target now is obviously parity against the greenback, which you will find predicted in my own 2015 Annual Asset Class Review released at the beginning of January (click here).

Once they hit that target, 87 cents to the Euro will become the new goal, and that could be achieved sooner than later.

However, you will not find me short the Euro up the wazoo this minute. I think we have just stumbled into a classic ?Buy the Rumor, Sell the News? situation with the Euro.

The next act will involve the ECB sitting on its hands for a year, realizing that their first pass at QE was inadequate, superficial, and flaccid, and that it is time to pull the bazooka out of their pockets once again.

This is a problem when the entire investment world is short the Euro. That paves the way for countless, rip your face off short covering rallies in the months ahead. Any smidgeon or blip of positive European economic data could spark one of these.

Trading the Euro for the past eight months has been like falling off a log. It is about to get dull, mean and brutish. So for the moment, my currency play has morphed into selling short the Japanese yen, which has its own unique set of problems.

As for the unintended consequences of the Euro crash, the Q4 earnings reports announced so far by corporate America tells the whole story.

Companies with a heavy dependence on foreign (read Euro and yen) denominated earnings are almost universally coming up short. On this list you can include Caterpillar (CAT), Procter and Gamble (PG), and Microsoft (MSFT).

Who are the winners in the strong dollar, weak Euro contest? US companies that see a high proportion of their costs denominated in flagging foreign currencies, but see their incomes arrive totally in the form of robust, virile dollars.

You may not realize it, but you are playing the global currency arbitrage game every time you go shopping. The standout names here are US retailers, which manufacture abroad virtually all of the junk they sell you here, especially in low waged China.

The stars here are Macy?s (M), Family Dollar Stores (FDO), Costco (COST), Target (TGT), and Wal-Mart (WMT).

You can see this divergence crystal clear in examining the behavior of the major stock indexes. The chart for the Guggenheim S&P 500 Equal Weight ETF (RSP), which has the greatest share of currency sensitive multinationals, looks positively dire, and may be about to put in a fatal ?Head and Shoulders? top (see the following story).

The chart for the NASDAQ (QQQ), where constituent companies have less, but still a substantial foreign currency exposure, appears to be putting in a sideways pennant formation before eventually breaking out to new highs once again.

The small cap Russell 2000, which is composed of almost entirely domestic, dollar based, ?Made in America? type companies, is by far the strongest index of the trio, and looks like it is just biding time before it blasts through to new highs.

If you are a follower of my Trade Alert Service, then you already know that I have a long position in the (IWM), which has already chipped in 2.12% to my 2015 performance.

You see, there is a method to my Madness.

EUO 1-27-15

FXE 1-27-15

RSP 1-27-15

QQQ 1-27-15

IWM 1-27-15

IMF Jan 2015 WEO

John ThomasNever Underestimate the Value of Research

https://www.madhedgefundtrader.com/wp-content/uploads/2015/01/John-Thomas1-e1422462857973.jpg 302 400 Mad Hedge Fund Trader https://madhedgefundtrader.com/wp-content/uploads/2019/05/cropped-mad-hedge-logo-transparent-192x192_f9578834168ba24df3eb53916a12c882.png Mad Hedge Fund Trader2015-01-28 11:35:022015-01-28 11:35:02The Unintended Consequences of the Euro Crash
Mad Hedge Fund Trader

The 60-40 Correction

Newsletter

Traders have been tearing their hair out this year, if they have any left.

The indecisive, flip flopping, ?RISK ON?/?RISK OFF? state of play has been devoid of any direction clues for the past three months. Gold (GLD), the yen (FXY), and bonds (TLT) have been even worse, flat lining inside of narrow ranges.

Hedge fund P & L?s have been hemorrhaging everywhere. The brokers are doing not much better, with some big ones reporting profits down by 50% or more. For many, it is shaping up to be the worst year of the decade.

I have to confess that I have not seen conditions like this during my own long and varied career. I can make money in up markets, and in down markets. But I am helpless in that go nowhere, with option implied volatilities at all time lows.

Better to go take a long nap.

Bulls hate the market because it won?t go up, and bears despise it because it fails to fall. So, what gives?

A page out of the Investing 101 handbook might explain everything.

For eons now, possibly for entire epochs, investment advisors have recommended that their clients place 60% of their liquid assets in stocks, and the remaining 40% in bonds. When extreme market moves knock portfolios out of this cherished balance, they should buy and sell securities to bring it back in line.

And therein lies the problem.

2013 delivered one of the most spectacular stock performances in history, with the S&P 500 up 26%, and 29% when you include dividends. Bonds fell, the (TLT) plunging from $114 to $101, taking the ten-year Treasury yield up from 1.80% to 3.02%. Those who started last year with a traditional belt and suspenders 60%-40% balance ended up 2013 with a portfolio closer to 70%-30%.

So what have investors been doing since the beginning of 2014? Selling stocks and buying bonds to return their desired 60%-40% balance.

This all sounds nice in theory. How much money are we talking about to achieve this rebalancing? A lot. A whole lot. I?d say about $600 billion.

The markets certainly believe in this theory. Bonds have been the most ardent followers, going up since the first trading day of the year. It has posted this blowout return despite the Fed throttling back its monthly bond buying by a massive $40 billion a month since the end of last year.

Stocks are more skeptical, befuddled by the random noise of earnings reports, geopolitical events, ultra low interest rates, and the residual effects of the Fed?s quantitative easing.

Selling was largely confined to the sectors that had risen the most, technology (QQQ), small caps (IWM) and biotechnology (IBB). So instead of a move down in any appreciable way, stocks have given us monotonous sideways action.

How does all this end?

Get everyone?s portfolio back to 60%-40% and the way then becomes clear to fall out of balance again. How will this be resolved? Stocks will gain and bonds will take a nosedive, until we approach the 70%-30% ratio again.

This paves the way for a blowout fourth quarter in the stock market that I have been predicting all year. That should take the (SPX) to 2,100, or up about 10% on the year. What will take the lead? Technology (QQQ), small caps (IWM), and biotechnology (IBB), the sectors that were hit the hardest earlier in the year.

This is why I started piling on risk positions last week, buying Apple (AAPL) and Google (GOOGL), and selling short Treasury bonds (TLT) and the Japanese yen (FXY).

SPY 12-31-13

TLT 12-31-13

RSP 5-27-14

ScaleSo Which Balance is the Right One?

https://www.madhedgefundtrader.com/wp-content/uploads/2014/05/Scale.jpg 298 437 Mad Hedge Fund Trader https://madhedgefundtrader.com/wp-content/uploads/2019/05/cropped-mad-hedge-logo-transparent-192x192_f9578834168ba24df3eb53916a12c882.png Mad Hedge Fund Trader2014-05-28 01:04:312014-05-28 01:04:31The 60-40 Correction
Mad Hedge Fund Trader

All Asset Class Risk Reversal at Hand

Newsletter

I believe that we are on the verge of seeing major reversals across all asset classes. Get this one right, and you will make a fortune. Screw it up, and you will soon be looking for your next job on Craig?s List.

I understand that there is a desperate need for code writers in the cloud.

As always, I am taking my cue from the bond market. The great anomaly in the financial markets during February was the big divergence between the stock and bond markets.

While it was off to the races for stocks, the S&P 500 rocketing an impressive 7%, bonds didn?t believe it for a nanosecond.

If you had asked any global strategist a month ago where the ten year Treasury yield would be if the (SPX) posted a new all time high at 1,865, to a man they would have said 3.05%. Instead, bonds closed the week at a parsimonious 2.65%.

Something is desperately wrong with this picture.

If it were just bonds blowing a raspberry at this stock rally, I wouldn?t be so concerned. However, both the Euro (FXE) and the Japanese yen (FXY), (YCS) moved from strength to strength. They should be falling in a real bull market for stocks.

Precious metals have also been calling foul. If shares were the new risk free investment, why did gold pop by 9% last month? Better yet, why is silver up a sparkling 18%?

The gold producers have done even better. When Barrick Gold (ABX) soars by 26% in s single month, you?ve got to be worried about the stock market.

So here?s what happens next. With an assist from the Russian takeover of the Ukraine (wasn?t it so polite of them to wait a full week after the Sochi Olympics ended?), bonds take a run at the highs for prices and the low for yields, in the mid 2.50%?s.

This is why Mad Day Trader, Jim Parker, shot out a quick, opportunistic long play in the (TLT) last week. There, they will fail once again, as we are now in the early stages of a multi decade bear market.

This will prompt stocks (SPX) to give up a third to a half of the recent rally, taking it to the bottom of an ascending channel at 1,800 (see below). Volatility (VXX) will spike from the current $12 handle back up to $20. This is why I bought the (SPY) $189 - $192 bear put spread on Thursday, which expires on March 21.

When the bond rally gives up the ghost, shares will resume their 2014 surge. Avoid emerging markets (EEM), because another dump in the bond market knocks the stuffing out of them one more time.

What will the currencies do? This will be the starting gun for great short plays on the yen, which returns to a ten-year bear market, and the Euro, which is just tweaking a three-year high.

In the meantime, the dollar basket ETF (UUP) launches into a multi month rally after putting in a double bottom. I shouldn?t need to draw lurid drawings for you on how to trade this.

As for gold? Sorry in advance to the hard money crowd, the inflationistas, and conspiracy theorists (who cares if Germany wants its gold reserves back from the Federal Reserve?). I think the 2014 rally in the barbarous relic dies a sudden, horrible death, and goes back to retest the $1,200 low one more time, possibly breaking it.

This scenario opens up great entry points across virtually all of the many asset classes that I track. When it?s time to strap on a position, I?ll shoot out Trade Alerts as fast as the speed of electricity permits (186,000 miles per second, or 300 meters per second in Europe).

Yes, I think we will finally get a real 10% correction in stocks going into the summer. But you better be nimble to trade it. My experience tells me that too many of you are selling at market bottoms, not buying.

I just thought you?d like to know.

spy 2-28-14

RSP 2-28-14

TLT 2-28-14

TNX 2-28-14

John Thomas - SnorkelJust Thought You?d Like to Know

https://www.madhedgefundtrader.com/wp-content/uploads/2014/03/John-Thomas-Snorkel.jpg 340 447 Mad Hedge Fund Trader https://madhedgefundtrader.com/wp-content/uploads/2019/05/cropped-mad-hedge-logo-transparent-192x192_f9578834168ba24df3eb53916a12c882.png Mad Hedge Fund Trader2014-03-03 01:05:232014-03-03 01:05:23All Asset Class Risk Reversal at Hand
Mad Hedge Fund Trader

Why the Stock Market is Still Going Up

Diary, Newsletter

I have had an extremely hot hand this year, pushing the 2013 performance of my Trade Alert Service above a stellar 30%. So I am going out on a limb here and predict that the S&P 500 is about to grind up to a new all time high.

Since 2009, Federal Reserve governor, Ben Bernanke, has clearly made our central bank?s top priority jobs and growth, at the eventual expense of a higher inflation rate. The higher stock and home prices, a vast monetary expansion enabled, has also created a huge wealth effect. This is spurring newly emboldened investors to pour more money into risk assets everywhere, save commodities and precious metals. This creates more consumption, and, in the end, finally, more jobs.

Thanks to Ben?s efforts, stock prices have financially reached what most traditional analysts consider ?fair value? after a long four-year slog. The historic 50 year range for price earnings multiples is 9-22, and here we sit today, dead center at 15.5, assuming S&P 500 earnings of $100/share.

But this time, it?s different. Ten year Treasury yields at 2.05% today, are about 400-500 basis points lower than seen during past stock market peaks. Even after the $85 billion sequestration hit, Washington is still pumping $800 billion a year into the economy, even though the recovery is four years old. And Ben Bernanke shows no sign of taking the punch bowl away anytime soon.

This is why, having failed to break 1,485 of the downside on the heels of the Italian election disappointment on February 25, the index has little choice but to gun for the upside target of 1,585.

Health of this market top is vastly more robust than previous ones. Currently, 85% of the stocks in the (SPX) are trading above their 200 day moving averages, compared to only 50% when markets peaked in 2007, when the market actions was far more concentrated in a handful of stocks.

Such a broad base suggests that a lot of managers are still underinvested, and that the pain trade is to the upside. This is why the February correction that everyone was waiting for never came, and why we saw an incredibly bullish ?time? correction instead of a ?price? one. I was expecting as much.

Indeed, the technical outlook for the market is becoming increasingly positive as is obvious from the charts below. We have seen several successive new highs for the Dow transports for many weeks now, an index of a much more economically sensitive group of stocks.

Look at an equal weighted index of the S&P 500, like the (RSP), and it has already hit a new all time high, a huge plus. Finally, the NASDAQ (QQQ) looks like it is, at long last, putting its lost decade behind it by breaking to new ten-year highs.

Still, there are some qualifications here. The Dow needs to stay above 14,198 for the rest of March for this breakout to be valid. So far, so good. The capitalization weighted (SPX) is also approaching its high in the most overbought condition since 2007, with RSI?s well into the 70 territory. That means a round of profit taking will hit once we do hit a new high.

Another development that has technical analysts extremely excited is that many leadership stocks are catapulting off of bases that took 10-12 years to form. The number of new decade highs greatly exceeds the new lows. This has many chartists calling for a further move in the main indexes up another 10% from here.

Every bull market ends in overvaluation, often an extreme one, and sitting here at fair value, we are not even close for this cycle. Not a day goes by now that I don't get emails from readers asking what to do with cash here. I think the safer bet will be to go with high quality, high growing names where a hefty dividend gives you a cushion against any short-term volatility.

That list would include KKR Financial (KKR) (7.4%), Atlas Pipeline (APL) (7.7%), Linn Energy (LINE) (7.7%), and Transocean (RIG) (4.2%). You could also do worse than American Express (AXP), (1.30%), and Bristol Myers-Squib (BMY) (3.80%).

Party on!

INDU 3-7-13

SPX 3-7-13

OEX 3-7-13

RSP 3-7-13

COMPQ 3-7-13ICSA 3-4-13

EMSPAY 3-1-13

Party

Party On!

https://www.madhedgefundtrader.com/wp-content/uploads/2013/03/Party.jpg 416 587 Mad Hedge Fund Trader https://madhedgefundtrader.com/wp-content/uploads/2019/05/cropped-mad-hedge-logo-transparent-192x192_f9578834168ba24df3eb53916a12c882.png Mad Hedge Fund Trader2013-03-11 10:26:152013-03-11 10:26:15Why the Stock Market is Still Going Up

tastytrade, Inc. (“tastytrade”) has entered into a Marketing Agreement with Mad Hedge Fund Trader (“Marketing Agent”) whereby tastytrade pays compensation to Marketing Agent to recommend tastytrade’s brokerage services. The existence of this Marketing Agreement should not be deemed as an endorsement or recommendation of Marketing Agent by tastytrade and/or any of its affiliated companies. Neither tastytrade nor any of its affiliated companies is responsible for the privacy practices of Marketing Agent or this website. tastytrade does not warrant the accuracy or content of the products or services offered by Marketing Agent or this website. Marketing Agent is independent and is not an affiliate of tastytrade. 

Legal Disclaimer

There is a very high degree of risk involved in trading. Past results are not indicative of future returns. MadHedgeFundTrader.com and all individuals affiliated with this site assume no responsibilities for your trading and investment results. The indicators, strategies, columns, articles and all other features are for educational purposes only and should not be construed as investment advice. Information for futures trading observations are obtained from sources believed to be reliable, but we do not warrant its completeness or accuracy, or warrant any results from the use of the information. Your use of the trading observations is entirely at your own risk and it is your sole responsibility to evaluate the accuracy, completeness and usefulness of the information. You must assess the risk of any trade with your broker and make your own independent decisions regarding any securities mentioned herein. Affiliates of MadHedgeFundTrader.com may have a position or effect transactions in the securities described herein (or options thereon) and/or otherwise employ trading strategies that may be consistent or inconsistent with the provided strategies.

Copyright © 2025. Mad Hedge Fund Trader. All Rights Reserved. support@madhedgefundtrader.com
  • Privacy Policy
  • Disclaimer
  • FAQ
Scroll to top