Below please find subscribers' Q&A for the Mad Hedge Fund Trader May 23 Global Strategy Webinar with my guest and co-host Bill Davis of the Mad Day Trader.
As usual, every asset class long and short was covered. You are certainly an inquisitive lot, and keep those questions coming!
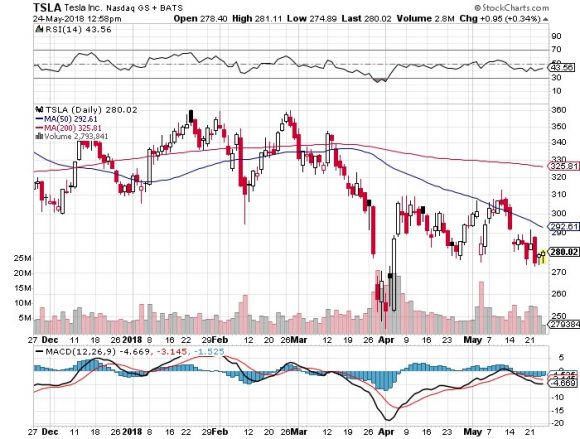
Q: Would you short Tesla here?
A: Tesla (TSLA) is on the verge of making the big leap to mass production, so they're in somewhat of an in-between time from a profit point of view, and the burden of proof is on them. Elon Musk is notorious for squeezing shorts. I would not want to bet him.
Musk has been successfully squeezing shorts for 10 years now, from the time the stock was at $16.50 all the way up to $392. So, I would not short Tesla. Buy the car but don't play in the stock; it's really a venture capital play that happens to have a stock listing because so many people are willing to back his vision of a carbon-free economy.
Q: What is your takeaway on the China trade war situation?
A: The Chinese said "no," and that is positive for economic growth. Anything that enhances international trade is good for growth and good for the stock market; anything that damages international trade is bad for corporate earnings and bad for the stock market. So, the China win in the trade war is essentially positive, but I don't think we'll see that reflected in stock prices until the end of the year.
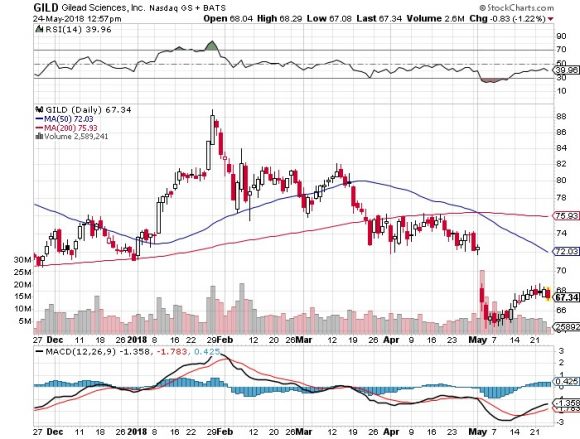
Q: What do you think about Gilead Sciences?
A: I don't really want to touch Gilead (GILD), or the entire sector, for that matter. We shouldn't be seeing such a poor performance at this point in the market. Health care has been dead for a long time, and you would have expected a rally based purely on fundamentals; they are delivering good earnings, it's just not reflected in the price action of the stocks. I think with no new money going into the market, there's nothing to push up other sectors; it's really become a "technology on and off" market. Health care doesn't fit anywhere in that world.
Q: Do you still like Nvidia?
A: I love Nvidia (NVDA). The chip sector still has another year to go. Nvidia has the high value-added product, and I'm looking for $300 dollars a share sometime this year/next year. The reason the stock hasn't really been moving is that it's over-owned; too many people know about the Nvidia story, which continues to go "gangbusters," so to speak. The chairman has also put out negative comments on short-term inventories, which have been a drag.
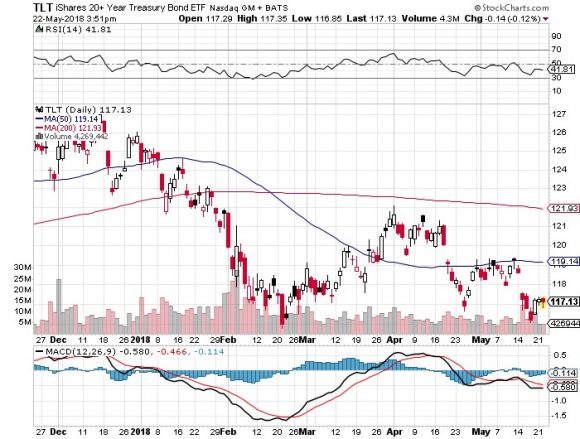
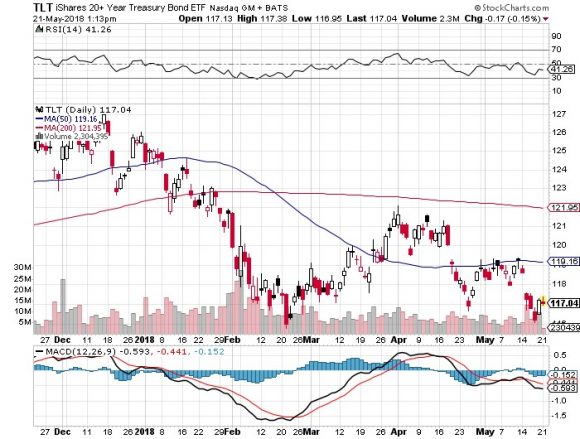
Q: Treasuries (TLT) are over 3%. Will they go over 3.5% by then end of this year?
A: I would say yes. Since that is only 50 basis points away from the current market, I would say it's a pretty good bet. So, if you get any good entry points you can do LEAPS going out to next year, betting that Treasuries will not only be below $116 by the end of the year, but they'll probably be below 110. And that would give you a very good high return LEAP with a yield of 50% in the next, say 8 months. By the way, if the Treasury yield rises to 4% that takes the (TLT) down to $98!
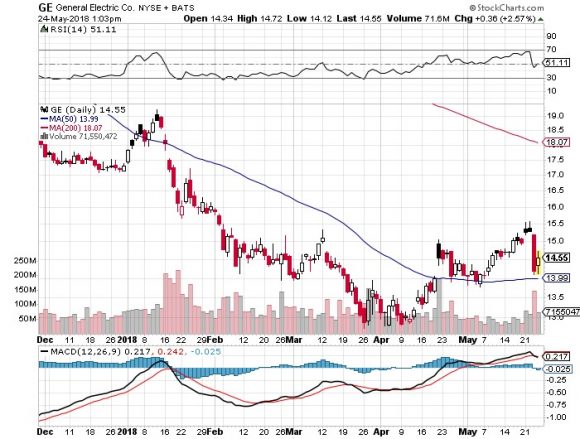
Q: Any chance General Electric will be acquired this year?
A: Absolutely not. General Electric (GE) worth far more if you break it up into individual pieces and sell them. Some parts are very profitable like jet engines and Baker Hughes, while other parts, like their medical insurance exposure, are awful.
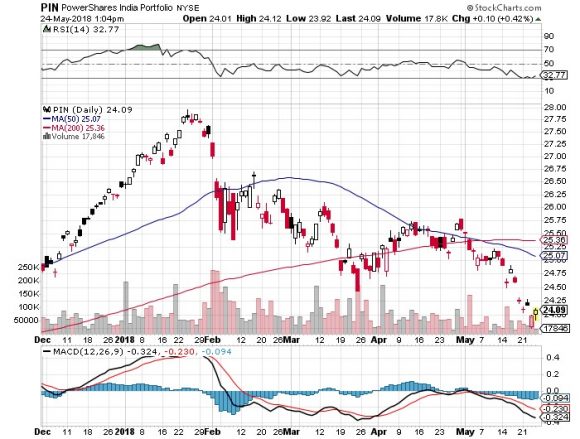
Q: What do you see about the India ETF?
A: The one I follow is the PowerShares India Portfolio ETF (PIN) and we love it long term. Short term, they can take some pain with the rest of the emerging markets.
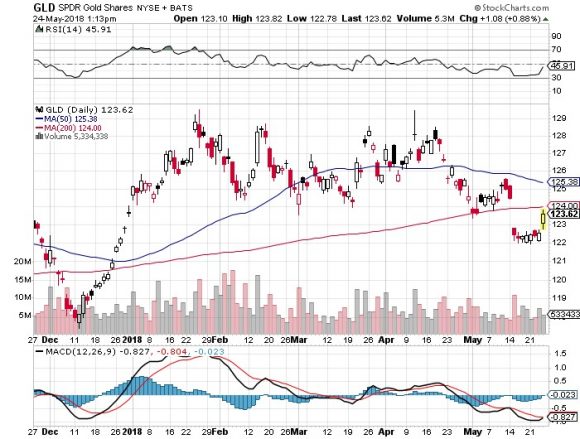
Q: What should I do with my January 2019 Gold calls?
A: I would sell them. It's not worth hanging on to here with too many other better things to do in stocks.
Q: Would you continue to hold ExxonMobile?
A: I would not. If you were lucky enough to get in at the bottom on ExxonMobile (XOM). I would be taking profits here. I'm not sure how long this energy rally will last, especially if the global economic slowdown continues.
Q: Is Freeport-McMoRan (FCX) a buy?
A: Yes, but only buy the dip in the recent range, so you don't get stopped out when the price goes against you. Commodities are the best performing asset class this year and that should continue.
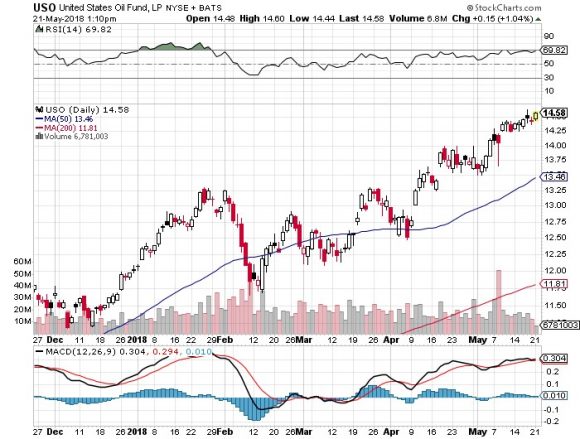
Q: How high is oil (USO) headed?
A: I think we're probably peaking out short of $80 a barrel currently unless we get a major geopolitical event. Then it could go up to $100 very quickly and trigger a recession.
Q: Are you looking to buy the Volatility Index here?
A: Buy the next dip, but the trick with (VIX) is buying after it sits on a bottom for about five days. You also want to buy it when stocks (SPY) are at the top of a range, like yesterday.
Q: How long do you think the market will be range-bound for?
A: My bet is at least three months, and possibly four or five. We should start to anticipate the outcome of the midterm congressional elections in September/October; that's when you get your upside breakout.
Q: Is Gold (GLD) not worth buying since Bitcoin has taken over market share from Gold buyers?
A: Essentially, yes. That's probably why you're not getting these big spikes in Gold like you're used to. Instead, you're getting them in Bitcoin. Bitcoin is clearly stealing Gold's thunder. That's a major reason why we haven't been chasing Gold this year.
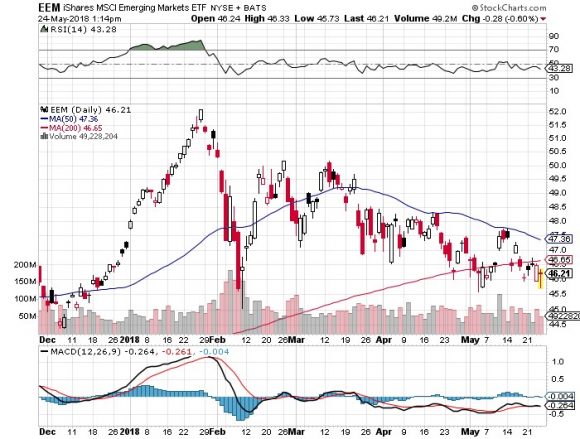
Q: After the emerging market sell-off, is it a good time to go in?
A: No, I think the emerging market (EEM) sell-off is being created by rising interest rates and a strong dollar. I don't see that ending anytime soon. In a year let's take another look in emerging markets. By then overnight Fed funds should be at 2.50% to 2.75%.
Featured Trade:
(MONDAY, JULY 16, 2018, PARIS, FRANCE, GLOBAL STRATEGY LUNCHEON), (WHY I'M SELLING SHORT THE STOCK MARKET),
(SPY), (TLT),
(TESTING TESLA'S SELF-DRIVING TECHNOLOGY),
(TSLA)
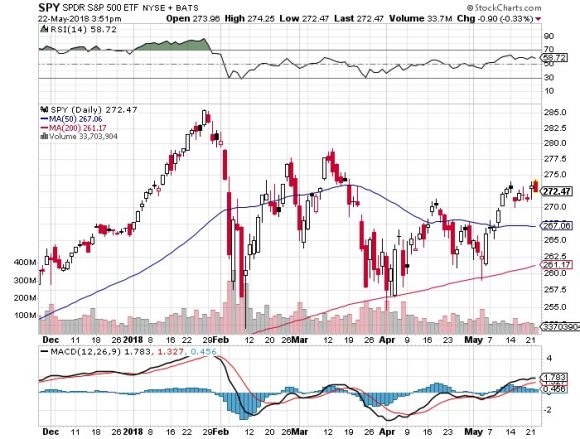
All good things must come to an end, and I think the latest rally in stocks has just about run out of steam.
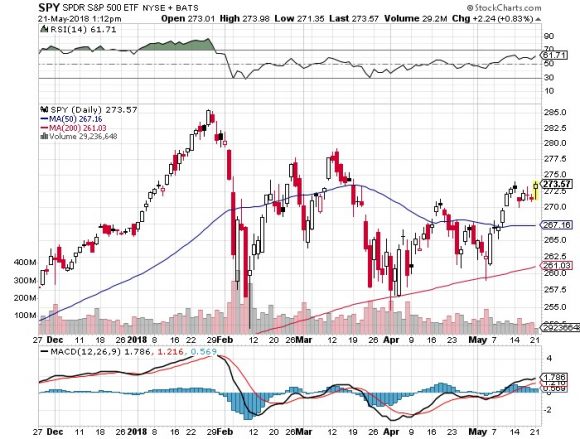
Up 12 out of 14 days, and the stock market is starting to reach a point of exhaustion. The S&P 500 (SPY) is now at the top end of a four-month trading range.
In addition, we are now well into a seasonally negative period for stocks, the six months when the total return on indexes is zero. The summer slowdown is upon us, and the declining trading volume is screaming at us loud and clear.
Please note that for the past months, stocks have been rising on small volume and falling on big volume. That is classic late cycle market action and is increasingly making me afraid of my own shadow.
We have just had an onslaught of surprise good news that took us up this high, thus giving us a fabulous short side entry point.
That would include a China trade war temporarily going on hold, the administration's free pass for Iran sanctions busting for the multinational Chinese telecom company ZTE, and Micron Technology's (MU) announcement of a $10 billion share buyback. Good news tends to happen in three's, and on the third one you sell.
So, a shot on the short side is reasonable here. However, doing ANY trade with the Volatility Index (VIX) down here at the $12 handle is a bit of a stretch. But I have only sent out one Trade Alert so far in May, and my traders are starving for fresh red meat.
I am not turning bearish, nor do I expect a recession to strike imminently. That will take place in late 2019 at the earliest. I'm just executing a short-term trade here to keep from being bored to death.
It is all just a matter of numbers. The American labor force is currently growing at 0.5% a year, while productivity is expanding by 1.5%. Add them together and that gives you 2% annual trend growth. Add in a 2% inflation rate and you get a 4% nominal GDP growth rate.
That growth rate means the Fed funds overnight interest rate should be 2.5%, a full 1% above the present 1.5%, so four more 25 basis point Fed rate hikes are a sure thing. It will get to 2.5% in a year.
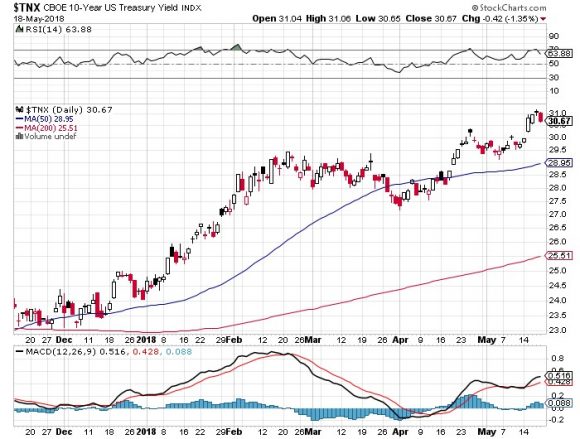
Similarly, a 4% nominal growth rate historically brings you a 4% 10-year U.S. Treasury bond yield versus the current 3.07%, so we have another year to get to 4% as well.
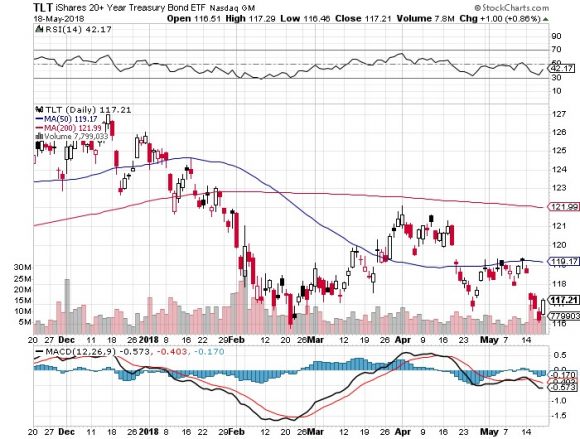
That means our short strategy in the (TLT) is alive and well, we're just waiting for a better entry point. A 4% Treasury bond targets $98 on the downside in the (TLT), or down another $19 from today's close.
With a price earnings multiple 17X and an assumed earnings per share of $155, that puts the fair value for the S&P 500 of $2,720, or exactly where it is right now.
So the stock market isn't expensive, rich, or euphoric. Nor is it at bargain basement throwing the baby out with the bathwater cheap. It is dead in the middle.
And bull markets never end with fair valuation; they end with valuation upside blowouts. We dallied there at the end of January, but only for a few days. We may not see those high numbers again until the end of 2018.
And here's the bad news. Trading conditions could remain like this for another five months, until the November midterm congressional elections.
Just thought you'd like to know.
https://www.madhedgefundtrader.com/wp-content/uploads/2018/05/Joh-n-in-suit-story-2-image-3-e1527027062176.jpg277300MHFTRhttps://madhedgefundtrader.com/wp-content/uploads/2019/05/cropped-mad-hedge-logo-transparent-192x192_f9578834168ba24df3eb53916a12c882.pngMHFTR2018-05-23 01:07:392018-05-23 01:07:39Why I'm Selling Short the Stock Market
Featured Trade:
(DON'T MISS THE MAY 23 GLOBAL STRATEGY WEBINAR),
(CHINA'S BIG TRADE WIN),
(SPY), (TLT), (UUP), (USO), (GLD), (SOYB),
(HOW TO USE YOUR CELL PHONE ABROAD)
My phone started ringing on Sunday afternoon as soon as the futures markets opened in Asia. The U.S. had reached agreement with China on trade and the Dow futures were up 200 points.
Had the next leg of the bull market begun? ?Was it time to buy?
I asked what were the specifics of the deal. There weren't any. I asked about generalities. Those were absent as well.
All they knew was that the U.S. was suspending threatened tariff increases in exchange for a vague Chinese promise to buy more U.S. exports over the long term.
It was in effect a big Chinese win. The development allows the Middle Kingdom to do nothing but stall for time until the next U.S. administration comes to power regardless of which party wins. The Chinese think in terms of centuries, so waiting three more years for a better negotiating backdrop is no big deal.
It vindicates my own call on how the Chinese trade war would play out. After a lot of threats and saber rattling, the administration would achieve nothing, declare victory, and go home.
Traders should NOT be buying this pop in stock prices on pain of death. All that will happen is that stocks will trade back up to the top of the recent range, and then stall out once again as we slide back into slow summer trading. In fact, all we have accomplished is to revisit last week's high in stocks.
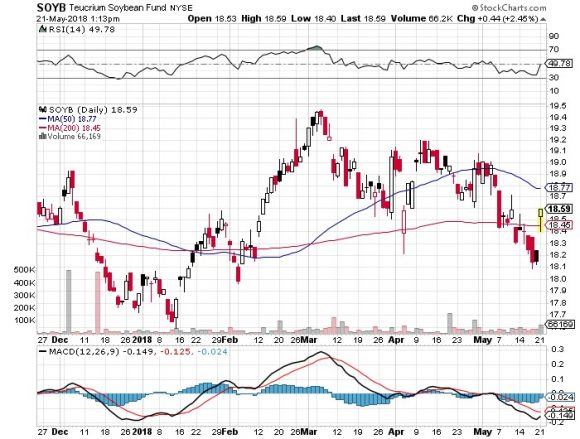
Stocks (SPY) weren't buying this trade agreement for two seconds, nor were bonds (TLT), foreign exchange (UUP), gold (GLD), or energy (USO). Not even the agricultural markets were believing it. Soybeans (SOYB), the commodity most affected by the China trade, were up a measly 2.45%. If markets really believed something substantial was afoot they would be limit up three days in a row. I've seen this happen.
It was obvious that little was accomplished when you saw the endless parade of administration officials praising the deals merits. My half century of trading experience has taught me when someone is working so hard to sell you a bridge, you look the other way.
And here is the problem. Beyond cutting-edge technology, there's nothing that China HAS to buy from the U.S. China's largest imports are in energy and foodstuffs, both globally traded commodities.
The oil and gas coming out of America looks pretty much like the Saudi Arabian and Russian kind. U.S. energy infrastructure is already groaning at the seams as it approaches 11 million barrels a day.
To double that from current levels just to fill the trade gap with China would require a multi-decade effort financed with trillions of dollars in private capital just to produce more oil with prices at a three-year high. In other words, it isn't going to happen.
The same is true with agriculture. I doubt there is a single farmer in the country willing to risk his own money to increase production on the back of the China deal. Rainfall is a much bigger concern.
In the end, stocks will eventually rise to new highs by the end of the year, just not right now. And they will do so on the back of the prodigious earnings growth of U.S. companies, which has been expanding at a breakneck pace for nearly a decade.
It is notable that the only major index that hit new highs today was the small cap Russell 2000 (IWM) where the constituent companies essentially do NO trade with China.
To believe otherwise would be giving the cock the credit for the sun rising, which happens every morning like clockwork.
It Worked Again!
https://www.madhedgefundtrader.com/wp-content/uploads/2018/05/Great-Wall-of-China-story-2-image-5-e1526941006225.jpg201300MHFTRhttps://madhedgefundtrader.com/wp-content/uploads/2019/05/cropped-mad-hedge-logo-transparent-192x192_f9578834168ba24df3eb53916a12c882.pngMHFTR2018-05-22 01:07:402018-05-22 01:07:40China's Big Trade Win
Featured Trade:
(JOIN ME ON THE QUEEN MARY 2 FOR THE MAD HEDGE JULY 11, 2018 SEMINAR AT SEA),
(THE MARKET OUTLOOK FOR THE WEEK AHEAD, or NO TRADE),
($INDU), (SPY), (TLT), ($TNX), (CPB)
Not only did we get no net movement; the range was an infinitesimal 200 Dow points. It was hardly enough to make a dog's breakfast.
Of course, the big news was the yield on the 10-year U.S. Treasury bond (TLT), which rose to 3.12%, a seven-year high. You might have expected this to prompt a complete stock market rout. It didn't. Maybe that is next week's business.
It is rare that the bullish and bearish arguments reach a perfect balance, but that is what we got. In the meantime, trading volume is shrinking, never a good sign. Will the last one to leave please shut out the lights?
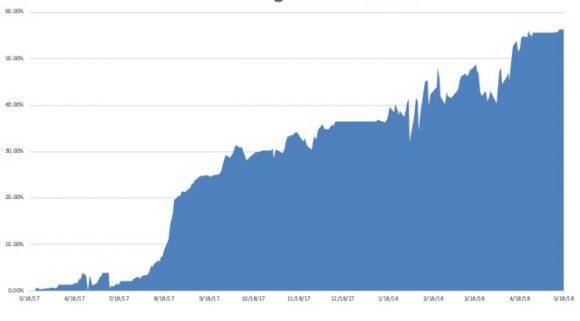
Which is all an indication of what I have been warning you about for months. This is setting up to be a dreadful summer. If you've already made your year, with a 19.88% gain like I have, you're better off taking a long cruise than trying to outsmart the algorithms.
I managed to squeeze off only one trade so far this month. I sold short the S&P 500 (SPY) right at the high of the week. However, when the downside momentum failed, and a Volatility Index (VIX) spike failed to confirm, I bailed for a small profit. Pickings are indeed thin.
Whenever my trading slows down, I get the inevitable customer complaints. My answer is always the same. Reach for the marginal trade and you will get your fingers bit off. Don't be in such a hurry to lose money. As my wise Latin professor used to say, "Festina lente," or "make haste slowly."
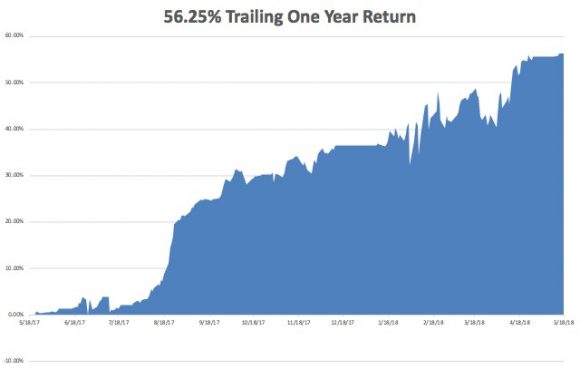
My May return is +0.53%, my year-to-date return stands at a robust 19.83%, my trailing one-year return has risen to 56.25%, and my eight-year profit sits at a 296.30% apex.
And remember, the market is making this move in the face of rising oil prices and interest rates, always bull market killers.
To mix a few metaphors, when the sun, moon, and stars line up once again I'll go pedal to the metal with the TradeAlerts once again.
If you held a gun to my head and ordered me to tell you how the markets will play out for the rest of the year, try this.
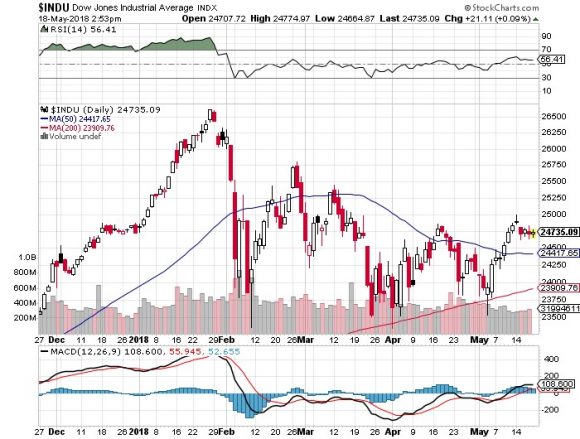
We remain is this narrowing trading range for months, ending with a final decisive break of the 200-day moving average to the downside, now at 23,909. But we find a new low only 1,000 points, or 4% below that.
Then we launch into the post midterm election year-end rally, which could take stocks up 15% to 20% from the 23,000 low. This is why I have been saying that the best trades of 2018 are ahead of us.
So, renew that subscription!
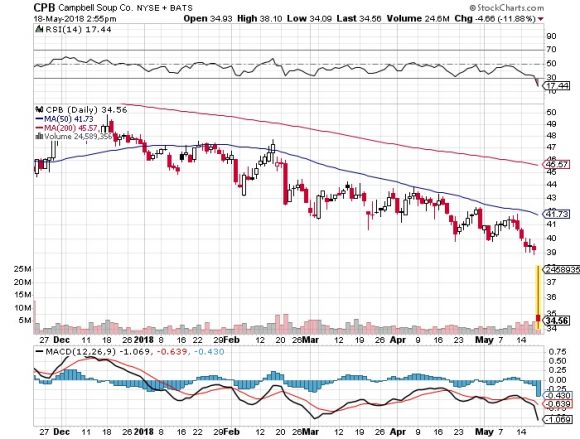
To witness how cruel and stock specific the current market is, look no further than hapless Campbell Soup (CPB), the first ticker symbol I have had to look up this year. There is probably not a reader alive who was not nursed back to health by its iconic red canned chicken noodle soup.
A surprise earnings loss triggered a hellacious 14% one-day plunge. It is the first big victim of the new steel tariffs. Although it amounts to only a few pennies a can, that can be disastrous in this hyper-competitive world. It also turns out that Millennials prefer eating fresh food rather that the canned stuff.
Give thanks for small mercies. With three daughters I am at ultimate risk for a tab for three weddings. The nuptials for Meghan Markle and Prince Harry are thought to cost $45 million, most of it on security. Hopefully I will not someday become the father-in-law of a prince.
This coming week has a plethora of Fed speakers, some key housing numbers, and that's about it.
On Monday, May 21, at 8:30 AM, we get April Chicago Fed National Activity Index.
On Tuesday, May 22, nothing of note is announced.
On Wednesday, May 23, at 10:00 AM, the April New Home Sales.
Thursday, May 24, leads with the Weekly Jobless Claims at 8:30 AM EST, which saw a rise of 11,000 last week from a 43-year low. At 10:00 AM, we get April ExistingHome Sales.
On Friday, May 25, at 8:30 AM EST, we get April Durable Goods Orders.
We wrap up with the Baker Hughes Rig Count at 1:00 PM EST.
As for me, I will be spending the weekend putting the finishing touches on my 2018 Mad Hedge European Tour.
Thanks to rising U.S. interest rates and a strong dollar, the price of a continental trip has dropped about 10% since the beginning of the year. Got to love that Swiss franc at 1:1 parity with the greenback. Maybe I can afford an extra cheese fondue.
Good Luck and Good Trading.
Yes, It All Looks Like Magic
https://www.madhedgefundtrader.com/wp-content/uploads/2018/05/Trailing-one-year-story-2-image-1-1-e1526680186775.jpg369580MHFTRhttps://madhedgefundtrader.com/wp-content/uploads/2019/05/cropped-mad-hedge-logo-transparent-192x192_f9578834168ba24df3eb53916a12c882.pngMHFTR2018-05-21 01:06:132018-05-21 01:06:13Market Outlook for the Week Ahead, or No Trade
Featured Trade: (FRIDAY, JUNE 15, 2018, DENVER, CO, GLOBAL STRATEGY LUNCHEON) (GET READY FOR THE COMING GOLDEN AGE),
(SPY), (INDU), (FXE), (FXY), (UNG), (EEM), (USO),
(TLT), (NSANY), (TSLA)
I believe that the global economy is setting up for a new golden age reminiscent of the one the United States enjoyed during the 1950s, and which I still remember fondly.
This is not some pie in the sky prediction. It simply assumes a continuation of existing trends in demographics, technology, politics, and economics. The implications for your investment portfolio will be huge.
What I call "intergenerational arbitrage" will be the principal impetus. The main reason that we are now enduring two "lost decades" of economic growth is that 80 million baby boomers are retiring to be followed by only 65 million "Gen Xers."
When the majority of the population is in retirement mode, it means that there are fewer buyers of real estate, home appliances, and "RISK ON" assets such as equities, and more buyers of assisted living facilities, health care, and "RISK OFF" assets such as bonds.
The net result of this is slower economic growth, higher budget deficits, a weak currency, and registered investment advisors who have distilled their practices down to only municipal bond sales.
Fast forward six years when the reverse happens and the baby boomers are out of the economy, worried about whether their diapers get changed on time or if their favorite flavor of Ensure is in stock at the nursing home.
That is when you have 65 million Gen Xers being chased by 85 million of the "millennial" generation trying to buy their assets.
By then we will not have built new homes in appreciable numbers for 20 years and a severe scarcity of housing hits. Residential real estate prices will soar. Labor shortages will force wage hikes.
The middle-class standard of living will reverse a then 40-year decline. Annual GDP growth will return from the current subdued 2% rate to near the torrid 4% seen during the 1990s.
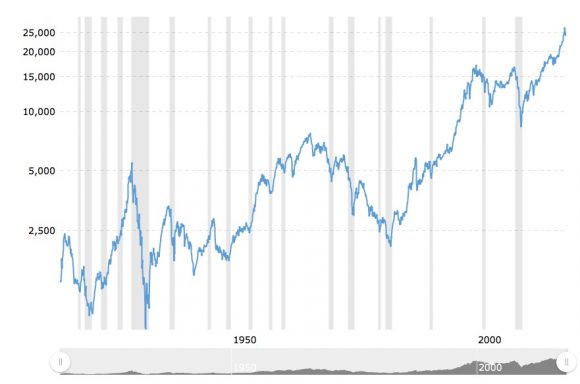
The stock market rockets in this scenario. Share prices may rise very gradually for the rest of the teens as long as tepid 2% growth persists. A 5% annual gain takes the Dow to 28,000 by 2019.
After that, after a brief dip, we could see the same fourfold return we saw during the Clinton administration, taking the Dow to 100,000 by 2030. If I'm wrong, it will hit 200,000 instead.
Emerging stock markets (EEM) with much higher growth rates do far better.
This is not just a demographic story. The next 20 years should bring a fundamental restructuring of our energy infrastructure as well.
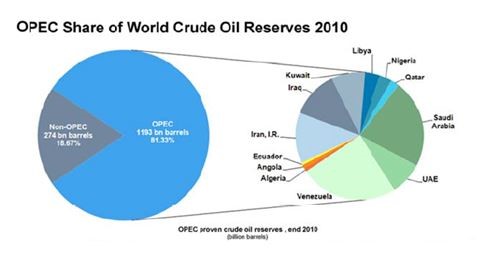
The 100-year supply of natural gas (UNG) we have recently discovered through the new "fracking" technology will finally make it to end users, replacing coal (KOL) and oil (USO). Fracking applied to oilfields is also unlocking vast new supplies.
Since 1995, the United States Geological Survey estimate of recoverable reserves has ballooned from 150 million barrels to 8 billion. OPEC's share of global reserves is collapsing.
This is all happening while automobile efficiencies are rapidly improving and the use of public transportation soars.
Mileage for the average U.S. car has jumped from 23 to 24.7 miles per gallon in the past couple of years, and the administration is targeting 50 mpg by 2025. Total gasoline consumption is now at a five-year low.
Alternative energy technologies will also contribute in an important way in states such as California, accounting for 30% of total electric power generation by 2020, and 50% by 2030.
I now have an all-electric garage, with a Nissan Leaf (NSANY) for local errands and a Tesla Model S-1 (TSLA) for longer trips, allowing me to disappear from the gasoline market completely. Millions will follow. The net result of all of this is lower energy prices for everyone.
It will also flip the U.S. from a net importer to an exporter of energy, with hugely positive implications for America's balance of payments. Eliminating our largest import and adding an important export is very dollar bullish for the long term.
That sets up a multiyear short for the world's big energy consuming currencies, especially the Japanese yen (FXY) and the Euro (FXE). A strong greenback further reinforces the bull case for stocks.
Accelerating technology will bring another continuing positive. Of course, it's great to have new toys to play with on the weekends, send out Facebook photos to the family, and edit your own home videos.
But at the enterprise level this is enabling speedy improvements in productivity that are filtering down to every business in the U.S., lowering costs everywhere.
This is why corporate earnings have been outperforming the economy as a whole by a large margin.
Profit margins are at an all-time high. Living near booming Silicon Valley, I can tell you that there are thousands of new technologies and business models that you have never heard of under development.
When the winners emerge, they will have a big cross-leveraged effect on economy.
New health care breakthroughs will make serious disease a thing of the past, which are also being spearheaded in the San Francisco Bay area.
This is because the Golden State thumbed its nose at the federal government 10 years ago when the stem cell research ban was implemented. It raised $3 billion through a bond issue to fund its own research, even though it couldn't afford it.
I tell my kids they will never be afflicted by my maladies. When they get cancer in 20 years they will just go down to Wal-Mart and buy a bottle of cancer pills for $5, and it will be gone by Friday.
What is this worth to the global economy? Oh, about $2 trillion a year, or 4% of GDP. Who is overwhelmingly in the driver's seat on these innovations? The USA.
There is a political element to the new golden age as well. Gridlock in Washington can't last forever. Eventually, one side or another will prevail with a clear majority.
This will allow the government to push through needed long-term structural reforms, the solution of which everyone agrees on now, but for which nobody wants to be blamed.
That means raising the retirement age from 66 to 70 where it belongs and means-testing recipients. Billionaires don't need the maximum $30,156 annual supplement. Nor do I.
The ending of our foreign wars and the elimination of extravagant unneeded weapons systems cuts defense spending from $800 billion a year to $400 billion, or back to the 2000, pre-9/11 level. Guess what happens when we cut defense spending? So does everyone else.
I can tell you from personal experience that staying friendly with someone is far cheaper than blowing them up.
A Pax Americana would ensue.
That means China will have to defend its own oil supply, instead of relying on us to do it for them. That's why they have recently bought a second used aircraft carrier. The Middle East is now their headache.
The national debt then comes under control, and we don't end up like Greece.
The long-awaited Treasury bond (TLT) crash never happens. The Fed has already told us as much by indicating that the Federal Reserve will only raise interest rates at an infinitesimally slow rate of 25 basis points a quarter.
Sure, this is all very long-term, over-the-horizon stuff. You can expect the financial markets to start discounting a few years hence, even though the main drivers won't kick in for another decade.
But some individual industries and companies will start to discount this rosy scenario now.
Perhaps this is what the nonstop rally in stocks since 2009 has been trying to tell us.
Dow Average 1908-2018
Another American Golden Age is Coming
https://www.madhedgefundtrader.com/wp-content/uploads/2018/05/50s-photo-story-2-image-3.jpg237305MHFTRhttps://madhedgefundtrader.com/wp-content/uploads/2019/05/cropped-mad-hedge-logo-transparent-192x192_f9578834168ba24df3eb53916a12c882.pngMHFTR2018-05-15 01:06:182018-05-15 01:06:18Get Ready for the Coming Golden Age
Legal Disclaimer
There is a very high degree of risk involved in trading. Past results are not indicative of future returns. MadHedgeFundTrader.com and all individuals affiliated with this site assume no responsibilities for your trading and investment results. The indicators, strategies, columns, articles and all other features are for educational purposes only and should not be construed as investment advice. Information for futures trading observations are obtained from sources believed to be reliable, but we do not warrant its completeness or accuracy, or warrant any results from the use of the information. Your use of the trading observations is entirely at your own risk and it is your sole responsibility to evaluate the accuracy, completeness and usefulness of the information. You must assess the risk of any trade with your broker and make your own independent decisions regarding any securities mentioned herein. Affiliates of MadHedgeFundTrader.com may have a position or effect transactions in the securities described herein (or options thereon) and/or otherwise employ trading strategies that may be consistent or inconsistent with the provided strategies.