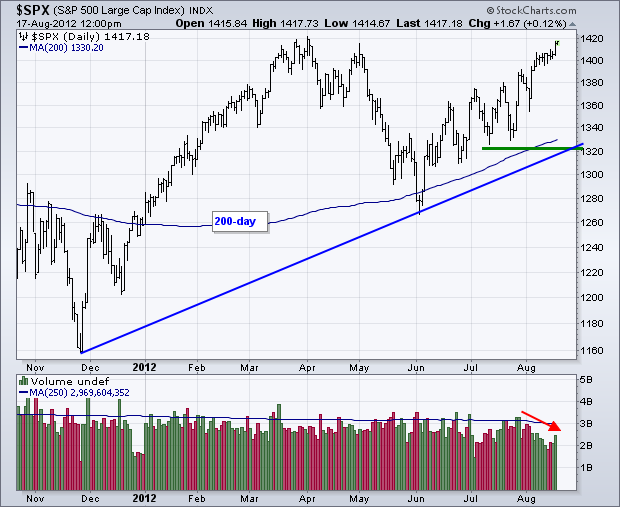
Take a look at the chart below for the S&P 500, and it is clear that we are gunning for an all time high between 1,550 and 1,600. With the debt ceiling crisis now cancelled, you really have to look hard to find any near term reasons to sell stocks, so we could hit those lofty numbers as early as March.
A perusal of the short-term charts certainly demands one to conclude that we are overbought. The Relative Strength Indicator has just hit 70%, normally a signal that we are reaching an interim top. However, the RSI can stay elevated for an extended period of time and trade as high as 80 before the downside risks show their ugly face. That could be months off.
In the meantime, we could see some sort of correction. But it is more likely to be a time correction, not a price one. That has the market moving sideways in an agonizing, tortuous, narrowing range on declining volume for a while before launching on another leg up.
This year?s rally occurred so quickly that a lot of money was left on the sidelines, especially with the largest managers. That is why we have seen no meaningful corrections so far. This condition could remain all the way out until April.
It is likely that traders are going to keep ramping up this market until the January month end book closing. That sets up a quiet February. The deep-in-the-money options that I have been recommending to readers are ideally suited for this falling volatility environment. They reach their maximum point of profitability, whether the market goes up, sideways, or down small.
You see confirmation of this analysis everywhere you look. Treasury bonds (TLT) can?t catch a bid, and are clearly threatening to break out above the 1.90% yield band that has prevailed for the past year. The Volatility Index (VIX) hit another new five year low today at $12.40. Oil (USO) just hit a multi month high. It all points to stock prices that will remain on an upward path for the foreseeable future.
I think I?ll buy more stocks and then go drive my new Tesla around the mountain.
A Tesla S-1 Performance
https://www.madhedgefundtrader.com/wp-content/uploads/2013/01/TESLA.jpg398588Mad Hedge Fund Traderhttps://madhedgefundtrader.com/wp-content/uploads/2019/05/cropped-mad-hedge-logo-transparent-192x192_f9578834168ba24df3eb53916a12c882.pngMad Hedge Fund Trader2013-01-24 09:28:322013-01-24 09:28:32SPX 1,600, Here We Come!
I?ll give myself a ?B? on this one. Sure, with the Trade Alert Service generating a 14.87% net profit for the year, I was able to bring in double the Dow average, and triple what most hedge funds delivered, including some of the biggest ones.
But for once, I did not achieve true greatness. I feel that, given the amount of work I did, I should have done much better. I issued 230 Trade Alerts in rapid-fire succession with a ?to die for? success rate of 70%.
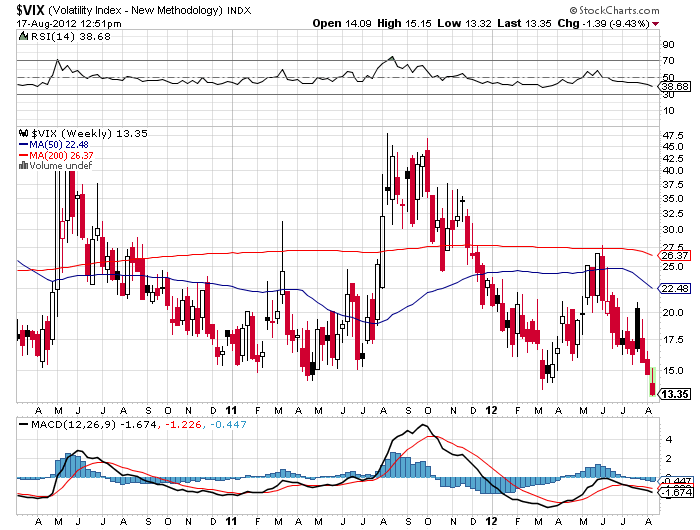
I managed to capture these gains with half the market volatility of 2011. While the Volatility Index (VIX) reached the lofty height of 49% in 2011, in 2012 we managed to eke out a peak of only 27%, and that was only for a few nanoseconds. In fact, volatility was down for almost the entire year, save for a brief spike in May, and some yearend short covering.
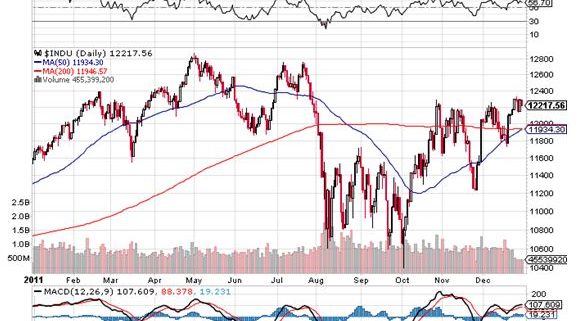
In 2011, I had a much higher range in the market to work with, the high for the Dow coming in at 12,850 and the low at 10,400, for a total range of 2,450 points. In 2012, the range was only 1,630 points, making it a much more difficult market to work with. This meant shifting from outright call and put option positions to spreads, in order to keep the dosh reliably rolling in.
Nevertheless, I made some serious money in 2012. The best trade of the year was a call spread in the S&P 500, which nicely caught the yearend rally in equities, producing a 4.75% profit for the notional $100,000 portfolio. The worst was a short position in Boeing (BA), which cost me a gut wrenching 8.70%.
In terms of asset classes, foreign exchange trading was far and away my biggest earner, adding 11.85% in positive performance. This was because I shorted volatility in the Japanese yen (FXY), (YCS) for the first three quarters of the year when it flat lined, and then went aggressively short when the big break to the downside came. Thank you Mr. Shinzo Abe, Japan?s new prime minister, who championed the beleaguered country?s assertive weak yen policy during the December elections! Shorts in the Euro (FXE), (EUO) also chipped in.
Gold (GLD) was my second income producer, taking in 6.40%. I timed the summer rally in the barbarous relic perfectly, and shook it by the lapels until its gold teeth came chattering out. I would have made more, but the yellow metal then died on the announcement of Ben Bernanke?s QE3, much to everyone?s surprise.
My five years spent drilling for oil and gas in West Texas came in handy once again, netting 4.75% in gains. This was entirely made on the short side. Friends calling me from the Lone Star State with tales of endless oil gluts gushing forth from North Dakota encouraged me to be more bold in selling the (USO) than I might have otherwise.
I was also a fairly nimble bond trader in 2012 (TLT), (TBT), harvesting another 1.62% in profits. I correctly called the top in prices/bottom in yields in August, but failed to capitalize with bigger short positions. This could be a big trade in 2013.
Ah, now for the hard part. Not every trade was a winner in 2012, although many of the losers were hedges for long side plays that ultimately made money. Trading in the index ETF options for the S&P 500 (SPY) and the Russell 200 (IWM) lost -1.30%. An early long position in the volatility Index (VXX) eroded -3.42% from the performance. Fortunately, I bailed from that strategy quickly.
Options positions in individual equities bled me by another -9.54%. Almost the entire loss came from one stock, Apple (AAPL), which is still perplexing the street. I managed the first $150 decline in the stock admirably. After that, it was a bloodbath. Never have I seen a share price divorce itself so dramatically from the underlying fundamentals. Either something terrible is about to happen to Steve Jobs? creation, or the stock market has got it all wrong.
This was one tricky year to trade. I started off all right, clocking gains in January and February. I correctly anticipated another ?Sell in May, and go away? year. But I underestimated the extent that volatility would fall. Melting option premiums absolutely took me to the cleaners in March and April.
When I realized the problem, I switched from outright options to spreads, which included a short volatility element to every single position. That launched a white-hot run of 25 consecutive profitable trades from April to September.
Then Ben Bernanke caught me by surprise, launching QE3 sooner than expected, just before the presidential election. That forced me to stop out of positions that turned good only days later. I correctly called the outcome of the election in all 50 states. But the big Obama win caught many portfolio managers by surprise, who responded by dumping positions to realize capital gains and beat expected tax increases. That took the (SPX) down 10%, leaving the market unchanged on the year by mid November. This cost me more money.
I redeemed myself by accurately calling the yearend rally and going aggressively long. In the end, the ?Fiscal Cliff? that was supposed to crash the market was little more than a media invention. Stocks closed on their highs.
It was one of the tougher years in my career, so I was quite happy to deliver double-digit profits for my readers. It was also a learning experience. After slogging through 45 years in this business, I still occasionally commit the same blunders as a first year trainee. Don?t we all.
Hopefully, you learned something too from my outpouring of 400,000 words in the 250 daily letters that I penned during the year analyzing every investment theme under the sun. You should have also gained some insight from the 22 biweekly webinars I produced. You also had a chance to expand your horizons at by 26 strategy luncheons and speaking engagements held around the world.
2013 will be better, as our blistering gains so far testify.
The Dow in 2011
The Dow in 2012
The Volatility Index in 2012
Good Luck and Good Trading
John Thomas
The Mad Hedge Fund Trader
https://www.madhedgefundtrader.com/wp-content/uploads/2013/01/INDU-2011.jpg475581Mad Hedge Fund Traderhttps://madhedgefundtrader.com/wp-content/uploads/2019/05/cropped-mad-hedge-logo-transparent-192x192_f9578834168ba24df3eb53916a12c882.pngMad Hedge Fund Trader2013-01-16 09:26:062013-01-16 09:26:06My 2012 Report Card
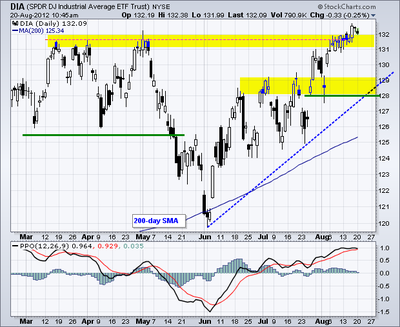
It is a fact of life that markets get overstretched. Think of pulling on a rubber band too hard, or loading too many paddlers at one end of a canoe. Whatever the metaphor, the outcome is always unpleasant and sometimes disastrous.
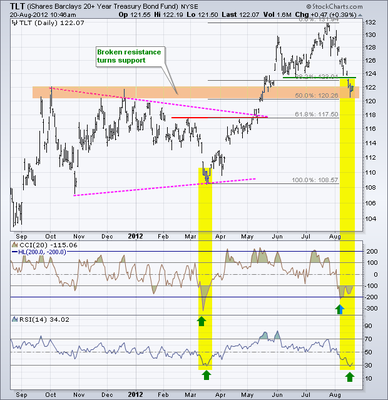
Take a look at the charts below and you can see how extended markets have become. Stocks (DIA), (QQQ), (IWM) have reached the top of decade and a half trading ranges. Bonds (TLT), (LQD) are at three month lows, and yields have seen the sharpest back up in over a year.
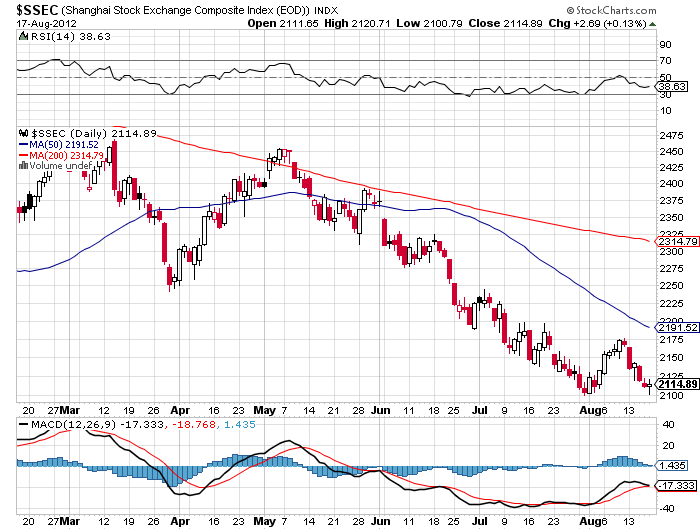
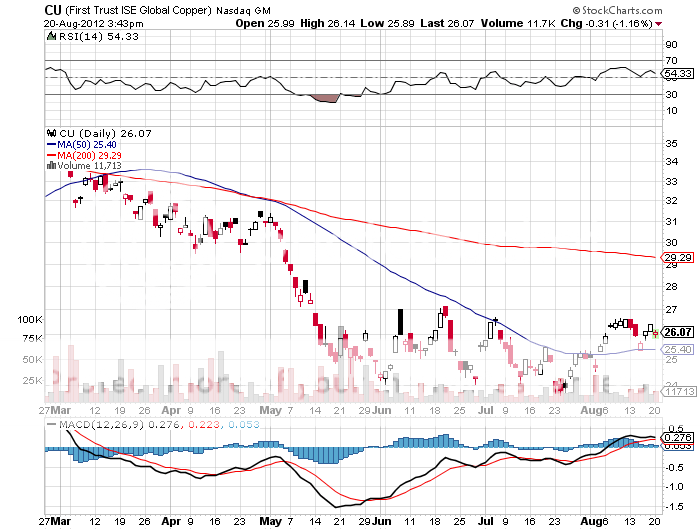
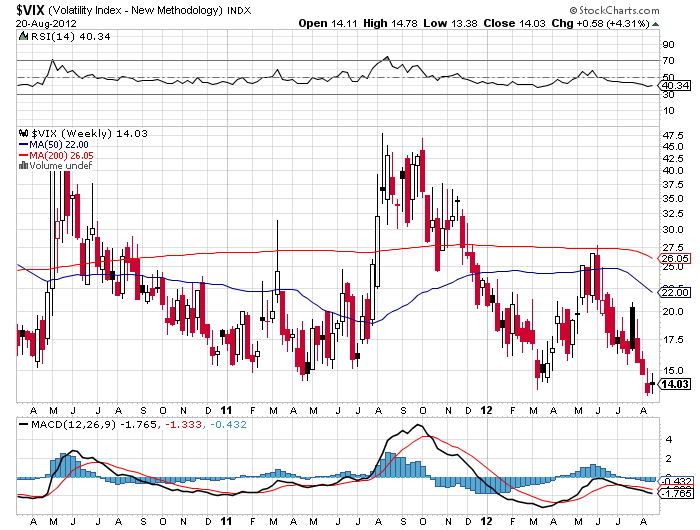
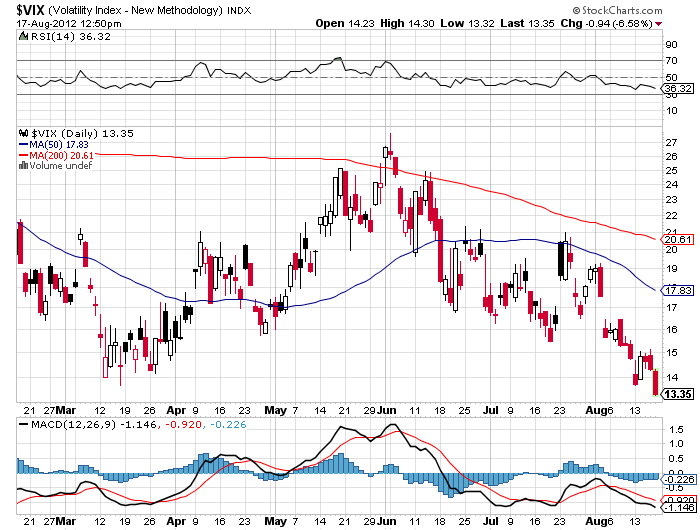
In the meantime, the non-confirmations of these trends are a dime a dozen. Every trader?s handbook says that you unload risk assets like crazy whenever you see the volatility index (VIX) trade in the low teens for this long. The Shanghai Index ($SSEC), representative of the part of the world that generates 75% of the world?s corporate profits, hit a new four year low last night. Copper (CU) doesn?t believe in this risk rally for a nanosecond. Nor is the Australian dollar (FXA) signaling that happy days are here again.
I am betting that when the whales come back from their vacations in Southampton, Portofino, or the South of France, they are going to have a heart attack when they see the current prices of risk assets. A big loud ?SELL? may be the consequence of a homecoming. A Jackson Hole confab of central bankers that delivers no substantial headlines next week could also deliver the trigger for a sell off.
You may have noticed that European Central Bank president, Mario Draghi, has come down with a case of verbal diarrhea this summer. His pro-bailout comments have been coming hot and heavy. When the continent?s leaders return from their extended six week vacations, it will be time to put up or shut up. The final nail in this coffin could be A Federal Reserve that develops lockjaw instead of announcing QE3 at their September 12-13 meeting of the Open Market Committee.
To me, it all adds up to a correction of at least 5%, or 70 points in the S&P 500, down to 1,350. I?m not looking for anything more dramatic than that in the run up to the presidential election. I am setting up my bear put spreads to reach their maximum point of profitability in the face of such a modest setback. A dream come true for the bears would be a retest of the May lows at 1,266, however unlikely that may be.
For the real crash, you?ll have to wait for 2013 when a recession almost certainly ensues. Stay tuned to this letter as to exactly when that will begin.
?The Real Crash Isn?t Coming Until 2013
https://madhedgefundtrader.com/wp-content/uploads/2019/05/cropped-mad-hedge-logo-transparent-192x192_f9578834168ba24df3eb53916a12c882.png00DougDhttps://madhedgefundtrader.com/wp-content/uploads/2019/05/cropped-mad-hedge-logo-transparent-192x192_f9578834168ba24df3eb53916a12c882.pngDougD2012-08-20 23:03:132012-08-20 23:03:13Watch Out for the Coming Risk Reversal
Mr. Market sometimes speaks in mysterious tongues, and you really have to wonder what he is struggling to tell us by taking the Volatility Index (VIX) down to a subterranean $13 handle on Friday, a new five year low.
A number of advisors have been recommending that investors load up on the (VIX) in recent months to give them downside protection from an imminent market crash. Those who followed such advice were hammered, their clients no doubt striking them off invitation lists for summer barbeques.
In the past month, the (VIX) has cratered from $20 to $13. Just last October, it touched $49, when I urged readers to pile in on the short side. I came out in the mid-$30?s weeks later.
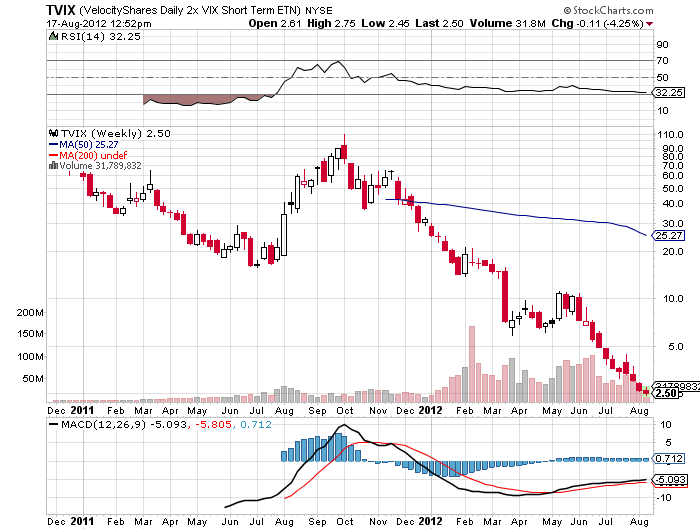
Those who traded the triple leveraged (TVIX) fared even worse, this blighted ETF plunging from $5 to $2.50 during the same period. The (TVIX) is doing the best impression of an ETF going to zero that I know of. A year ago it was trading at $110. This is why I plead with traders to avoid triple leveraged ETF?s like the plague. These things are designed for day trading by hedge funds only. Eventually, they all go to zero.
I am even seeing this in my own portfolio. A week ago, I sold short the September, 2012 (SPY) $147 calls at $0.38. A week later, the (SPY) has risen by 1.2% but the call options have done a swan dive to $0.34. This can only happen when they are crushing volatility.
I quit recommending (VIX) plays in March when I realized that there is some sort of arbitrage going on in the hedge fund community that is punishing (VIX) owners. I haven?t figured out the exact mathematical dynamics yet, but it has to involve selling short the cash stocks and shorting (VIX) contracts against them. Whatever they lose on the cash short is more than made up by the profits on their (VIX) short.
It?s easy to see how successful this would be. While August (VIX) traded at a lowly 13.40%, September volatility is still up at 18%, and January, 2013 is trading at a positively nosebleed 25%. That spread provides a lot of room to take in some serious money.
So what is the 13% really trying to tell us? Here are some thoughts:
*It is discounting multiple tranches of quantitative easing by central banks around the world that take all asset prices up for the rest of the year.
*It reflects the complete abandonment of the stock market by the individual investor, which is why trading volume has collapsed.
*It also indicates how exchange traded funds are taking over, sucking volume out of the stock market. The (VIX) doesn?t reflect activity in ETF?s.
*It could be discounting an Obama win in the presidential election. Stocks have delivered a 72% return since the Obama inauguration, the third best in history after Franklin Roosevelt and Bill Clinton. Mixed stock and bond portfolios have delivered the best returns on record, with both asset classes appreciating dramatically for 3 ? years, something that never happens.
It could be that the (VIX) at this level has it all wrong, and that a stock market selloff is about to send it soaring. Those who have rigidly held on to that belief until now have been severely tested.
For those who have fortunately avoided the (VIX) trade so far, let me give you a quick primer. The CBOE Volatility Index (VIX) is a measure of the implied volatility of the S&P 500 stock index. You may know of this from the talking heads on TV, beginners, and newbies who call this the ?Fear Index?.
For those of you who have a PhD in higher mathematics from MIT, the (VIX) is simply a weighted blend of prices for a range of options on the S&P 500 index. The formula uses a kernel-smoothed estimator that takes as inputs the current market prices for all out-of-the-money calls and puts for the front month and second month expirations.
Ready to Take the Plunge on Volatility?
https://www.madhedgefundtrader.com/wp-content/uploads/2012/08/high_dive.jpg360400DougDhttps://madhedgefundtrader.com/wp-content/uploads/2019/05/cropped-mad-hedge-logo-transparent-192x192_f9578834168ba24df3eb53916a12c882.pngDougD2012-08-19 23:03:562012-08-19 23:03:56The Volatility Death Spiral Continues
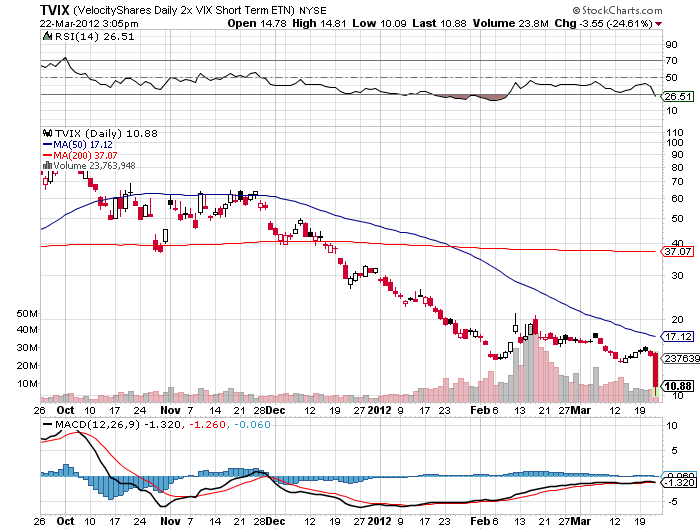
The inside story on the collapse of volatility is now out, and as a result, managers are reviewing the harsh lessons learned and tweaking their strategies. It highlights the dangers of buying securities without reading the prospectus and understanding what is under the hood.
As investors piled into stocks in February, they also bought downside protection in the form of the Velocity Shares Daily 2X VIX Short Term ETN (TVIX). For reasons that are yet to be explained, the issuer, Credit Suisse, arbitrarily decided to quit issuing new shares, effectively turning this vehicle into a closed end fund. Money poured in anyway, driving the price up to a 100% premium over the intrinsic value of the fund.
Then, out of the blue, Credit Suisse reversed its decision and decided to issue new shares after all last week. This could mean only one thing to the professional volatility trading community, which jumped on the (TVIX) with both feet. They took the ETF down a stunning 65% in a week, all the way down to a 20% discount to intrinsic value. During the same time, the (VXX) fell by 25%, while the (VIX) was up 10%. Now that?s a tracking error with a turbocharger!
It now appears that there was some advanced knowledge about the reissuance of shares, and the SEC is almost certain to make inquiries. Those who had hoped for downside protection in the stock market got a slap in the face instead. To say the least, confidence in the financial system has not been advanced.
To make matters worse, a major hedge fund based in Chicago has a gigantic position in the (TVIX) with a ?put tree?. This involved buying one $21 put and selling short one $18 put and three $17 puts. Below $17 they were 300% long the (TVIX). When the ETF broke that level, the sushi hit the fan, triggering panic selling of all (VIX) products at any price, including the unrelated (VXX). I can?t tell you who it is without risking litigation. But with the quarter end upon us, their investors will find out soon enough. Watch the newspapers to find out whom.
The debacle has sent analysts scurrying to find other ETF?s that may be trading at premiums to their underlying. Here are the top three:
Platinum (PGM) 27%
Municipal bonds (GMMG) 14%
China small cap (PEK) 6%
The premium in the (UNG) frequently goes as high as 50% and results from the contango in the futures market, where far month contracts are trading at big premiums to the front month. That makes it a great shorting vehicle in falling markets, because the ETF always falls faster than the underlying. I have drunk at this well many times.
What happens from here? My guess is now that managers see that their downside protection is a sham, they won?t want to play. That could translate into stock selling, now that holders understand that these positions involved more risk than they realized.
In the meantime, if you plan on dabbling in the $1.4 trillion 1,400 issue ETF market, it may prove wise to check out the intrinsic value of any ETF before you buy it. You can do this easily by going to Yahoo Finance and adding .iv to any ticker symbol. So while the (TVIX) intrinsic value this second is at $7.51, the current market is at $7.96, a 6% premium. If you value your wealth, you might well get familiar with this exercise.
Trading Volatility Isn?t Always So Fun
https://madhedgefundtrader.com/wp-content/uploads/2019/05/cropped-mad-hedge-logo-transparent-192x192_f9578834168ba24df3eb53916a12c882.png00DougDhttps://madhedgefundtrader.com/wp-content/uploads/2019/05/cropped-mad-hedge-logo-transparent-192x192_f9578834168ba24df3eb53916a12c882.pngDougD2012-03-28 23:03:382012-03-28 23:03:38The Final Word on the Volatility Index
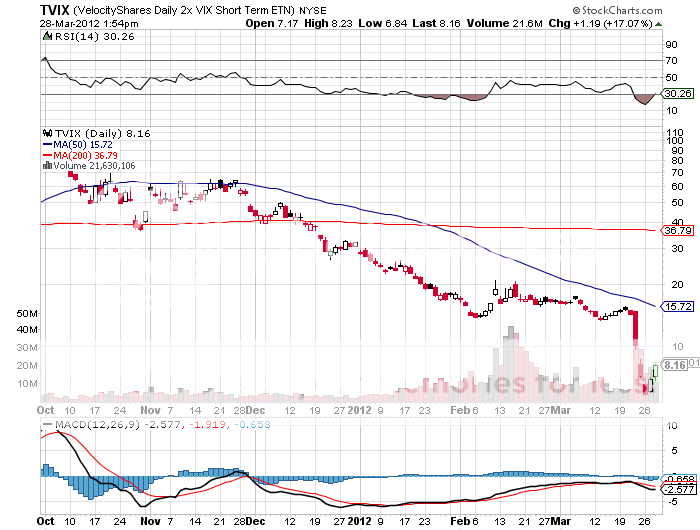
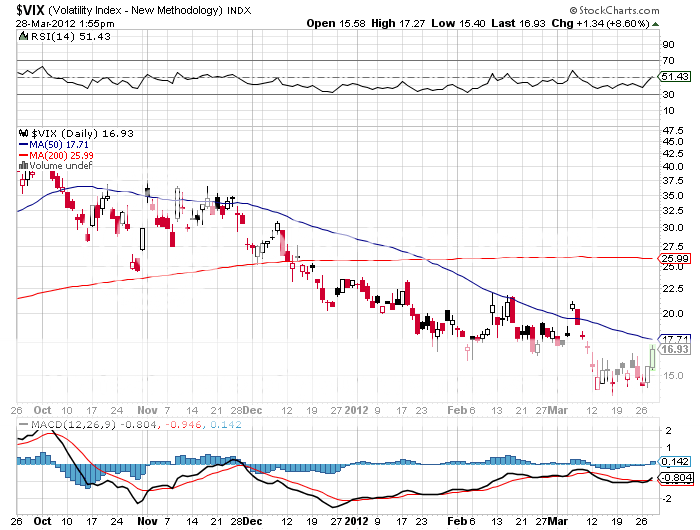
The market was buzzing today about the continued collapse of volatility and the significance thereof today. Today the chief whipping boy was the double leveraged Velocity Shares 2X Vix ETF (TVIX), which cratered 33% on the day, and down 90% from its October high.
This was on a day when the ETF should have gone through the roof, with the Dow down 100 points and a rapidly deteriorating Chinese Purchasing Managers Index threatening of worse to come. Even the (VIX) and the (VXX) only brought in modest gains at best. Against this backdrop they should have been up much more.
Conspiracy theories abounded. Some speculated about margin calls on a major hedge fund triggering a forced liquidation. Other?s thought that complacency was peaking, creating spike bottoms in volatility products that could signify a final move. Certainly a buying opportunity is setting up here, but how do you determine where when the ETF is doing the exact opposite of what it is supposed to do.
Whatever the reason, investors? trust in these instrument has been permanently dented. A 33% one day drop certainly was not in the prospectus.
https://www.madhedgefundtrader.com/wp-content/uploads/2012/03/roller_coaster2.jpg400392DougDhttps://madhedgefundtrader.com/wp-content/uploads/2019/05/cropped-mad-hedge-logo-transparent-192x192_f9578834168ba24df3eb53916a12c882.pngDougD2012-03-22 23:05:432012-03-22 23:05:43Volatility Melt Down Continues
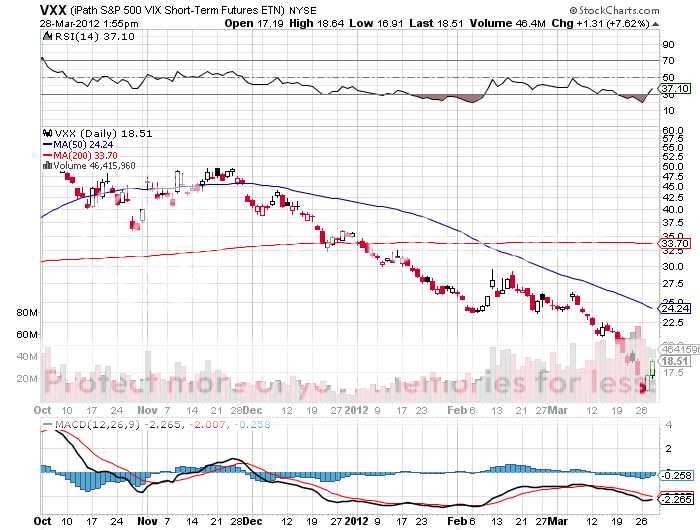
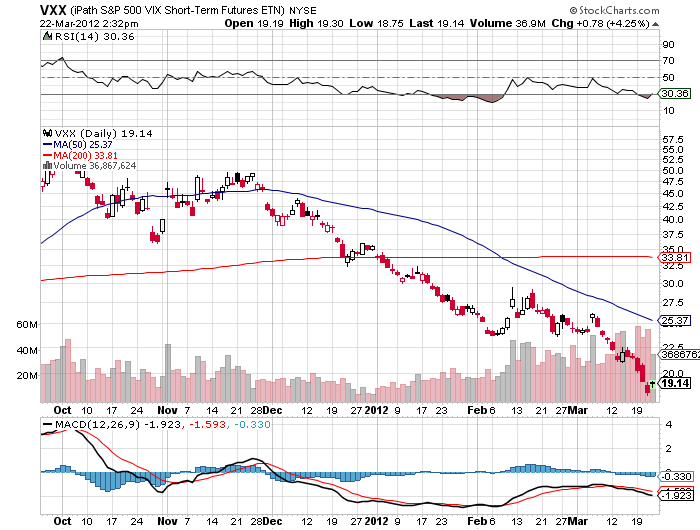
Much of Wall Street was scratching their heads yesterday as the iPath S&P 500 Vix Short Term Futures ETN (VXX) plunged to new lifetime lows despite a 69 point decline in the Dow index. It wasn?t supposed to work that way. Falling markets should send investors scrambling to buy downside protection in the form of put options which would automatically send the volatility index skyward. Except when they don?t.
I spoke to over 30 market participants yesterday attempting to root out the cause of this seeming anomaly. All I got was shrugs or idle speculation. A (VXX) at this level assumes that the complacency now endemic in the market will continue for several more months. It is betting that the S&P 500 will continue moving sideways or up with no pull backs greater that 2%. Oh, really?
It is also discounting a rise in the (SPX) to 1,500, based on a multiple expansion from 14 to 15, while corporate earnings are falling. This will see confirmation when Q1, 2012 earnings start to hit in April. Oh, really again? It will do this in the face of economies that are dramatically slowing in both Europe and china while oil prices are spiking. Oh, really, a third time?
I finally got through to some friends in the Chicago pits who explained what was going on. A sizeable portion of the trading community believes that we will see a rise in volatility someday, but not in the near future. So they have been buying June and September call option in the volatility index (VIX). To pay for these they have been selling short calls in the front month April and May calls.
Since the (VXX) focuses on only the front two months of the options calendar, it has taken an inordinate brunt of the selling. This is why the (VXX) has continued a rapid decent even on days when the (VIX) was stable and the Dow was down. The first hint we got of this was on Monday, March 12 when traders started to roll in earnest from the March to the April (VIX) contract.
When they started executing this trade in December, both the short term and long term volatility were trading around 28. Holding a June or September call while selling calls for each expiring month against it has kept long dated volatility high at 28, but driven short term volatility down to an eye popping 14. Needless to say, it has been a huge money maker for the early participants.
How does this end? At some point we do get a serious sell off in the stock market, and the (VIX) rockets back up to 28 or higher. That means that anyone who initiates this position now will get slaughtered. But the long term players will simply write those losses off against the substantial short dated premium they have taken in in the meantime.
As long as this dynamic is in place, there really is no limit to how far the (VXX) can fall. As traders roll from one expiring month to the next, they will continue to hammer volatility. So when the (VXX) hit my stop loss at $20, the previous lifetime low for this contract, I let it stand and followed up with a trade alert reminder investors to bail.
Any loss that you don?t learn from is a wasted lesson that is bound to be repeated. The key in this situation is to make sure the hits don?t become life threatening by limiting them to small single digits. The combined loss of my two errant (VXX) trades came to -3.46% for my notional $100,000 portfolio. That is not the end of the world. It simply cancels out the profits I made earlier on my short positions in the Japanese yen and natural gas, as well as my long call spreads in Apple and Microsoft. Coming out here also lets me shrink and neutralize my book, a good think in these uncertain times.
I?m sure we?ll see the (VXX) above $30 sometime this year. I just don?t want to bleed to death before it happens.
Markets Can Remain Irrational Longer Than you Can Remain Solvent
https://www.madhedgefundtrader.com/wp-content/uploads/2012/03/keynes.jpg300250DougDhttps://madhedgefundtrader.com/wp-content/uploads/2019/05/cropped-mad-hedge-logo-transparent-192x192_f9578834168ba24df3eb53916a12c882.pngDougD2012-03-21 23:05:002012-03-21 23:05:00What?s Going on With the VXX?
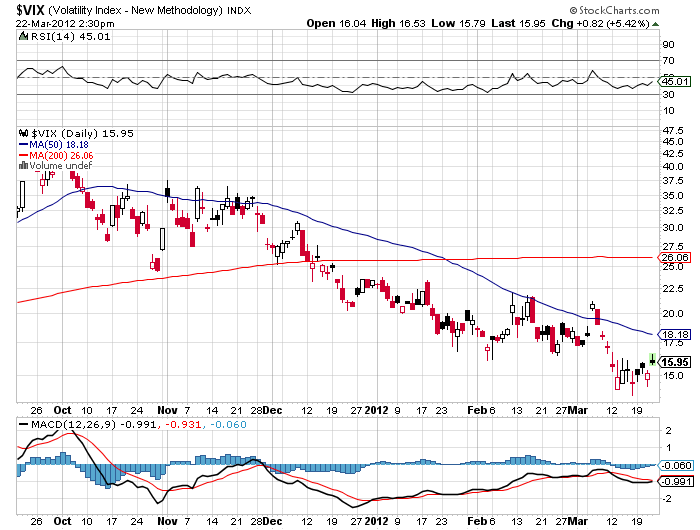
I am one of those cheapskates who buys Christmas ornaments by the bucket load from Costco in January for ten cents on the dollar because my eleven month return on capital comes close to 1,000%. I also like buying flood insurance in the middle of the summer when the forecast here in California is for endless days of sunshine. That is what we are facing now with the volatility index (VIX) where premiums have just broken under 20%, a six month low. The profits you can realize are spectacular.
The CBOE Volatility Index (VIX) is a measure of the implied volatility of the S&P 500 stock index, which has been melting since the ?RISK OFF? trade peaked in early October. You may know of this from the talking heads, beginners, and newbies who call this the ?Fear Index?. Long term followers of my Trade Alert Service profited handsomely after I urged them to sell short this index with the heady altitude of 47%.
For those of you who have a PhD in higher mathematics from MIT, the (VIX) is simply a weighted blend of prices for a range of options on the S&P 500 index. The formula uses a kernel-smoothed estimator that takes as inputs the current market prices for all out-of-the-money calls and puts for the front month and second month expirations. The (VIX) is the square root of the par variance swap rate for a 30 day term initiated today. To get into the pricing of the individual options, please go look up your handy dandy and ever useful Black-Scholes equation. You will recall that this is the equation that derives from the Brownian motion of heat transference in metals. Got all that?
For the rest of you who do not possess a PhD in higher mathematics from MIT, and maybe scored a 450 on your math SAT test, or who don?t know what an SAT test is, this is what you need to know. When the market goes up, the (VIX) goes down. When the market goes down, the (VIX) goes up. End of story. Class dismissed.
The (VIX) is expressed in terms of the annualized movement in the S&P 500. So today?s (VIX) of $19 means that the market expects the index to move 5.5%, or 72 S&P 500 points, over the next 30 days. You get this by calculating $19/3.46 = 5.5%, where the square root of 12 months is 3.46. The volatility index doesn?t really care which way the stock index moves. If the S&P 500 moves more than the projected 5.5%, you make a profit on your long (VIX) positions.
Probability statistics suggest that there is a 68% chance (one standard deviation) that the next monthly market move will stay within the 5.5% range. I am going into this detail because I always get a million questions whenever I raise this subject with volatility deprived investors.
It gets better. Futures contracts began trading on the (VIX) in 2004, and options on the futures since 2006. Since then, these instruments have provided a vital means through which hedge funds control risk in their portfolios, thus providing the ?hedge? in hedge fund.
But wait, there?s more. Now, erase the blackboard and start all over. Why should you care? If you buy the (VIX) here at $19, you are picking up a derivative at a nice oversold level. Only prolonged, ?buy and hold? bull markets see volatility stay under $20 for any appreciable amount of time.
If you are a trader you can buy the (VIX) somewhere under $20 and expect an easy double sometime this year. If you are a long term investor, pick up some (VIX) for downside protection of your long term core holdings. A bet that euphoria doesn?t go on forever and that someday something bad will happen somewhere in the world seems like a good idea here.
https://madhedgefundtrader.com/wp-content/uploads/2019/05/cropped-mad-hedge-logo-transparent-192x192_f9578834168ba24df3eb53916a12c882.png00DougDhttps://madhedgefundtrader.com/wp-content/uploads/2019/05/cropped-mad-hedge-logo-transparent-192x192_f9578834168ba24df3eb53916a12c882.pngDougD2012-01-22 23:04:492012-01-22 23:04:49Buy Flood Insurance With the VIX
Today was a real head scratcher for long time market observers, including myself. Cross market correlations that have served me so well this year are breaking down, and their predictive power has suddenly gone blind. I blame this on the liquidity drought that has plagued the market since the beginning of the month that has confined markets to frustratingly narrow ranges.
There are many reasons for the sudden opacity. The usual seasonal flight to the sidelines seems more pronounced than in years past, as many managers attempt to put a dreadful year behind them. There is still $500 million in trading capital missing from traders who used MF Global as a prime broker. This is especially felt in the energy and metals markets where MF had such a large presence.
High frequency traders have also decamped for more fertile climes in the oil and foreign exchange markets. And we all know that the big hedge funds are getting redemptions, cutting them off at the knees until January.
I?ll give you a few examples. Falling stock markets almost always produce a rising volatility index. But today it fell as low as 23%, a five month low, and closed at only 25.4% even with the Dow off 66 points. The correlation between stocks and gold has been almost perfect since the summer. But the barbarous relic has been in free fall since yesterday with the S&P 500 essentially unchanged. Ditto with the Euro, which managed a two cent plunge today.
The larger question for traders is whether this is a onetime only breakdown in cross market linkages that will end in January, or is it the beginning of a more permanent continental drift. We will find out next month when the ?A? Team managers return to the market and volume recovers.
Let me toss an alternative theory out there. It appears that the year to date returns for all asset classes are rapidly converging on zero. That?s why assets like gold and silver with the great 12 month returns are having the biggest falls this week. The S&P 500 is now down 2.2% on the year, and the Euro is up a miniscule 1.1%. Gold is still hanging on to a 17% gain, while silver is up only 12%, both rapidly headed towards single digits
Is this the inevitable result of a ?no return? world? Sounds like I better stay out of the market in this performance sapping environment, lest my own profits go up in a puff of smoke.
The ?A? Team Traders Are Gone Until January
https://madhedgefundtrader.com/wp-content/uploads/2019/05/cropped-mad-hedge-logo-transparent-192x192_f9578834168ba24df3eb53916a12c882.png00DougDhttps://madhedgefundtrader.com/wp-content/uploads/2019/05/cropped-mad-hedge-logo-transparent-192x192_f9578834168ba24df3eb53916a12c882.pngDougD2011-12-13 22:12:022011-12-13 22:12:02Cross Market Correlations Are Breaking Down
The volatility index (VIX) is just not buying this sell off. Even with the Dow down over 300 today, the (VIX) has only managed a meager 3% gain on the day. With a move in equities of this magnitude, you would expect volatility to rise by 15% or more. If traders and investors really believed that the risk markets were really going to crash to new lows, they would be paying through the nose to buy downside protection, which would be clearly visible in a (VIX) spike. These figures prove they aren?t.
Let?s do a quickie cross asset class review here and look at what else on the table. The S&P 500 is precisely at the 50% retracement of the entire 200 point move up from October 4. It could hold this level and keep the bull move intact. While junk bonds (HYG) are down, they are nowhere near the levels suggesting that a financial collapse is imminent. Advance decline ratios are at all-time highs, not exactly an argument for a new bear market. Nor are Treasury bonds drinking the Kool-Aide. Sure they are up today, but not as much as they should be.
It all has the makings of an asymmetric trade for me. That means that the next piece of good news will deliver a larger move up than the next piece of bad news will bring a down one. So a tactical long here will bring an outsized returns. It could well be that the failure of the Super committee is fully in the price, and the mere passage of the deadline might bring a big rally. There are certainly a lot of hedge funds looking to chase yearend performance and value players happy to bottom fish to pull this off.
The bulls also have the calendar strongly in their favor. Not only is the November-December period the second strongest bimonthly period of the year, investors are massively underweight equities. As I never tire in explaining to my permabear friends, most investors can?t sell stock they don?t own. That?s why the Armageddon scenario never kicked in during September. That leaves hedge funds and high frequency trading alone to break the downside supports, something they have so far been unable to do alone.
Which girls will get invited to the next dance? The same ones taken to the last one: commodities, energy, rail, coal, and technology stocks, especially Apple, which is sitting bang on its 200 day moving average today.
Of course I could be wrong about all of this. Conditions in the markets are so uncertain here that there are no real high quality trades to be found. Almost everyone is posting negative returns this year, including some of the smartest people I know. That?s why I have pared back my own trading in order to preserve my own 42% year to date gain. But then, I am 75% in cash, so I can afford to take a relaxed view of things.
Only trade here if your wife is pestering you for a larger Christmas shopping budget. Don?t even think about opening up a new short here, because you have already missed the big, easy move. Then again, you could consider getting a new wife. It might be cheaper.
https://www.madhedgefundtrader.com/wp-content/uploads/2011/11/bear.jpg488650DougDhttps://madhedgefundtrader.com/wp-content/uploads/2019/05/cropped-mad-hedge-logo-transparent-192x192_f9578834168ba24df3eb53916a12c882.pngDougD2011-11-21 23:03:332011-11-21 23:03:33Watch Out for the Bear Trap
Legal Disclaimer
There is a very high degree of risk involved in trading. Past results are not indicative of future returns. MadHedgeFundTrader.com and all individuals affiliated with this site assume no responsibilities for your trading and investment results. The indicators, strategies, columns, articles and all other features are for educational purposes only and should not be construed as investment advice. Information for futures trading observations are obtained from sources believed to be reliable, but we do not warrant its completeness or accuracy, or warrant any results from the use of the information. Your use of the trading observations is entirely at your own risk and it is your sole responsibility to evaluate the accuracy, completeness and usefulness of the information. You must assess the risk of any trade with your broker and make your own independent decisions regarding any securities mentioned herein. Affiliates of MadHedgeFundTrader.com may have a position or effect transactions in the securities described herein (or options thereon) and/or otherwise employ trading strategies that may be consistent or inconsistent with the provided strategies.