I am one of those cheapskates who buys Christmas ornaments by the bucket load from Costco in January for ten cents on the dollar because my eleven month return on capital comes close to 1,000%.
I also like buying flood insurance in the middle of the summer when the forecast here in California is for endless days of sunshine.
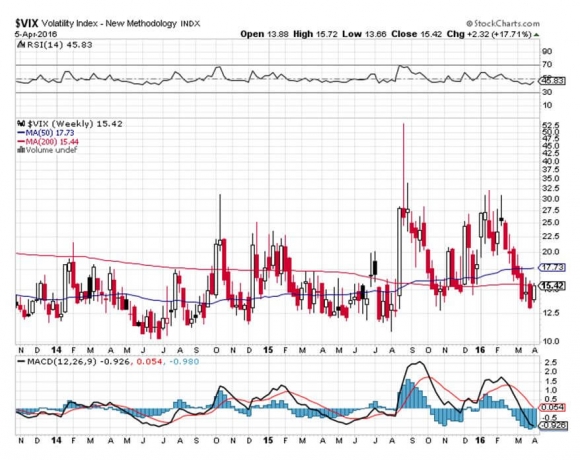
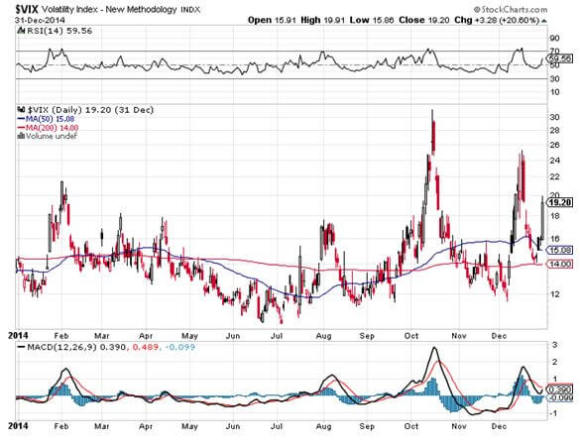
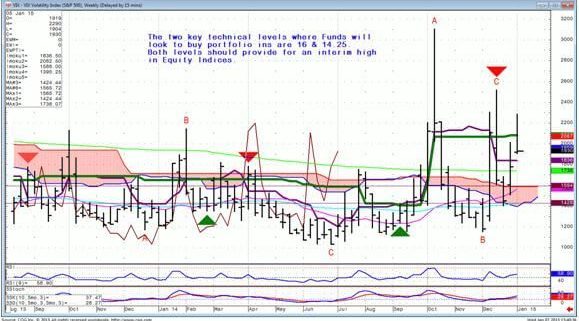
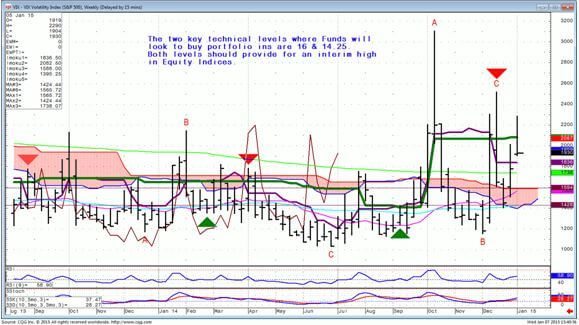
That is what we are facing now with the volatility index (VIX) where premiums have been hugging the 12%-14%% range recently. Get this one right, and the profits you can realize are spectacular.
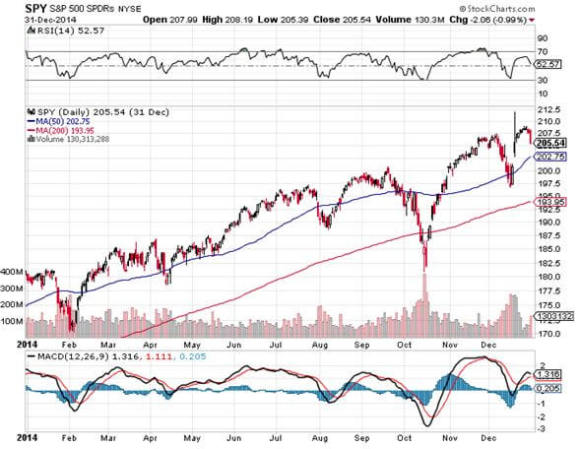
The CBOE Volatility Index (VIX) is a measure of the implied volatility of the S&P 500 stock index, which has been melting since the ?RISK OFF? died a horrible death.
You may know of this from the talking heads, beginners, and newbies who call this the ?Fear Index?. Long-term followers of my Trade Alert Service profited handsomely after I urged them to sell short this index at the heady altitude of 47.
For those of you who have a PhD in higher mathematics from MIT, the (VIX) is simply a weighted blend of prices for a range of options on the S&P 500 index. The formula uses a kernel-smoothed estimator that takes as inputs the current market prices for all out-of-the-money calls and puts for the front month and second month expirations.
The (VIX) is the square root of the par variance swap rate for a 30 day term initiated today. To get into the pricing of the individual options, please go look up your handy dandy and ever useful Black-Scholes equation. You will recall that this is the equation that derives from the Brownian motion of heat transference in metals. Got all that?
For the rest of you who do not possess a PhD in higher mathematics from MIT, and maybe scored a 450 on your math SAT test, or who don?t know what an SAT test is, this is what you need to know. When the market goes up, the (VIX) goes down. When the market goes down, the (VIX) goes up. End of story. Class dismissed.
The (VIX) is expressed in terms of the annualized movement in the S&P 500, which today is at 1,800. So a (VIX) of $14 means that the market expects the index to move 4.0%, or 72 S&P 500 points, over the next 30 days. You get this by calculating $14/3.46 = 4.0%, where the square root of 12 months is 3.46.
The volatility index doesn?t really care which way the stock index moves. If the S&P 500 moves more than the projected 4.0%, you make a profit on your long (VIX) positions.
Probability statistics suggest that there is a 68% chance (one standard deviation) that the next monthly market move will stay within the 4.0% range. I am going into this detail because I always get a million questions whenever I raise this subject with volatility-deprived investors.
It gets better. Futures contracts began trading on the (VIX) in 2004, and options on the futures since 2006. Since then, these instruments have provided a vital means through which hedge funds control risk in their portfolios, thus providing the ?hedge? in hedge fund.
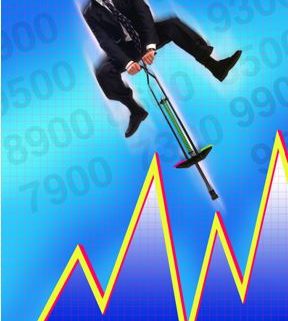
But wait, there?s more. Now, erase the blackboard and start all over. Why should you care? If you buy the (VIX) here at $14, you are picking up a derivative at a nice oversold level. Only prolonged, ?buy and hold? bull markets see volatility stay under $14 for any appreciable amount of time.
If you are a trader you can buy the (VIX) somewhere under $14 and expect an easy double sometime in the coming months. If we get another 10% correction somewhere along that way, that would do it.
If you are a long-term investor, pick up some (VIX) for downside protection of your long-term core holdings. A bet that euphoria doesn?t go on forever and that someday something bad will happen somewhere in the world seems like a good idea here.
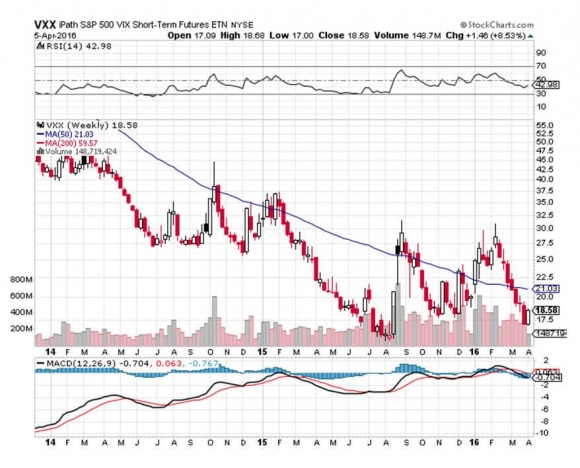
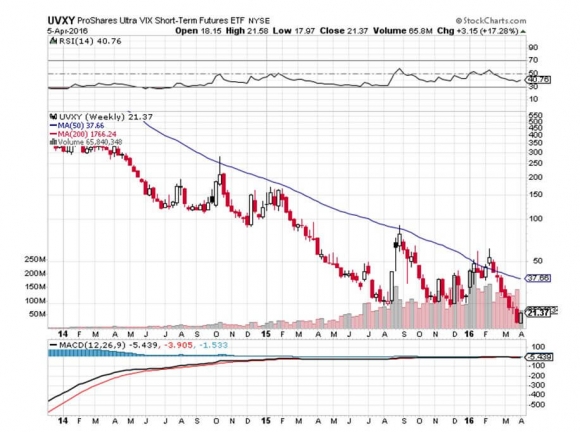
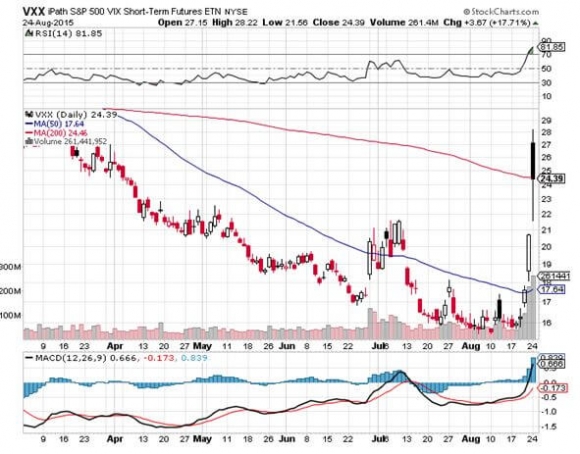
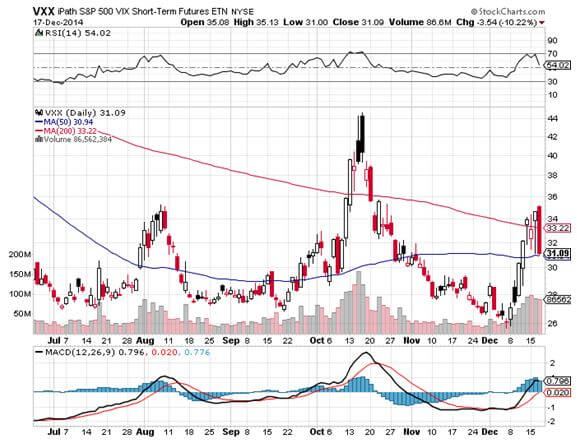
If you don?t want to buy the (VIX) futures or options outright, then you can always buy the iPath S&P 500 VIX Short Term Futures ETN (VXX). Easier still is the (UVXY), which is particularly useful for trading narrow ranges like the one we have had.
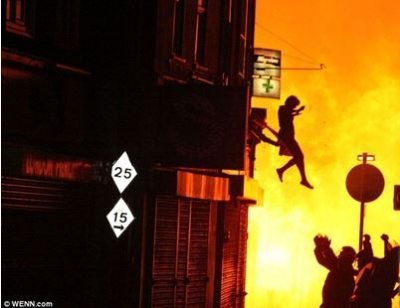
If you lose money on this trade, it will only be because you have made a fortune on everything else you made. No one who buys fire insurance ever complains when their house doesn?t burn down.