• support@madhedgefundtrader.com
  • Member Login
Mad Hedge Fund Trader
  • Home
  • About
  • Store
  • Luncheons
  • Testimonials
  • Contact Us
  • Click to open the search input field Click to open the search input field Search
  • Menu Menu

Tag Archive for: (XLF)

Mad Hedge Fund Trader

Mad Hedge Fund Trader Hurtles to 58%

Diary, Newsletter

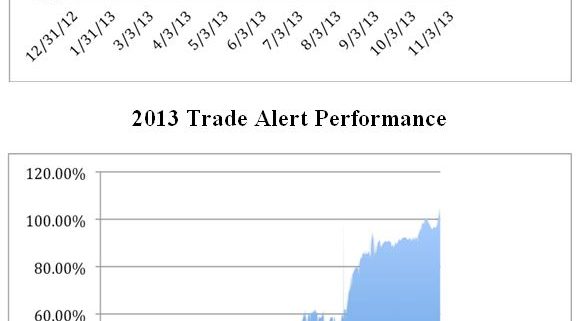
The performance of the Mad Hedge Fund Trader?s Trade Alert Service is still going ballistic, falling just short of a 60% gain for the year last week. Every new subscriber since September has seen 100% of their trades turn profitable. This is your classic ?shooting fish in a barrel? market.

I know guys my age aren?t supposed to be packing in 16-hour workdays. But it?s all worth it when I can level the Wall Street playing field for the individual investor.

Including both open and closed trades, the last 21 consecutive Trade Alerts have been profitable. I am rapidly closing in on old record of 25 successful Trade Alerts, made earlier this year.

The Trade Alert service of the Mad Hedge Fund Trader is now up 58.00% in 2013. The November month to date record is now an enviable 13.54%.

The three-year return is an eye popping 113.05%, compared to a far more modest increase for the Dow Average during the same period of only 32%.
That brings my averaged annualized return up to 38.8%.

This has been the best profit since my groundbreaking trade mentoring service was launched three years ago. These numbers place me at the Mount Everest of all hedge fund managers, where the year to date gains have been far more pedestrian. It seems that their shorts are killing them.

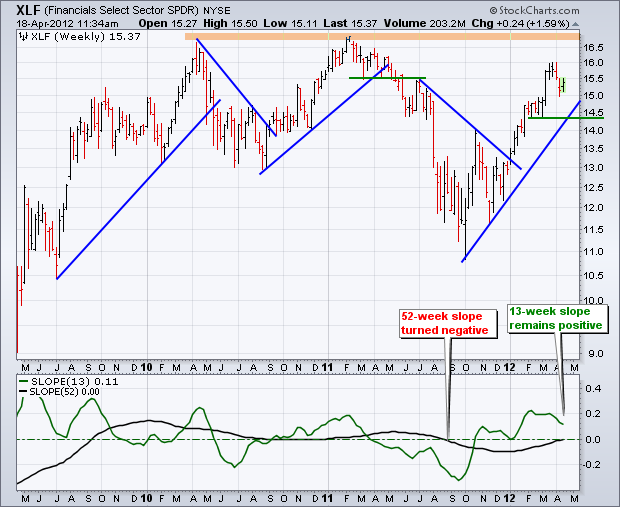
I took profits on my long position in Citigroup (C), which just achieved a major upside breakout, and then rolled the capital into the Financials Select Sector SPDR (XLV). I cashed in on a long position in the Australian dollar (FXA). I also took profits on short positions in the Japanese yen as it approached new lows for the year.

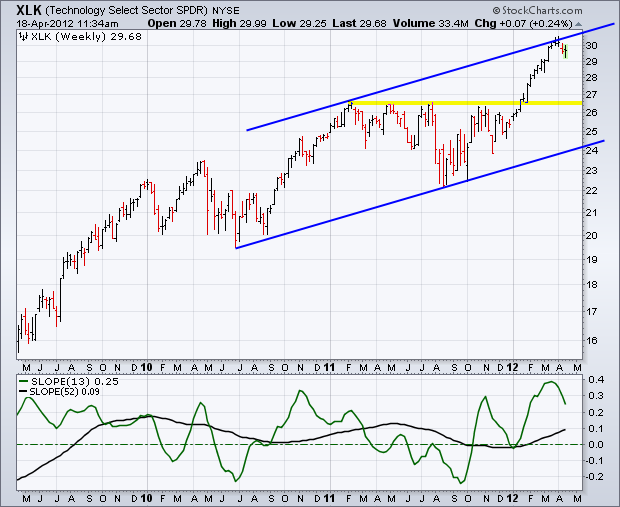
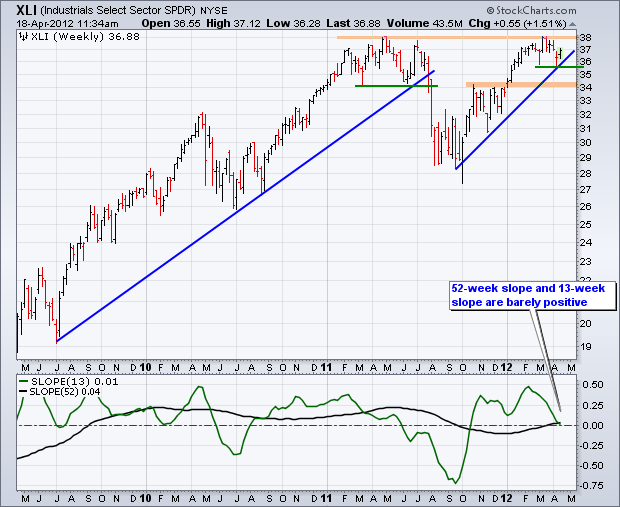
My remaining long positions in Apple (AAPL) and the Industrials Sector Select SPDR (XLI) are contributing daily to my P&L, thank you very much. I am also keeping my short in the Treasury bond market, and will double up on the next ten basis point backup in ten-year rates.

This is how the pros do it, and you can too, if you wish.

Carving out the 2013 trades alone, 74 out of 89 have made money, a success rate of 83%. It is a track record that most big hedge funds would kill for.

My esteemed colleague, Mad Day Trader Jim Parker, has also been coining it. Since April, his own performance numbers have just come back from the auditors, revealing that he is up a staggering 279%.

The coming winter promises to deliver a harvest of new trading opportunities. The big driver will be a global synchronized recovery that promises to drive markets into the stratosphere in 2014. The Trade Alerts should be coming hot and heavy. Please join me on the gravy train. You will never get a better chance than this to make money for your personal account.

Global Trading Dispatch, my highly innovative and successful trade-mentoring program, earned a net return for readers of 40.17% in 2011 and 14.87% in 2012. The service includes my Trade Alert Service and my daily newsletter, the Diary of a Mad Hedge Fund Trader. You also get a real-time trading portfolio, an enormous trading idea database, and live biweekly strategy webinars.? Upgrade to?Mad Hedge Fund Trader PRO?and you will also receive Jim Parker?s?Mad Day Trader?service.

To subscribe, please go to my website at www.madhedgefundtrader.com, find the ?Global Trading Dispatch? box on the right, and click on the lime green ?SUBSCRIBE NOW? button.

TA Performance

C 11-22-13

XLF 11-22-13

FXY 11-22-13

BusinessJohnThomasProfileMap2-2

https://www.madhedgefundtrader.com/wp-content/uploads/2013/11/TA-Performance.jpg 824 577 Mad Hedge Fund Trader https://madhedgefundtrader.com/wp-content/uploads/2019/05/cropped-mad-hedge-logo-transparent-192x192_f9578834168ba24df3eb53916a12c882.png Mad Hedge Fund Trader2013-11-25 01:04:012013-11-25 01:04:01Mad Hedge Fund Trader Hurtles to 58%
Mad Hedge Fund Trader

Taking Profits on Citigroup

Newsletter

I have discovered a correlation in the market that you can use for the rest of this year, for all of 2014, and probably for the next 20 years. Whenever the Treasury bond market (TLT) takes a dive, bank shares rocket. This is a particularly happy discovery, as my model-trading portfolio is long bank shares and short the Treasury bond market.

By buying bank shares here you are playing the second derivative of the short bond trade. Banks are about to go from being less profitable to more profitable during a falling bond, rising interest rate environment. Every trader on the street knows this, hence the sudden renaissance of the financials.

Take a look at the charts below prepared by my friends at Stockcharts.com. They show that after tracking nicely with the S&P 500 for most of the year, Financials suddenly started to drastically lag the market in October. That was on the heels of the bond market rally triggered by the Federal Reserve?s failure to taper in September.

Fast forward to two weeks ago, when I correctly called the top of the bond market and started slamming out the Trade Alerts to buy puts as fast as I could write them. Since November 1, financials have become the top performing sector of the market, and it is dragging the (SPY) upward kicking and screaming all the way.

I?ll tell you what is happening here. Traders are dumping story driven momentum stocks like Tesla (TSLA), and piling into the biggest lagging sectors for fresh meat. The dive in Treasuries gave them all the excuse they needed. That?s why the Financial Select Sector SPDR ETF (XLF) has bolted out of nowhere to a new five year high. The same is also true for Wells Fargo (WFC) and our favored Citigroup (C).

The financials rally could continue until the sector becomes overbought relative to the rest of the market, which could be well into next year. And yes, before you ask, that includes Morgan Stanley (MS) and Goldman Sachs (GS), which are really more structured like banks now in the wake of the Dodd Frank bill.

So I am going to take profits here on my existing long position in the Citigroup (C) December $45-$47 bull call spread. With the shares now trading just short of $52, we are now too far in-the-money to get much further benefit from a continued appreciation. Better to go into cash now, so I can reload on the next dip, which could happen next week.

We grabbed 80% of the potential profit holding the position a mere seven trading days. This is my 15th consecutive closing Trade Alert, and the 20th including my remaining open profitable positions. I have only six more to go until a break my previous record of 25. It doesn?t get any better than this.

Time to enter more bids on eBay for Christmas presents. That black Chanel Classic handbag with gold trim is looking pretty good. Do you think a new Brioni suit will fit into Dad?s stocking over the fireplace? Santa?.hint, hint!

C 11-21-13

XLF 11-21-13

WFC 11-21-13

JPM 11-21-13

XLF 11-21-13

$DJUSBK 11-21-13

Citibank

https://www.madhedgefundtrader.com/wp-content/uploads/2013/11/Citibank.jpg 361 545 Mad Hedge Fund Trader https://madhedgefundtrader.com/wp-content/uploads/2019/05/cropped-mad-hedge-logo-transparent-192x192_f9578834168ba24df3eb53916a12c882.png Mad Hedge Fund Trader2013-11-22 01:05:432013-11-22 01:05:43Taking Profits on Citigroup
Mad Hedge Fund Trader

Loading Up On the Financials

Newsletter

After ignoring the financial sector for most of the year, I am more than happy to jump into it here. The sector has been a serious laggard for the past three months, trailing the front-runners I picked in technology, industrials, health care, and consumer cyclicals. After chasing these favorites, traders are now looking for new fresh meat to devour.

No one would touch financials with a bargepole while interest rates were falling. This is because banks are most profitable when short-term interest rates, where they borrow, are low, while longer-term rates that they lend at, are rising. Falling interest rates make financials a no go area. They have done so with a vengeance after the September Federal Reserve decision not to taper its quantitative easing program.

Two weeks ago interest rates bottomed and began a rapid upswing, which I believe could last many months. We could even see ten-year Treasury bonds rebound from the recent 2.47% low back up to 3.0% by year-end, and 4.0% by the end of 2014.

That?s why I called the top of the bond market two weeks ago and showered you with a machine gun succession of Trade Alerts to go short Treasuries, all of which became immediately profitable. Those who followed my advice soon found money raining down upon them.

By buying bank shares here you are playing the second derivative of the short bond trade. Banks are about to go from being less profitable to more profitable during a falling bond price, rising interest rate environment. I have published three books on this topic, so believe me, I know. Every trader on the street understands this, hence the sudden renaissance of the financials.

I picked Citibank (C) because I know the former CEO, Vikram Pandit, well having worked with him for a decade at Morgan Stanley (MS). That relationship gave me unequaled access to the inner workings of this financial institution.

Citibank is not the target of multiple government civil and criminal prosecutions, as JP Morgan (JPM) has become, thanks to the London whale incident. They also do not suffer from the legacy problems bedeviling Bank of America (BAC), which they stepped into with their multiple acquisitions during the financial crisis.

Citibank also sponsors that really cool bike sharing program in Manhattan, called, what else, Citibike.

There is another method to my ?Madness? here. Take a look at the six-month chart for (C) shares. It shows absolute rock solid support at the $47.40 floor. That makes the Citicorp December $45-$47 bull call spread a complete no-brainer.

If you don?t like Citibank you can caste a wider net and buy the Financial Select Sector SPDR ETF (XLF). You can click here to find the precise index makeup and the fund details. Berkshire Hathaway is the largest holding, with an 8.18% weighting, while Citibank is the fifth largest holding with a 6% weighting.

C 11-13-13

XLF 11-8-13

TNX 11-13-13

CitibikeBut Will It Take Me to a Great Trading Year?

https://www.madhedgefundtrader.com/wp-content/uploads/2013/11/Citibike.jpg 312 467 Mad Hedge Fund Trader https://madhedgefundtrader.com/wp-content/uploads/2019/05/cropped-mad-hedge-logo-transparent-192x192_f9578834168ba24df3eb53916a12c882.png Mad Hedge Fund Trader2013-11-14 01:04:302013-11-14 01:04:30Loading Up On the Financials
DougD

Check Out These Interesting Charts

Newsletter

I ran through a number of charts provided by my friends at Stockcharts.com, and as a person who has been piling on the shorts for the past two weeks I was greatly encouraged. Almost every single one was pregnant with gloomy implications. This is all happening a mere 12 days before the Great Escape in May commences. Virtually every technical indicator I follow is now flashing warning signs and ringing alarm bells.

Here is my own personal interpretation. The Russell 2000 (IWM) could potentially be setting up a head own shoulder top targeting $75 on the downside. My short here is one of my biggest positions. The Consumer Discretionary Select SPDR (XLY) is pulling away from the absolute top end of its upward channel and is ripe for a 10% pullback. Ditto for the Technology Select Sector SPDR (XLK), which could give back 15%. The Financials Select Sector SPDR (XLF), one of the hottest areas this year, could actually be setting up a new downtrend. The same is true for the Materials Select Sector SPDR (XLB). And tell me that is not a double top in the Industrials Select Sector SPDR (XLI).

This all suggests that 1,325 for the S&P 500 is a chip shot on the downside, and maybe more. I have a feeling that killings are about to me made on the short side.


https://madhedgefundtrader.com/wp-content/uploads/2019/05/cropped-mad-hedge-logo-transparent-192x192_f9578834168ba24df3eb53916a12c882.png 0 0 DougD https://madhedgefundtrader.com/wp-content/uploads/2019/05/cropped-mad-hedge-logo-transparent-192x192_f9578834168ba24df3eb53916a12c882.png DougD2012-04-18 23:02:122012-04-18 23:02:12Check Out These Interesting Charts
Page 4 of 41234

Legal Disclaimer

There is a very high degree of risk involved in trading. Past results are not indicative of future returns. MadHedgeFundTrader.com and all individuals affiliated with this site assume no responsibilities for your trading and investment results. The indicators, strategies, columns, articles and all other features are for educational purposes only and should not be construed as investment advice. Information for futures trading observations are obtained from sources believed to be reliable, but we do not warrant its completeness or accuracy, or warrant any results from the use of the information. Your use of the trading observations is entirely at your own risk and it is your sole responsibility to evaluate the accuracy, completeness and usefulness of the information. You must assess the risk of any trade with your broker and make your own independent decisions regarding any securities mentioned herein. Affiliates of MadHedgeFundTrader.com may have a position or effect transactions in the securities described herein (or options thereon) and/or otherwise employ trading strategies that may be consistent or inconsistent with the provided strategies.

Copyright © 2026. Mad Hedge Fund Trader. All Rights Reserved. support@madhedgefundtrader.com
Scroll to top