Global Market Comments
May 20, 2020
Fiat Lux
Featured Trade:
(THE HYPER-ACCELERATION OF 5G)
(AMZN), (5G), (CCI), (MSFT), (NFLX), (APPL)

Global Market Comments
May 20, 2020
Fiat Lux
Featured Trade:
(THE HYPER-ACCELERATION OF 5G)
(AMZN), (5G), (CCI), (MSFT), (NFLX), (APPL)
I will explain to everyone why a wonky side effect of coronavirus is supercharging the 5G revolution.
Market valuations reflect the state of expected future cash flows in a company.
Under this assumption, some could argue that most tech companies with staying power are almost a good buy at any price.
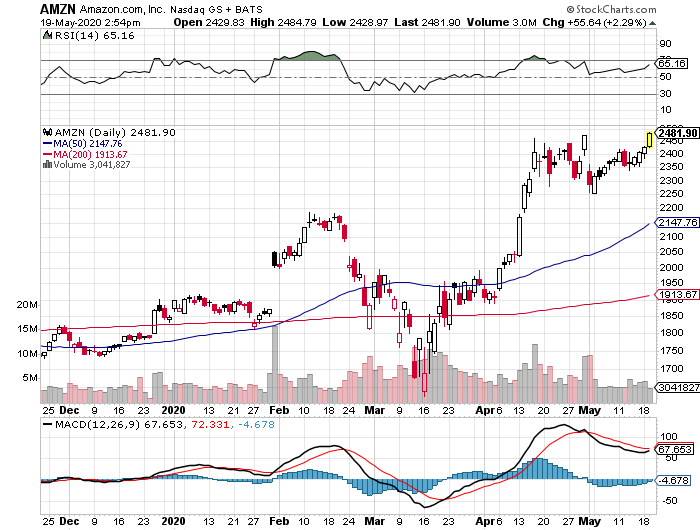
No-brainers would include a list of Microsoft, Amazon, Apple, and Netflix.
The health scare and the carnage associated with it has brought forward the tech industry as a whole to the forefront of the global economy.
When you mix that with the Fed hellbent on saving everything that has a heartbeat, it sets up conditions for heavy buying in an industry that is going to be king of the global economy anyway.
It is not a question of if, but when and the health phenomenon has accelerated the dramatic migration to tech by showing how business will be conducted in about 15 years.
The change took place in a blistering 4 weeks.
The clearest signal of who is really calling the shots in the equity market is looking at which companies are dragging it up.
Technology is shouldering the responsibility of the equity market by outperforming the broader market with many software companies’ share price higher than before the crisis.
For every Amazon or Microsoft, there is also a Macy’s or JC Penny showing that this is really a stock pickers market.
We have not only learned that tech companies are critical to our functioning as a society, but that large tech companies will be even more central than before even if they are currently losing gross revenue.
The relative gains to tech stemming from the coronavirus are equal or greater than an innovation of a game-changing product and will double the effect of 5G.
We are setting up for the Golden Age of 5G with tech poised to invade even more of the broader equity market.
One rough estimate notes that the 5G industry is expected to add about $40bn in incremental revenue to the semiconductor industry, add 5X growth in mobile data monthly traffic by 2024, and a $4.2tn boost to global economies from revenue streams connected to 5G in the next ten years.
I do agree that currently, the network effect is working in reverse order, but the positive force multiplier, when the economy is riding high again cannot be emphasized enough.
Digital revenue streams will effectively be pumped into every nook and crevice of the digital economy because of current modifications to the business environment.
When business does come back online, investors of physical assets will sell what they can at discounted prices to get into the digital ecosystem causing asset prices to explode as investors chase prices to the sky.
Do you remember commercial real estate guru and Colony Capital’s CEO Tom Barrack?
The company hoped to sell as much as 90% of its $20 billion property portfolio of hotels, warehouses, and other commercial real estate by the end of 2021.
They are also another big investor in nursing homes.
A real-estate pioneer who founded Colony in the early 1990s and is the firm’s chief executive and executive chairman, Barrack said he wanted to go “all digital.”
Rejigging the 29-year-old investment company represented an extreme response to the way technologies have been dismantling cash flow for almost every type of commercial real estate, and Barrack was met with fierce backlash from entrenched stakeholders regarding the new direction.
Commercial real estate and hotel operators have had to fight against the triple whammy of office sharing WeWork, short-term hotel platform Airbnb, and the coronavirus - a lethal three-part cocktail of malicious forces to the “traditional” model.
The coronavirus has proven Barrack was spot on with his synopsis, but he wasn’t able to get rid of Colony’s inventory of commercial real estate in the expeditious way he desired.
Other companies have taken a direct hit like 24 Hour Fitness who is pondering filing for bankruptcy, but I could say the same for a slew of companies like Colony Capital.
Another key manifestation of the current economic malaise is that regulators, antitrust, tax, foreign, and all of the above are less likely to disrupt big tech companies moving forward considering they may be the only ones able to get us out of a similar crisis in the future.
Government officials will be under rapid pressure to boost GDP levels and crimping big tech is counterintuitive to this overall goal.
I don’t agree with the glass half empty crowd who believe Amazon needs to be clamped down because of dominating retail during the time of the virus - if Amazon didn’t exist, the panic could have accelerated to an uncontrollable level creating anarchy in the streets.
The big boys have pushed soft power as a legitimate policy tool with Apple sourcing over 20 million face masks and is now building and shipping face shields.
Big tech is becoming like a mini-government in its own right.
Granted that thousands of bankruptcies from restaurants, nail salons, and yoga studio will be swept into the dust bin of economic history, but once the next iteration of the economic cycle turns up, tech is about to go gangbusters in a way many never thought imaginable.
Then if you bake a little 5G into the pecan pie, investors are justified to be salivating about the tech industry’s prospects.
Any deep-pocketed investors should be cherry-picking every quality 5G tech play possible because they will be the most supercharged sub-sector of tech once the economy is reset.
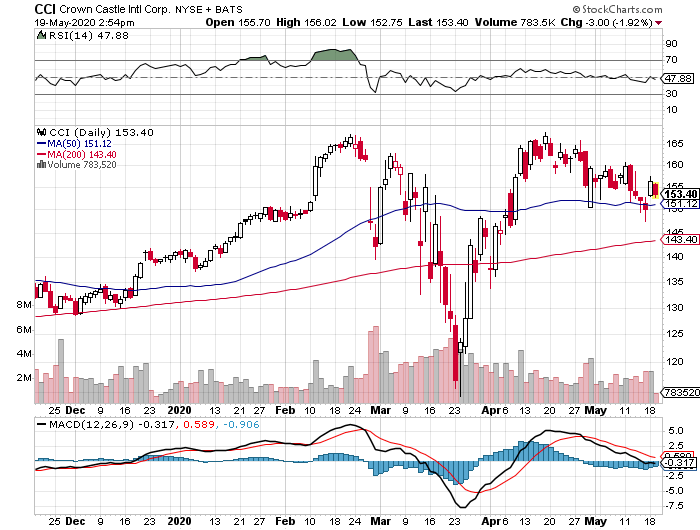
Any long-term investor with a pulse should buy Crown Castle International Corp. (REIT) (CCI) on any and all dips.
They are the largest owner of cell towers owning over 40,000 in the U.S.
Global Market Comments
May 19, 2020
Fiat Lux
Featured Trade:
(THE 2020 DARK HORSES OF BIOTECH)
(AMRN), (THOR), (SAN), (NBSE), (OHRP),
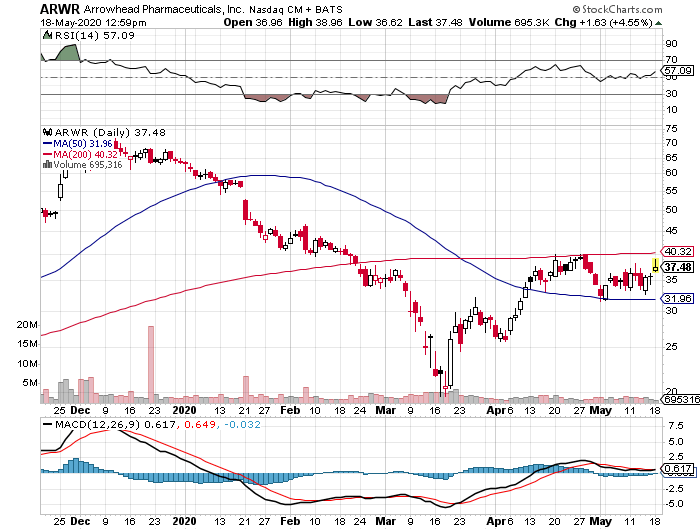
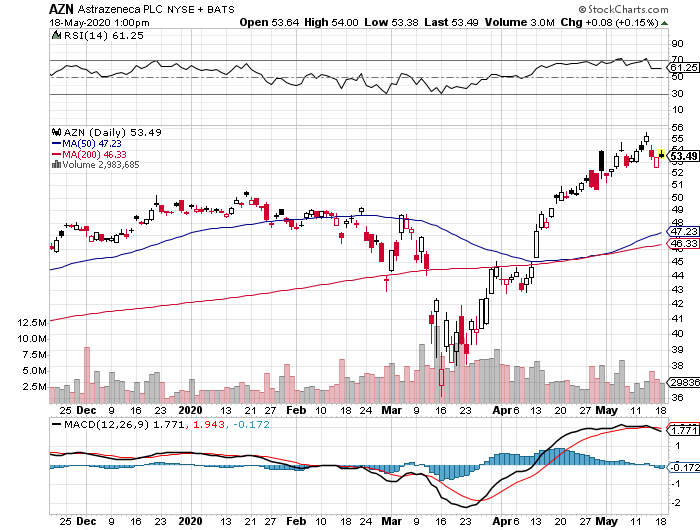
(MRNA), (MRK), (AZN), (VRTX), (RGLS), (ARWR)


One of our dark horses came in a big winner this morning.
No, I did not go to the Golden Gate Fields race track on San Francisco Bay and win big on a horse with 5:1 odds, although I might as well have.
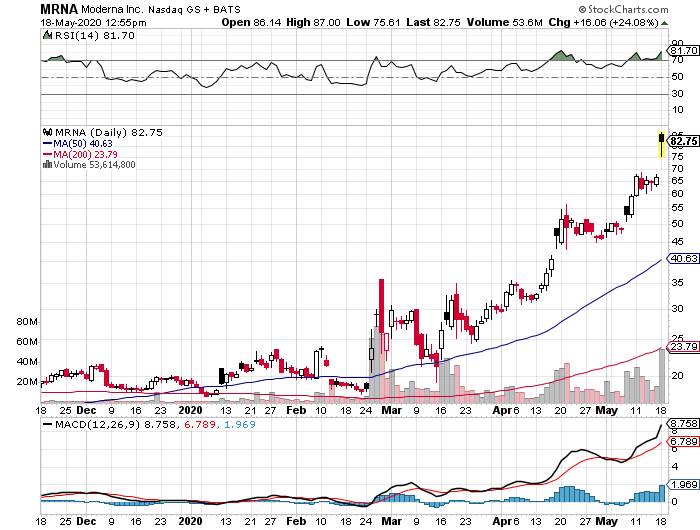
Moderna (MRNA) soared to $85 this morning on news of a successful trial of a new Covid-19 vaccine. We recommended it on January 19 at $17.78 for precisely this reason.
Never mind that the trial only involved a mere eight patients, involved RNA, and won’t be available in bulk for two years. That’s all the market wants to hear today.
So, if you are interested in playing the long shot game, I am re-running my January 9 research piece, which was sent out to paid subscribers of the Mad Hedge Biotech & Healthcare Letter. If you want to subscribe to the letter, which has been pulling in long shots on a weekly bases recently, please click here.
For all the flak the healthcare sector has received for the exorbitant prices of its products and services, there’s no denying the fact that this industry had an incredibly remarkable decade -- and biotechnology proved to be one of the most lucrative markets when it comes to stocks that actually double or triple in value, sometimes even overnight.
The primary reason for this is that no one could predict the success or failure of clinical trials with any degree of accuracy, forcing investors to take into account elements of surprise in the valuation process in biotech.
Companies that analysts believe to be prime candidates for acquisition early on in their life cycle would end up repeatedly failing to lure viable tender offers for years. Meanwhile, dark horses emerge from the leftfield and snap up the best deals.
A good case in point would be how experts and investors alike missed the mark on Amarin Pharmaceutical’s (AMRN) cardiovascular treatment Vascepa. On the outset, analysts pegged the new prescription omega-3 treatment as a failure and a money sinkhole.
Instead, Vascepa surpassed all expectations and is now hailed as the fish oil supplement to demonstrate clear-cut cardiovascular benefits to high-risk heart attack patients.
In 2019 alone, Vascepa grew by 85% compared to its 2018 report, coming in between $410 million and $425 million in sales -- and 2020 is expected to be an even better year for this drug as sales are estimated to reach between $650 million and $700 million.
Another example is synthetic protein maker Synthorx (THOR), which was initially tagged as an ominous stock.
The company proved detractors wrong when it went on to fetch huge offers from giant biotech firms, with Sanofi SA (SAN) winning the bidding war over Synthorx to the tune of $2.5 billion.
This new year, though, promises to offer more predictability, especially on the merger and acquisition front.
Several blue-chip biotechs are on the verge of key patent expirations in the next decade. On top of that, these companies are facing tremendous pressure from US politicians to cut down on the prices of their brand name drugs. Today, the State of California announced that it was going into the generic drug industry to undercut the majors.
These dual headwinds are expected to fuel an uptick in the demand for bolt-on acquisitions, which can provide the giant biotechs with healthy levels of profit via large sales volumes as they attempt to slash their slashes to acceptable levels.
With this in mind, big biopharmas will be willing to shell out top dollar to acquire promising companies this 2020.
Which biotechs have the goods to take full advantage of this acquisition demand?
One up and coming company tagged as a red-hot acquisition candidate is NeuBase Therapeutics (NBSE).
Founded in 2018, this Pittsburgh company has raked in $9 million in funding so far to develop treatments that target rare, genetic neurological disorders. Neubase’s platform called peptide-nucleic acid antisense oligonucleotide or PATrOL technology was developed at Carnegie Melon University.
Basically, this technology offers gene-silencing therapies for its patients suffering from rare genetic disorders.
In July 2019, NeuBase engaged in a reverse merger with fellow biotech innovator Ohr Pharmaceuticals (OHRP). This partnership is expected to rake in massive rewards since both companies greatly complement each other’s work.
NeuBase’s work zeroes in on curing rare genetic diseases via gene-silencing treatments while Ohr’s research is geared towards helping patients suffering from cancer cachexia and macular degeneration.
The combined efforts of these two should result in a wider reach as they offer cutting edge treatments to highly lucrative and specialized markets.
As of December 2019, NeuBase has a recorded market cap of $114.38 million. Considering all its assets and the way its pipeline is shaping up, NeuBase could easily be your best sleeper stock in 2020.
Another biotech company to watch out for this year is Moderna Inc (MRNA), which has raised a whopping $1.8 billion in funding over 10 rounds.
So far, this company has attracted blue-chip companies in the form of Merck and Co (MRK), which invested $125 million, and AstraZeneca (AZN) with $474 million so far.
In terms of stability, Moderna has been doing quite well for itself with $68.2 million in estimated annual revenue.
In 2019, Moderna shared that it has at least 11 programs set for clinical trials along with 20 development candidates. Its research leans towards producing cancer vaccines and localized regenerative therapeutics.
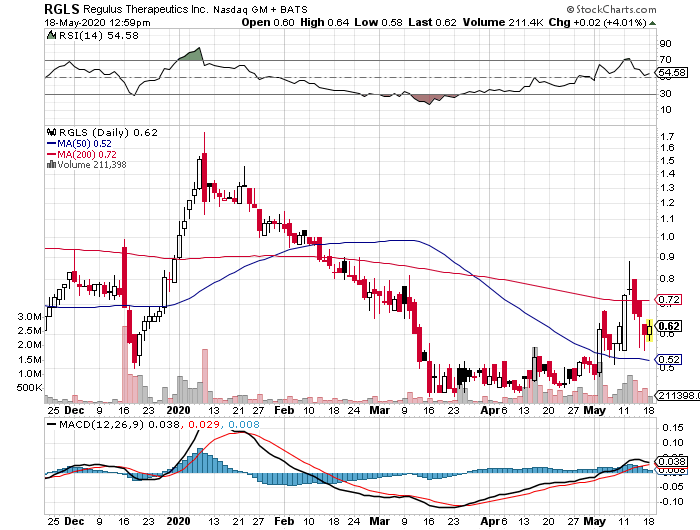
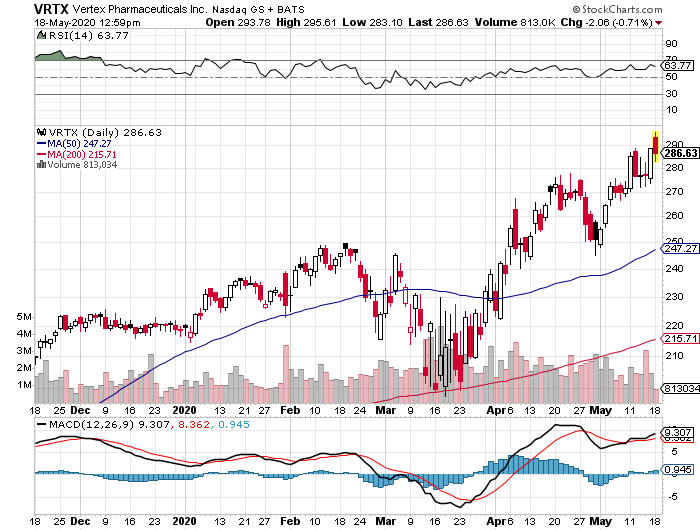
Its strategic alliances not only with AstraZeneca and Merck but also with Vertex Pharmaceuticals (VRTX), Biomedical Advanced Research and Development Authority, and even the Bill & Melinda Gates Foundation equip Moderna with a remarkable competitive edge against rivals Regulus Therapeutics (RGLS), Arrowhead Pharmaceuticals (ARWR), and CureVac.
I’m expecting huge movements in the biotech market in 2020 as the curtain rises on all these promising technologies and the rise of this industry becomes impossible to ignore.


“A market has never before come out of a recession with stocks at peak earnings multiples,” said Jonathan Golub, Chief Equity Strategist at Credit Suisse.

Global Market Comments
May 18, 2020
Fiat Lux
Featured Trade:
(MARKET OUTLOOK FOR THE WEEK AHEAD, or THE MARKET IS BRACKETED)
(SPY), (TLT), (VIX), (DIS)

We are all living the Bill Murray movie “Groundhog Day” over and over again. Every day seems to blend seamlessly into the next, ad infinitum.
I think it’s Monday, but I’m not sure. The stock market is open so that must mean it’s Monday to Friday. The trash goes out tomorrow, so it might be Tuesday. No, wait! CBS 60 Minutes was on last night, so it has to be Monday. Maybe.
When a Marine Corp 60mm mortar team zeros in on a target, it is said to be “bracketed.” No matter which way the enemy goes, he gets blown up.
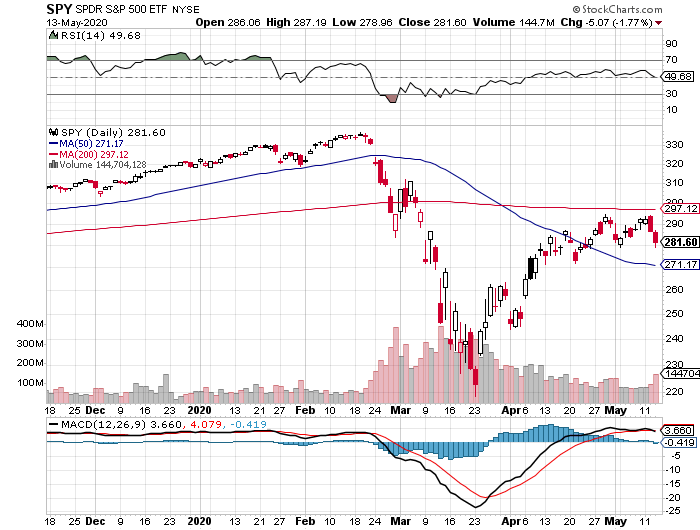
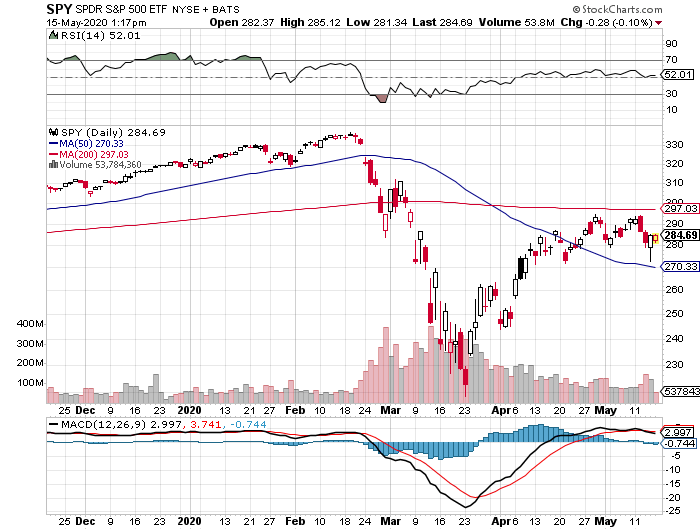
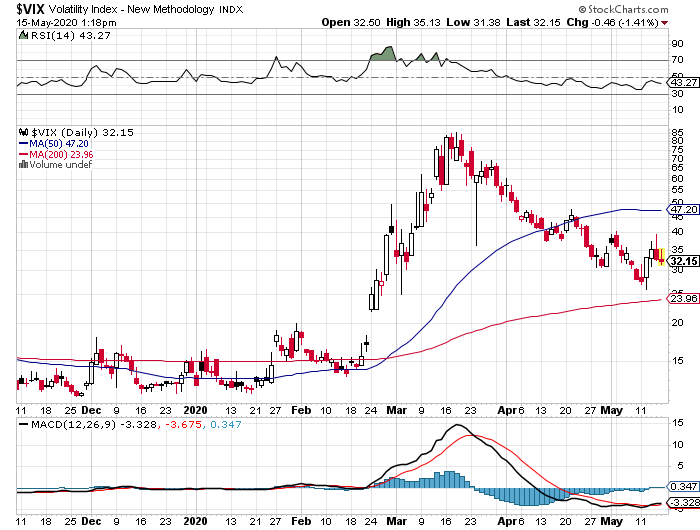
The S&P 500 is now “bracketed”.
If it falls, the support of the free Fed put option kicks in to limit the damage via QE infinity. If the market tries to rally, it is capped by the worst economic data in history, last week joined by a new trade war with China.
Who is the enemy that gets destroyed in this military metaphor? Anyone betting on an imminent upside or downside breakout, especially those who are long the Volatility Index (VIX).
That means the thousands who follow the Mad Hedge Fund Trader have just been given a money-printing machine, a new rich uncle.
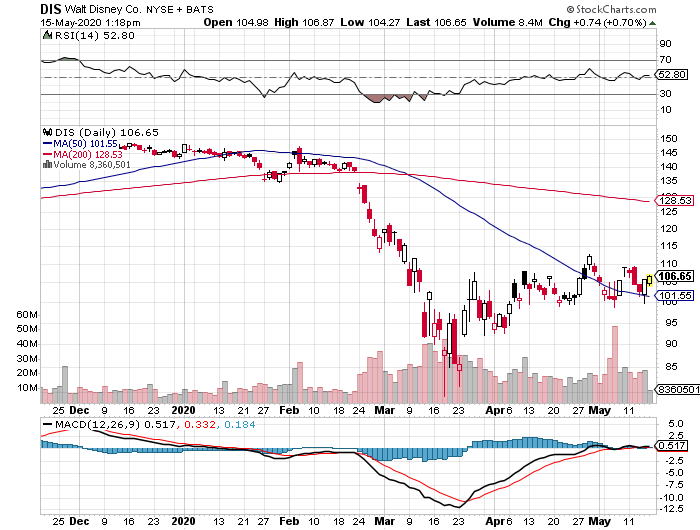
For every time the market rallies, you simply buy a vertical bear put option spread in the front month with strikes prices well outside the bracketed area as I did last week with (DIS). When it dives, you strap on vertical bull call spreads, as I did last week with the (DIS) and the (SPY). Then you laugh all the way to the bank.
We could be bracketed a long time. The early data from opening-up states is that consumers returning to stores only amounts to a ruinous 7% of pre-pandemic levels. That suggests the Unemployment Rate will soar to 30% or more before it peaks, exceeding the Great Depression apex. There are easily another 10 million that haven’t been counted yet because the state benefit processors are so slow.
However, as long as we are bracketed, I reckon I can make 10% a month, as I already have done from the Middle of April and in May.
It is not a riskless strategy.
The day an actual vaccine is announced, the market Dow Average could soar by 3,000 points in a day, wiping out the shorts. The White House has been declaring this on a daily basis. But until we get a vaccine the market believes, we will remain bracketed. That could take years, if ever.
Dr. Fauci triggered a 1,000-point market dive with his sobering analysis of the course of the pandemic in the coming months. Don’t count on going back to school in the fall.
No “V” for the economy, said the Fed. The job losses are a complete economic disaster that will take years to recover from. That’s the opinion of Minneapolis Federal Reserve Bank President Neel Kashkari. The president just said Corona deaths will reach 100,000. Buzzkill. Do you think the stock market will notice?
Fed funds futures are discounting negative interest rates in a year. They say they don’t want negative rates but may not have a choice. The markets may go there without them. The disruptions to the financial service will be enormous. Do you really want to pay the bank to deposit your hard-earned money?
Fed Governor Powell warns the worst is yet to come, and the need for more stimulus is paramount. However, negative interest rates which failed in Europe and Japan won’t work here either. The problem is rampant fear, not the overnight cost of funds.
Weekly Jobless Claims are still soaring, up 3 million on the week to 36.5 million. It’s going to get worse before it gets better. The Fed is targeting a peak of 36.5 million. Connecticut is the worst-performing state, California the best.
Stan Druckenmiller says stocks are the most overvalued in his career, says my former client, one of the best traders in the market. My friend David Tepper says they’re the most expensive since 1999. It may be splitting hairs, but how much do you want to own here? Keep those shorts!
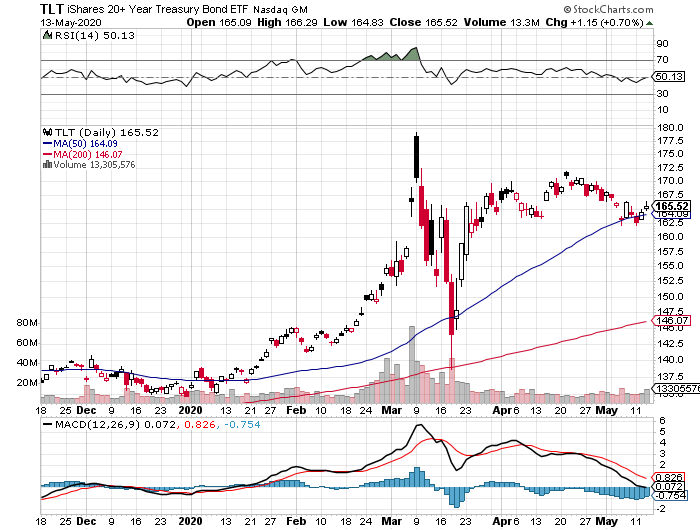
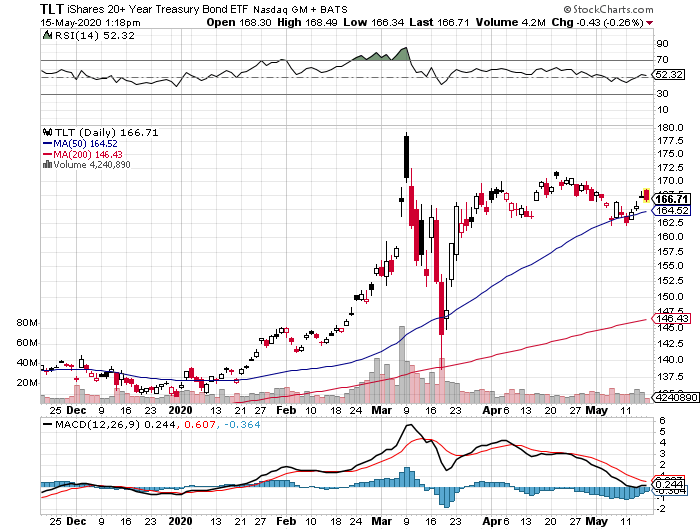
Another death knell for US Treasury bonds (TLT) as the April budget deficit soars to $738 billion. That is an $8.85 trillion annual rate. Overissuance is about to destroy deflation big time.
Retail Sales collapse by 16.4%, the worst on record in another Great Depressionary data release. The stock market is starting to lean towards a view that the economy will take years to recover, not months. I’m somewhere in the middle.
A new trade war with China heats up, with the president banning more export items, especially chips for telecom giant Huawei. I guess our economy isn’t bad enough. Knock another few thousand off the Dow.
When we come out on the other side of this, we will be perfectly poised to launch into my new American Golden Age, or the next Roaring Twenties. With interest rates at zero, oil at $0 a barrel, and many stocks down by three quarters, there will be no reason not to. The Dow Average will rise by 400% or more in the coming decade.
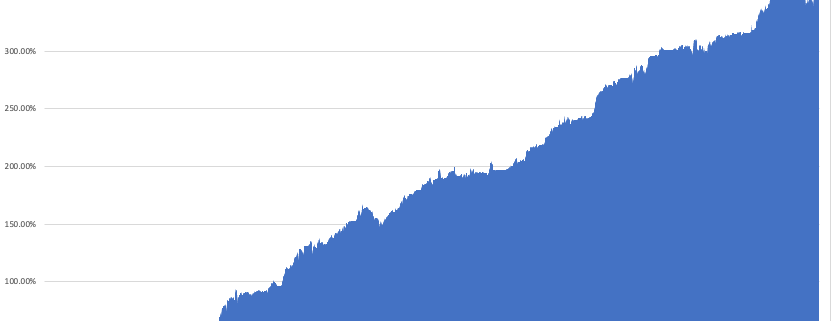
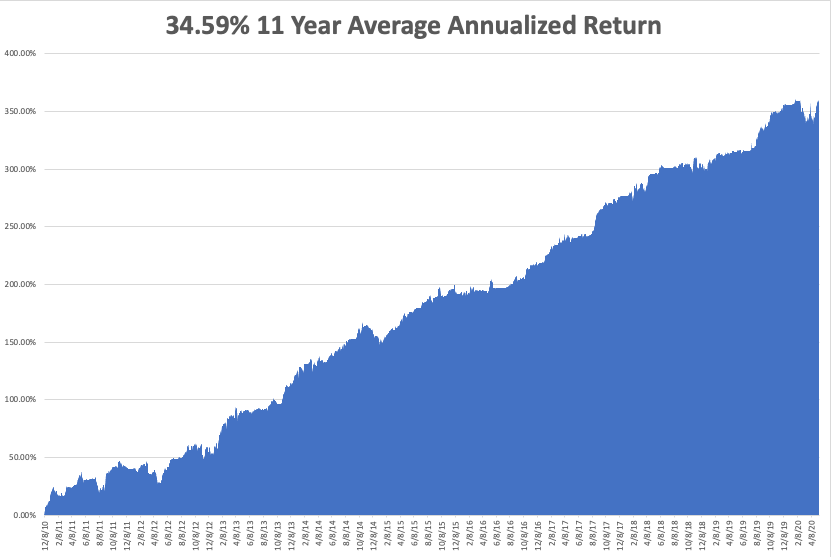
My Global Trading Dispatch performance had another fabulous week, up an awesome +11.26%, and blasting us up to a new eleven-year all-time high of 20%. It has been one of the most heroic performance comebacks of all time.
My aggressive short bond positions gave back some money on the ‘RISK OFF” posture for the week. However, we offset those losses and a lot more on longs in bonds and shorts in the (SPY) and Walt Disney (DIS).
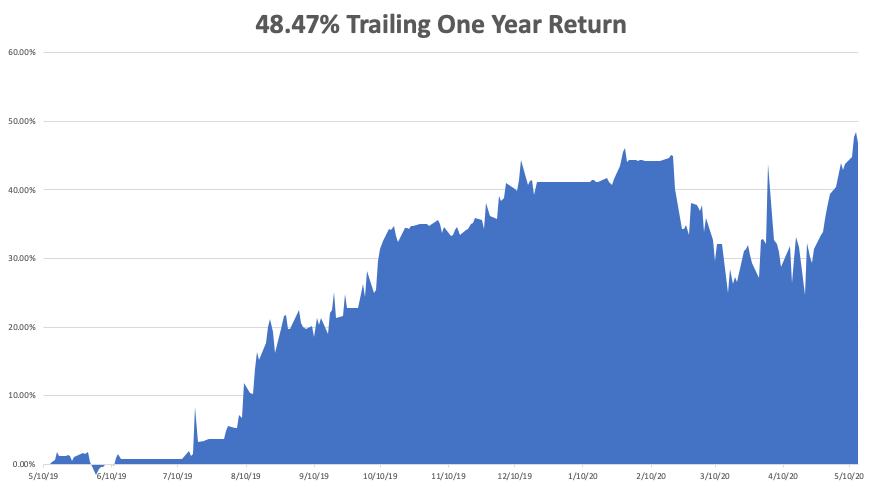
That takes my 2020 YTD return up to +7.29%. That compares to a loss for the Dow Average of -16.89%. My trailing one-year return exploded to 48.47%. My eleven-year average annualized profit returned to +34.59%.
The only numbers that count for the market are the number of US Coronavirus cases and deaths, which you can find here.
On Monday, May 18 at 10:00 AM, the NAHB Housing Market Index for May is released.
On Tuesday, May 19 at 8:30 AM, US Housing Starts for April are printed. Home Depot (HD) and Walmart (WMT) report.
On Wednesday, May 20, at 10:30 AM, weekly EIA Crude Oil Stocks are published. Target (TGT) and Lowes (LOW) report.
On Thursday, May 21 at 8:30 AM, Weekly Jobless Claims are announced. NVIDIA (NVDA) reports.
On Friday, May 22, the Baker Hughes Rig Count follows at 2:00 PM. Alibaba (BABA) reports.
As for me, I am headed back up to Incline Village, NV, a town completely free of Covid-19. The village is thinking of barring entry to all non-residents. Maybe it’s the fresh air.
Stay healthy.
John Thomas
CEO & Publisher
The Diary of a Mad Hedge Fund Trader
Global Market Comments
May 15, 2020
Fiat Lux
Featured Trade:
(WHY CONSUMER STAPLES ARE DYING),
(XLP), (PG), (PEP), (PM), (WMT), (AMZN),
(WHY YOUR OTHER INVESTMENT NEWSLETTER IS SO DANGEROUS)

Global Market Comments
May 14, 2020
Fiat Lux
Featured Trade:
(TEN UGLY MESSAGES FROM THE BOND MARKET),
(TLT), (TBT), (USO), (GLD), (GS), (SPY)


The global bond markets have been screaming an ugly message at us loud and clear, and I’m afraid that it’s not a positive one.
Amazingly, US Treasury bonds have soared early this year, taking the (TLT) up a stunning 40 points.
In the meantime, stocks have suffered the sharpest crash in history, plunging ten times faster than the worst days of the 1929 crash, down 37%.
The implications for your investment portfolio are so momentous and far-reaching that I am going to have to list them one by one.
Read them and weep:
1) The US is in a severe depression.
2) The pandemic is not even close to ending. US deaths topped 85,000 yesterday and may triple from here.
3) The presidential election has become a major source of instability, and no one has any idea of how this will all end. Trump is currently trying to bankrupt the US Post Office to frustrate mail-in voting.
4) The immigration crisis is reaching a humanitarian crisis of epic proportions. It has become our Syria, which landed four million immigrants in Europe.
5) The stock market is in the process of crashing…. Again, failing dramatically at the 200-day moving average. That “Sell in May” thing may work big time this year.
6) The Trump trade is toast. Financials, commodity, energy, coal, and industrial stocks are leading the charge to the downside.
7) Oil (USO) is in free fall and may go negative again, another classic recession predictor. For the first time in history. Most small and medium-sized energy companies will go under. Coal has dropped to a historic low of 19% of US electricity production, less than total alternative sources, and is never coming back.
8) Bitcoin is rocketing, up an eye-popping 100% since the crash began. This has become the big hot money trade of 2020 in addition to that other great flight to safety trade, gold (GLD).
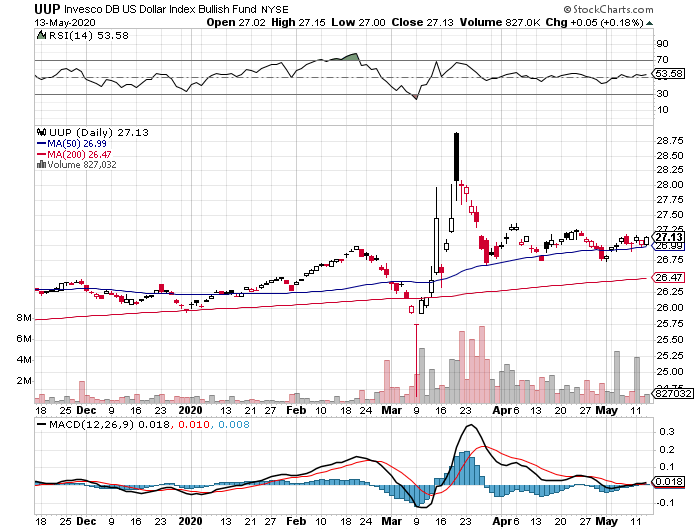
9) The US dollar (UUP) is flatlining, wiping out the growth of the foreign earnings of US multinationals. Foreign economies are collapsing even faster than ours, taking their interest rates and currencies lower at warp speed.
10) The unemployment rate, now at all-time lows, not bottom out for months. The great irony here is that while the president vociferously campaigned on an aggressive jobs program, he may well preside over the biggest job losses in history. The Fed is targeting total unemployment of 52 million, worst than the Great Depression.
For more on this, please read my recent piece, “Why You Will Lose Your Job in the Next Five Years and What to Do About It” by clicking here.
There is another alternative explanation to all of this.
A certain Monty Python sketch about a parrot comes to mind.
That all we saw a giant short squeeze in the hedge funds’ core short position in bonds for the umpteenth time, and that we are almost done.
Hedge funds have grown in size to where they are now the perfect contrary market indicator. It is the classic “Too many people in one side of the canoe” trade. A Yogi Berra quote comes to mind; “Nobody goes there anymore because it is too crowded.”
There are other structural factors at play here which are hard to beat. For more on this, please read my opus on “Why Are Bond Yields So Low” by clicking here.