I spoke to a friend of mine the other day who works for a health care venture capital firm, and I thought I?d pass through a few tidbits.
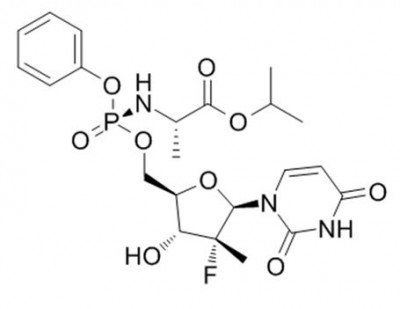
Gilead Sciences (GILD) is basking in the glow of the most profitable drug launch in history. Its blockbuster Sofobuvir treatment for hepatitis C, launched in 2013, inhibits the RNA polymerase that the hepatitis C virus (HCV) uses to replicate its RNA. In traders? parlance, it kills the bug.
(GILD) has taken in $5.7 billion in sales of Sofobuvir during the first half of 2014, and could sell as much as $10-$12 billion for the full year.
The drug is so revolutionary, that it on the scale of medical miracles of decades past, such as Salk vaccine immunizations for polio and penicillin treatments for bacterial infections. So far, Sofobuvir has cured a breathtaking 90% of patients.
Now the company is using various drug combinations that produce even higher success rates with fewer side effects, and may be expended to treat other life threatening diseases. These could take Sofobuvir sales as high as $15-$18 billion in 2015.
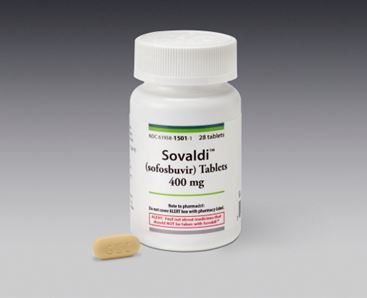
A big controversy regarding Sofobuvir has been its immense cost, which works out to $84,000-$135,000 per patient. This has become a bigger issue with the advent of Obamacare, now that the government is picking up much of the tab.
But, that?s a bargain compared to full treatment of the disease, which can run as high as $350,000 per patient. That is, unless you don?t care if you die.
Partly in response to these complaints, the company is making the drug available at deep discounts in 91 emerging nations that account for 50% of all Hepatitis C cases globally. What it loses on margins there it will make back in volume.
With any luck, we may see hepatitis C wiped out in my lifetime, as I have already seen with smallpox (I saw some of the last few live cases in kids in Nepal in 1976).
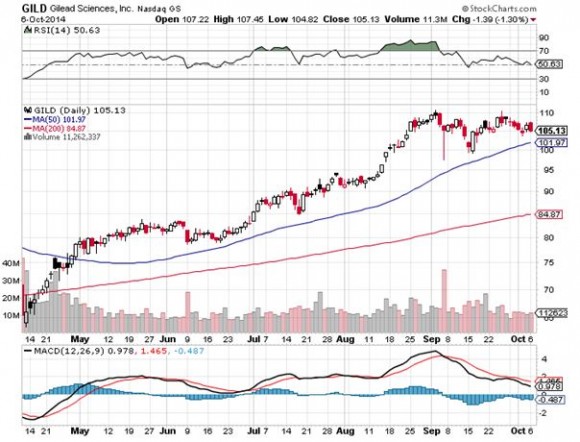
All of this makes the stock appear a bargain at its current $106 price. At a multiple of a subterranean 12X earnings, the stock should hit $140 next year.
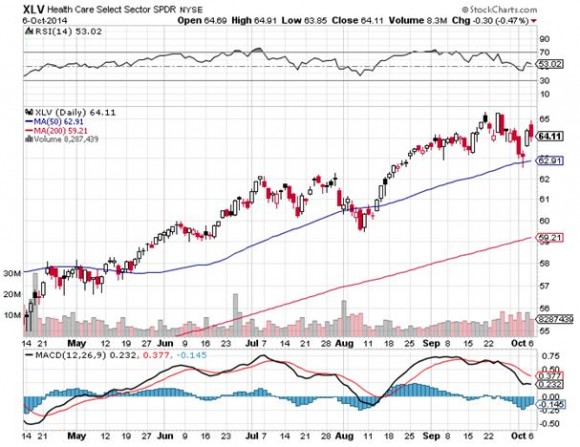
You all know that health care is one of my three core industries to bet on for the long term (there others are energy and technology).
The short-term driver of the share price for (GILD) is obviously whether the health care sector is in, or out of vogue. But for the long term Gilead looks like a good bet to me. And I don?t even have hepatitis.
For more depth on the company, please refer to my earlier piece, Keep Gilead Sciences on Your Radar, by clicking here.
The Formula for Immense Profits
https://www.madhedgefundtrader.com/wp-content/uploads/2014/10/Chemestry-e1412687003668.jpg309400Mad Hedge Fund Traderhttps://madhedgefundtrader.com/wp-content/uploads/2019/05/cropped-mad-hedge-logo-transparent-192x192_f9578834168ba24df3eb53916a12c882.pngMad Hedge Fund Trader2014-10-07 09:13:492014-10-07 09:13:49An Update on Gilead Sciences
That?s all we managed to clock in the latest correction in the greatest bull market of all time.
It?s not the 6% hickey we had to endure in February, nor as modest as the 4% setback in August. Call it a middling type correction, a kind of correction light. The buyers do still have itchy trigger fingers.
All it took to bring it to an end was a September nonfarm payroll that blew the socks off the forecasts of most analysts, coming in at a positively steroidal 248,000. It?s like they?re finally hiring again.
That is, unless you just graduated from college with a degree in English, Sociology, or Political Science, and are lugging $100,000 in student loans. Coders everywhere are writing their own tickets.
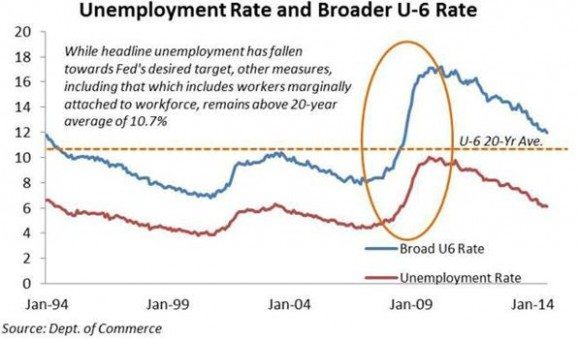
The headline unemployment rate plunged from 6.1% to 5.9%, an eight year low, and the broader U-6 figure is closing in on 10%.
Even more impressive were the back month upward revisions, which were enormous. July was boosted from 212,000 to 243,000, and August was goosed from 142,000 to 180,000.
The hiring was across the board, with professional & business services, retail, health services, and even construction leading the way.
What all of this means is that the freshly updated 4.4% Q2 GDP growth rate isn?t some cockamamie government concoction, but is, in fact real.
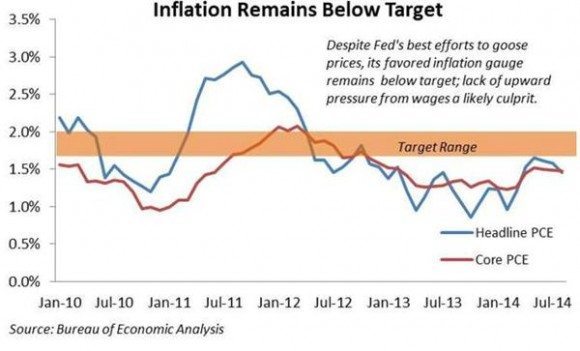
More amazing is that we are seeing these blistering numbers against a background of non-existent inflation, even deflation, if the August -0.1% Consumer Price Index is to be believed.
That gives my friend, Federal Reserve governor Janet Yellen, a blank check to keep interest rates lower for longer than anyone believes possible.
Without the inflation bogeyman, you might as well keep rates at zero forever. Personally, I am in the 2016 camp before we start to see interest rate rises.
All this means it is back to the races for the stock market, with an (SPX) bull?s-eye of 2050-2100 now in the cards. However, we?re not going there in a straight line.
I expect more of a sideways wedge formation developing first over the coming month where we see successive higher lows and lower highs. When we reach the apex of the triangle it will be bingo!, and a blast off to new all time highs.
Of course, you can?t go to the races without a program. So make your choices carefully, as the kind of corrections of the type we have just seen often herald sudden sector rotations.
I think financials are the place to be, especially if my prediction that interest rates are bottoming proves correct. That?s why I knocked out a Trade Alert to buy Bank of America (BAC) last week (click here for the editor?s cut). Conveniently, it jumped 5% the next day. I have a pleasant habit of doing that with (BAC).
I am not dishing out a positive view on risk assets because I live in LaLa Land (I only grew up there), am a perma bull, or like drowning myself in the punch bowel (at least not since college). For me, it?s all about the numbers.
Here?s a list of figures to show, not that shares are cheap or how expensive shares are, but how moderately priced they are:
1) With a price earnings multiple of 17X, we are smack in the middle of a 10-25X historic range.
2) The dividend yield for stocks is at 1.9%, compared to only 1.1% at the 2007 top.
3) Cash reserves per S&P 500 share are a rich $443, compared to only $353 seven years ago.
4) Corporate debt to assets is a mere 23% versus 32% 2007.
I could go on and on, but you see my point. This bull market has years to go before it even flirts with becoming truly expensive, unless you own Tesla (TSLA), according to Mr. Elon Musk.
I think the way to trade this market is to reserve the daily newspapers only for lining the bottom of a birdcage, and to hit the mute button on your TV.
That way you won?t hear about the Ebola Virus, ISIL, the Midterm Elections, the war in the Ukraine, and all the other bogus reasons to sell stocks we are bombarded with daily.
Did I mention that the $20 per barrel plunge in the price of oil we have just seen amounts to one of the largest tax cuts in history for the economy?
See, I always write more interesting economic pieces while watching Men in Black. I think the 6,800-foot altitude here at Lake Tahoe helps too.
So Inspiring!
https://www.madhedgefundtrader.com/wp-content/uploads/2014/10/Men-in-Black-Jones-Smith.jpg252439Mad Hedge Fund Traderhttps://madhedgefundtrader.com/wp-content/uploads/2019/05/cropped-mad-hedge-logo-transparent-192x192_f9578834168ba24df3eb53916a12c882.pngMad Hedge Fund Trader2014-10-06 09:34:082014-10-06 09:34:08The Correction is Over
I don?t double up short positions very often. I am too old to lose all my money and go back to work as an entry-level analyst at Morgan Stanley. Besides, they probably wouldn?t have me back anyway. It is a different company than it was 30 years ago, a lot different.
However, the dead cat, short covering bounce we got off this morning?s Hong Kong dump does allow me to get back into the short side of the (SPY) one more time.
We managed to gain 20 (SPX) points, or 2 entire (SPY) handles from the Monday morning capitulation, puke on your shoes low. Except this time, we are a weekend closer to expiration, only 14 trading days until October 15.
And waiting all the way until Friday for the September nonfarm payroll buys us a free week.
Does anyone really care what?s going on in Hong Kong, China, or anywhere else in the world, for that matter? Not really. It appears only day traders do, and those of us who have family members there, like me.
The beginning of October is usually the scariest two weeks of the year. So a bet that the (SPY) doesn?t blast up to new all time highs during this period looks like a pretty good idea.
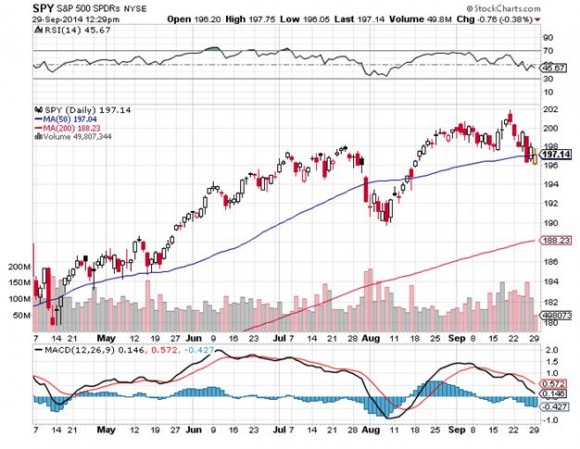
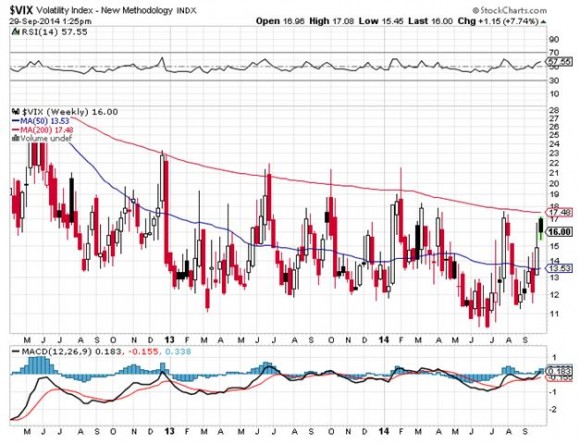
Buying the S&P 500 (SPY) October, 2014 $202-$205 vertical in-the-money bear put spread with the volatility index (VIX) just short of the $17 handle, the highest print in six months, is also getting us the best short term spread prices this year. It?s almost like the good old days.
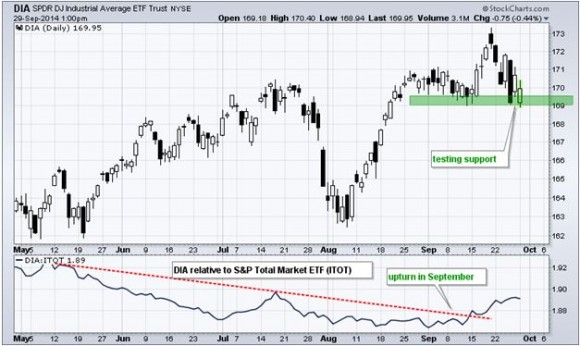
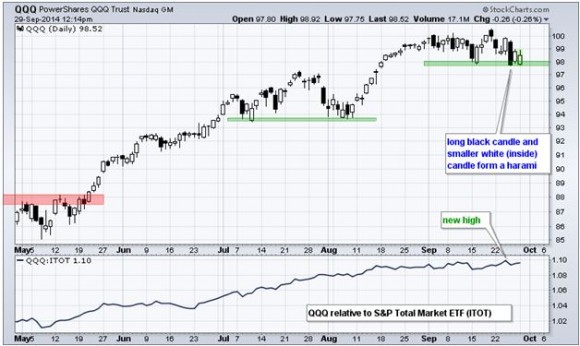
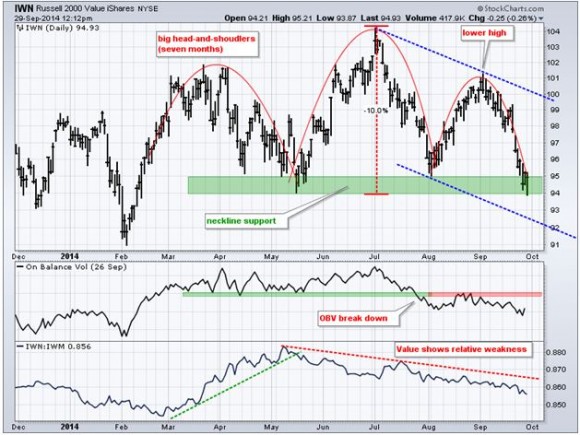
If the prospect of executing this trade causes the hair on the back of your neck to stand up, take a look at the charts below.
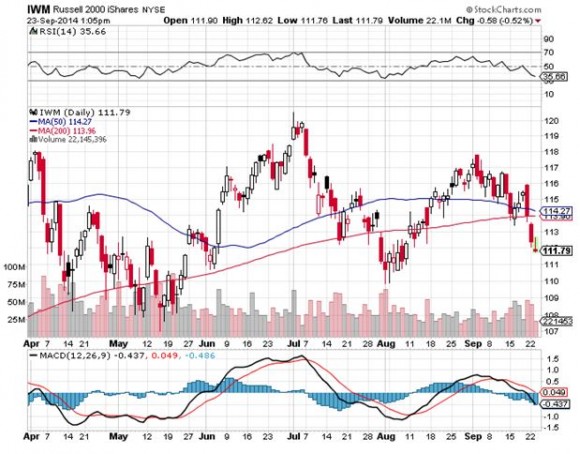
The Russell 2000 (IWM) broke through to a new low this morning, proving that a solid, three-month downtrend in the small caps is still alive and well.
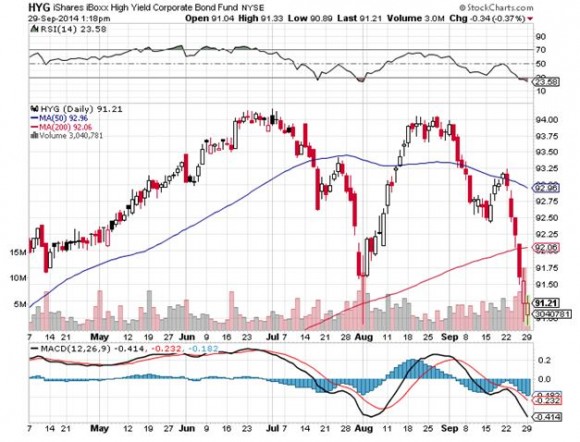
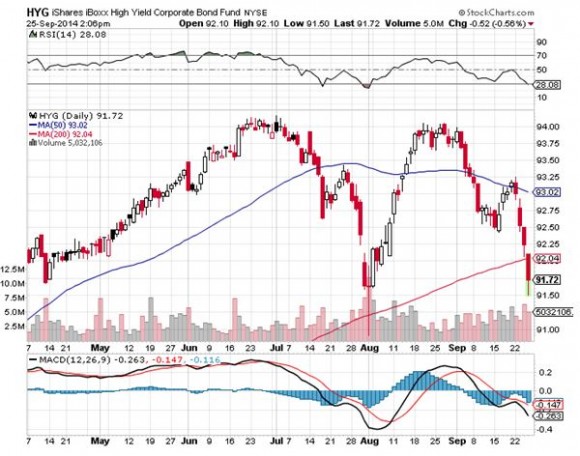
The chart looks even worse for the iShares iBoxx High Yield Corporate Bond ETF (HYG), which has become a very important lead security for traders to keep a laser like focus on.
NASDAQ (QQQ) and the Dow Jones Average ($INDU) are sitting bang on crucial support lines. Alibaba is still sucking all the oxygen out of the technology sector, with major institutions selling everything else to take instant 5% stakes in the new issue. This is great news for the sector for the long term, but not so great for the short term.
Finally, I asked my ace Mad Day Trader, Jim Parker, his thoughtful take here. He believes that short term, markets are oversold and due for a rallyette. He wouldn?t be shorting stocks here with My money! But is the (SPY) going to a new all time high in 14 trading days? Absolutely no way!
There is another factor to consider here. We have recently clocked substantial profits with our short positions in the Euro (FXE) and the Russell 2000 (IWM).
So we can afford the luxury of getting aggressive here when everyone else is running and hiding. We are essentially now playing with the house?s money. The only question is whether we will next post a larger gain, or a smaller one. That is a position of strength, and a great place to trade from.
So I think the net net of all of this is that best case, the risk markets all keep trending downward, worse case, they flat line sideways, at least for the next 14 trading days. Either way, it is a win-win for me. That makes the S&P 500 (SPY) October, 2014 $202-$205 in-the-money bear put spread a winner in my book.
You can buy this spread anywhere in a $2.60-$2.75 range and have a reasonable expectation of making money on this trade.
This is a rare instance where there is no outright stock or ETF equivalent to this trade. If you sell short the stock market here, such as through purchasing the ProShares Ultra Short S&P 500 ETF (SDS), we could rally all the way up to, but just short of the all time high, and you would get your head handed to you.
If this happens with the S&P 500 (SPY) October, 2014 $202-$205 in-the-money bear put spread, you make your maximum profit of 1.30% of your total portfolio. This is why I play in the options market. So non options players are better to stand aside on this trade and just watch it for educational purposes.
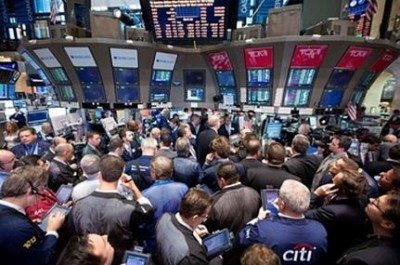
https://www.madhedgefundtrader.com/wp-content/uploads/2014/09/Market-Floor-e1411743381455.jpg265400Mad Hedge Fund Traderhttps://madhedgefundtrader.com/wp-content/uploads/2019/05/cropped-mad-hedge-logo-transparent-192x192_f9578834168ba24df3eb53916a12c882.pngMad Hedge Fund Trader2014-09-30 01:04:502014-09-30 01:04:50Why I?m Doubling Up My Shorts
Watching the market melt down today, I have been hurriedly compiling a shopping list of stocks to buy, and writing the Trade Alerts in advance for readers to execute.
If I am right about interest rates remaining flat or rising for the rest of the year, then financials have to be at the absolute top of such a list.
Bank of America (BAC) certainly was the chief whipping boy of the financial crisis. Since 2008, it has paid out more than $50 billion in fines and lawsuit settlements for every transgression under the sun.
After getting a bail out from the US Treasury, it was forced to cut its dividend payment to a token one cent. Do any Google search on the company and you are inundated with a flood of bad news.
All that is now ancient history. The entire banking industry is now moving into the sweet spot in the economic cycle. This is because rising interest rates mean that they will be able to charge more for loans, while their cost of funds (deposits and equity) remains low. These rising spreads fall straight to the bottom line.
Now with the bank?s Torturer-in-Chief, US Attorney General Eric Holder, announcing his retirement, the way is clear for better days ahead.
With the 30-year bull market in bonds now at an end, substantially higher rates in the near future are now included in virtually every economic forecast out there. Since the beginning of 2014 the ten-year Treasury yield has collapsed from 3.05% to as low as 2.32% at he end of August, pummeling bank shares.
What happens next? They go from 2.32% back up to 3.05%, possibly by yearend, then a lot more. Bank shares will ride on the back of this bull.
The jungle telegraph is now ringing with the prospect of a dividend hike by the company, currently at a lowly four cents. We may get the good news as soon as the next reporting period on October 14. The implications of such a move are broad.
If it pulls this off, it is only because of renewed confidence by the markets in the improved financial condition of the company. After several capital raises and the liquidation of the wreckage of the 2008 crash, US banks are now the healthiest in history, with balance sheets of bedrock stability.
Ahem, they are also too big to fail, again.
To get the dividend yield on the shares up to industry standard of 2.5%, the company really needs to raise its dividend to 42 cents. It certainly has the cash flow to do this. In 2013, (BAC) reported net income of $11.4 billion, more than four times to amount needed to cover such a payout.
Needless to say, this is all great news for the share price. The prospective return of increasing amounts of capital to shareholders should suck in new and wider classes of shareholders. It won?t be just about hedge fund punters anymore. Respectable, large and long term holding institutions will be in there as well.
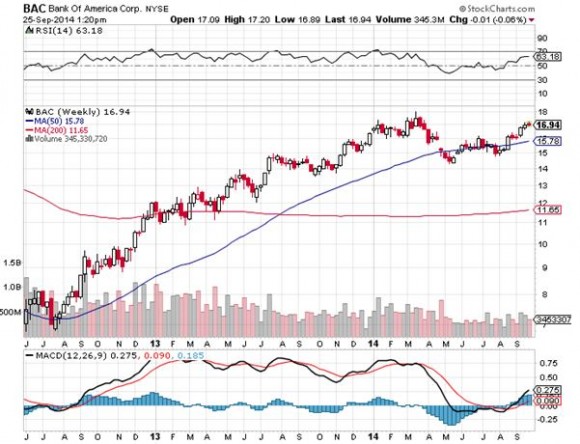
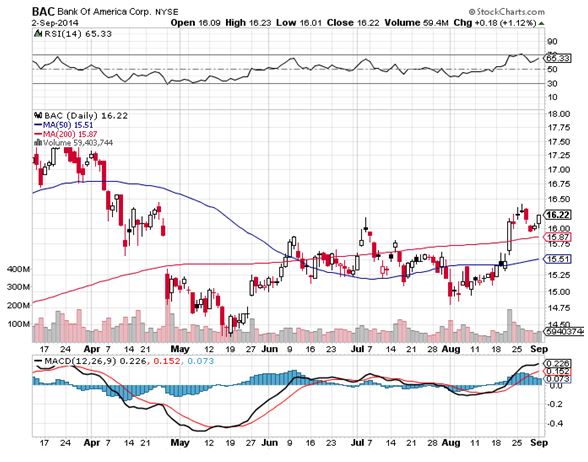
Take a look at the charts below, and it is clear that such a move is underway. (BAC) broke out from the end of a classic triangle formation, which traditionally resolves itself to the upside. New post crash highs beckon.
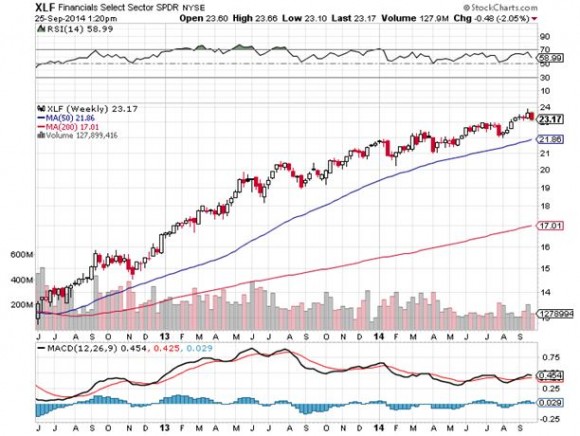
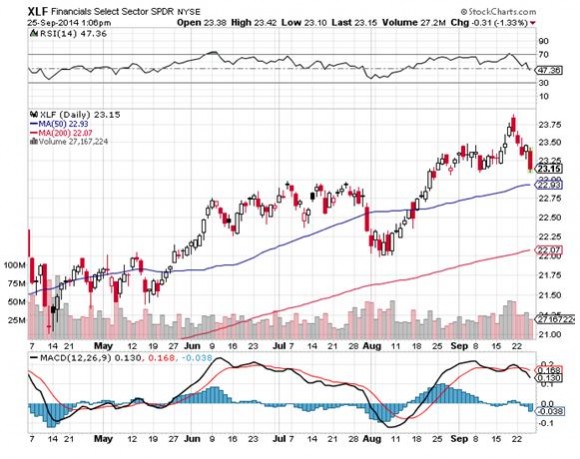
You can find more dry powder in the chart for the Financials Select Sector SPDR ETF (XLF), which clearly rejected a complete breakdown at long-term trend support in early February.
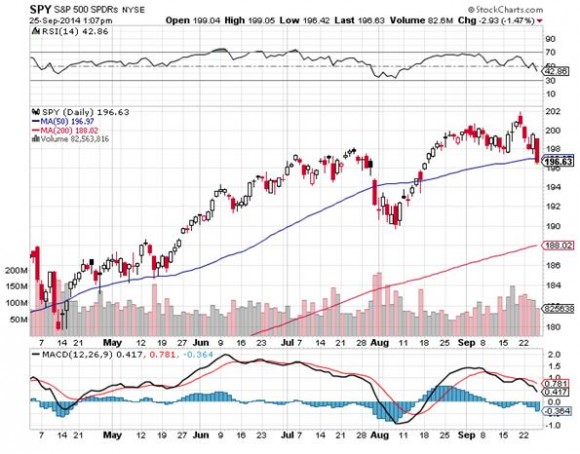
Finally, take a gander at the chart for the S&P 500. New life from the financials will be the adrenaline shot this market needs to break it out of its current low volume sideways consolidation, taking it to new highs as well.
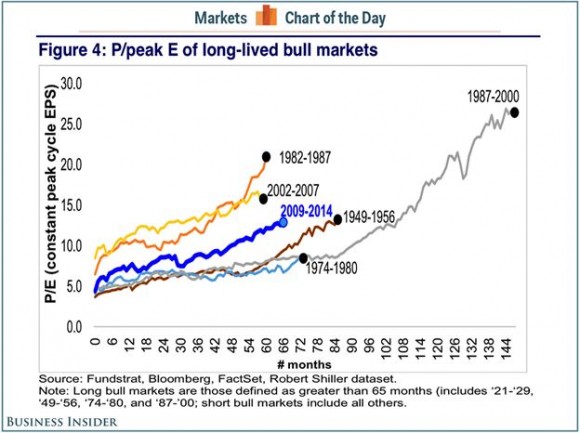
Finally, for those who are concerned that the bull market was killed off by last week?s massive Alibaba IPO (BABA), take a look at he chart below provided by my friends at Business Insider. Certainly, the collapse of the iShares iBoxx High Yield Corporate Bond ETF (HYG) has put the fear of God into traders.
The chart tracks long-lived bull markets in terms of their price earnings multiples. It shows that we have only reached half the length of the great 1987-2000 bull market. The implication is that this bull could live another five or more years.
This bull is not dead, it is just resting.
So far, the S&P 500 has declined by a feeble 2.8% off the $202 top. If we break the 50-day moving average here, we could make it down to the 200-day moving average at $1,880, a more substantial 7% pullback. Take that as a gift, and load the boat for the year-end rally.
I?ll send out the Trade Alert to buy (BAC) when I think the timing is ripe.
(XLF) Weekly
(XLF) Daily
Time to Visit the ATM Again
The Bull is Not Dead, It is Resting
00Mad Hedge Fund Traderhttps://madhedgefundtrader.com/wp-content/uploads/2019/05/cropped-mad-hedge-logo-transparent-192x192_f9578834168ba24df3eb53916a12c882.pngMad Hedge Fund Trader2014-09-26 01:05:272014-09-26 01:05:27Holder Retirement Could Send Bank of America Flying
During last month?s Concourse d? Elegance vintage car show at Pebble Beach, California, I managed to catch up with Tesla?s senior management. All lights were flashing green, and it was full speed ahead.
The new Gigafactory being built outside Reno, Nevada will pave the way for the firm?s entry into the mass market. The big issue in selecting a site was not cost or subsidies, but the permitting process. In Nevada, where almost everything is legal, you can get a building permit in 30 days, compared to months elsewhere and years in California.
Expect to see the Model Tesla 3 out in three years, which will cost $40,000 and get a 300-mile range. Ranges on Lithium Ion battery driven vehicles are doubling every four years. Buying a car at that price, with no maintenance and free fuel for life, is the same as paying $20,000 for a gasoline driven car.
That?s when Tesla ramps up production from this year?s 40,000 units to 500,000, turning the ?Big Three? auto makers into the ?Big Four.? This is why the big institutional investors are going gaga over the stock.
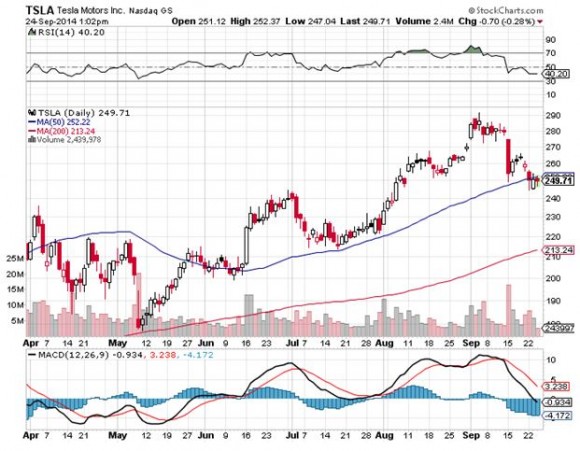
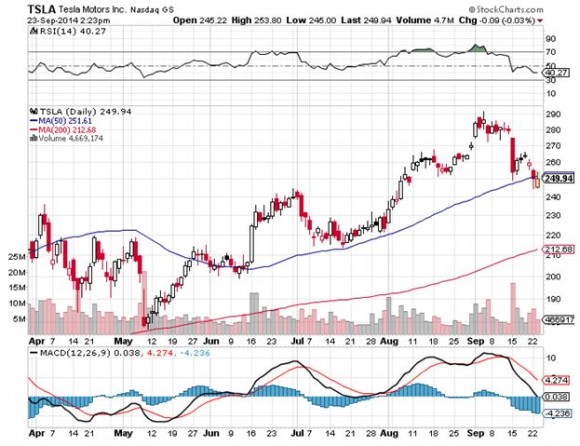
All that has been missing this year has been a decent entry point to buy the stock. It now appears we have one, the stock giving up 17% from its August $295 high.
All of which brings me to Tesla?s share price, which has just taken a swan dive from $265 to $184 as hot money fled the big momentum names. Let me tell you that the revolutionary vehicle is still wildly misunderstood, and the company has done a lousy job making its case. I guess you can afford that luxury when consumers line up for a year to buy your product.
The electric power source is, in fact, the least important aspect of the Tesla cars. Here are 15 reasons that are more important:
1) The vehicle has 75% fewer parts than any other, massively reducing production costs. The drive train has 11 parts, compared to over 1,500 for conventional gasoline powered transportation. Tour the factory and it is eerily silent. There are almost no people, just a handful who service the German robots that put these things together.
2) No maintenance is required, as any engineer will tell you about electric motors. You just rotate the tires every 6,000 miles.
3) This means that no dealer network is required. There is nothing to fix.
4) If you do need to repair something, usually it can be done over the phone. Rebooting the computer addresses most issues. If not, they will send a van to do a repair at your house for free.
5) The car runs at room temperature, not the 500 degrees in standard internal combustion cars. This means that the parts last forever.
6) The car is connected to the Internet 24/7. Once a month it upgrades its own software when you are sleeping. You jump in the car the next morning and a message appears on your screen saying, ?We just upgraded the following 20 Apps.? This is the first car I ever owned that improved itself with age, as I do myself.
7) This is how most of the recalls have been done as well, over the Internet while you are sleeping.
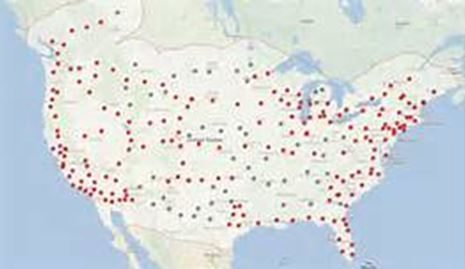
8) If you need to recharge at a public station, it is free. Tesla has its own national network of superchargers that will top you up in 45 minutes, and allow you to drive across the country (see map below). But hotels and businesses have figured out that electric car drivers are the kind of big spending customers they want to attract. So public stations have been multiplying like rabbits. When I first started driving my Nissan Leaf in 2010 there were only 25 charging stations in the Bay Area. There are now over 1,000. They even have them at Costco.
9) No engine means a lot more space for other things, like storage. You get two trunks in the Model-S, a generous one behind, and a ?frunk? in front.
10) Drive an electric car in California, and you are treated like visiting royalty. You can drive in the HOV commuter lanes as a single driver. This won?t last forever, but it?s a nice perk now.
11) There is a large and growing market for all American made products. Tesla has a far higher percentage of US parts (100%) than any of the big three.
12) Since almost every part is made on site at the Fremont factory, supply line disruptions are eliminated. Most American cars are over dependent on Asian supply lines for parts and frequently fall victim to disruptions, like floods and tidal waves.
13) There are almost no controls, providing for more cost savings. Except for the drive train, windows, and turn signals, all vehicle controls are on the touch screen, like a giant iPhone 6 plus.
14) A number of readers have argued that the Tesla really runs on coal, as this is still the source of 36% of the US power supply. However, if you program the car between midnight and 7:00 AM (one of my ideas that Tesla adopted in a recent upgrade), you are using electricity generated by the utilities to maintain grid integrity at night that otherwise goes unused and wasted. How much power is wasted like this in the US every night? Enough to recharge 150 million cars per night!
15) Oh yes, the car is good for the environment, a big political issue for at least half the country.
No machine made by humans is perfect. So in the interest of full disclosure, here are a few things Tesla did not tell you before you bought the car.
1) There is no spare tire or jack, just an instant repair kit in a can.
2) The car weighs a staggering 3 tons, so conventional jacks don?t work. Lithium is heavy stuff, and the electric rotors and stators on the wheels that generate power weigh 250 pounds each. This means you only get 12,000 miles per set of tires.
3) The car is only 8 inches off the ground, so only a scissor jack works.
4) The 21-inch tires on the high performance model are a special order. Get a blowout in the middle of nowhere and you could get stranded for days. So if you plan to drive to remote places, like Lake Tahoe, as I do, better carry a 19-inch spare in the ?frunk? to get you back home.
5) If you let some dummy out in the boonies jack the car up the wrong way, he might puncture the battery and set it on fire. It will be a decade before many mechanics learn how to work with this advanced technology. The solution here is to put a hockey puck between the car and the jack. And good luck explaining what this is to a Californian.
6) With my Leaf, I always carried a 100-foot extension cord in the trunk. If power got low, I just stopped for lunch at the nearest sushi shop and plugged in for a charge. Not so with Tesla. You are limited to using their 20-foot charging cable, or it won?t work. I haven?t found anyone from the company who can tell me why this is the case.
The investment play here is not with the current Model S1, which is really just a test bed for the company to learn how to execute real mass production. This is why the current price/earnings multiple is meaningless. Battery technologies are advancing so fast now, that range/weights are doubling every four years.
And guess what? Detroit is so far behind developing this technology that they will never catch up. My guess is that they eventually buy batteries and drive trains from Tesla on a licensed basis, as Toyota (for the RAV4) and Daimler Benz (for the A Class) already are. Detroit?s entire existing hybrid technologies are older versions similarly purchased from the Japanese (bet you didn?t know that).
That leaves the global car market to Tesla for the taking. Sales in China are taking place at a price 50% higher than here in the US, and the early indications are that they will be an absolute blowout. Government support there is no surprise, given that the air pollution in Beijing is so thick you can cut it with a knife.
All of this will boost the shares from the present $250 to over $500. I would say $1,000 a share, but I don?t want to give it the Apple (AAPL) curse. So if you can use the current weakness to buy it under $250, you will be well rewarded.
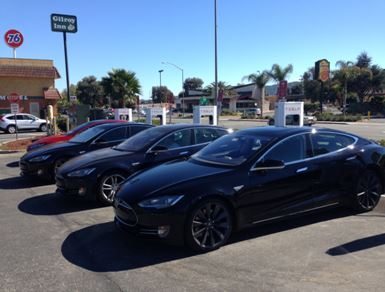
You might also go out and buy a Model S1 for yourself as well. It?s like driving a street legal Formula 1 racecar and is a total blast. Just watch out for soccer moms driving Silverado?s speaking on cell phones.
The Gilroy, California Supercharger Station
The Car Factory Formerly Known as GM
Buy the Stock and Get the Car for Free!
https://www.madhedgefundtrader.com/wp-content/uploads/2013/02/Tesla-Plant.jpg315416Mad Hedge Fund Traderhttps://madhedgefundtrader.com/wp-content/uploads/2019/05/cropped-mad-hedge-logo-transparent-192x192_f9578834168ba24df3eb53916a12c882.pngMad Hedge Fund Trader2014-09-25 01:03:082014-09-25 01:03:08Plunging Back into Tesla
It now appears that the ?Alibaba? correction (BABA) is at hand.
I warned you, pleaded with you, and begged you about this yesterday, and on May 8 (click here for ?Will Alibaba Blow Up the Market?).
The longer the company postponed the mother of all IPO?s, the higher the prices flew, until we finally got a print at the absolute apex of the market. Now, it?s time to pay the piper.
The development is part of a broader move out of riskier, higher beta stocks into safe, large caps that has been underway for several weeks now. Those traders who are ahead want to protect their years. Those who aren?t are screwed anyway, so don?t bother returning their phone calls.
Look no further than my favorite, Tesla (TSLA), which topped out on September 3, along with the rest of the MoMo high technology, biotechnology and Internet names.
Still love the cars, though.
The (IWM) has really been sucking hind teat all year, falling by 3% year to date compared to an 8% gain in the S&P 500.
Yesterday, the sushi really hit the fan when the 50-day moving average pierced the 200-day moving average for the first time since August, 2011. Known as a much dreaded ?death cross,? this is the technical equivalent of slitting both wrists and thrashing about in shark-invested waters, heralding more declines to come.
Let me list the reasons why this is the sector traders love to hate when markets move from ?RISK ON? to ?RISK OFF?:
*Since small companies borrow more than large companies, they are far more sensitive to rising interest rates. Guess what? Rates have been rocketing this month.
*Since small companies are more leveraged (indebted) than big ones, they are more sensitive to a slowing economy.
*Small companies don?t have the international diversification of their bigger brethren, and therefore have less of a financial cushion to fall back on.
*The (IWM) has roughly 1.5 times the volatility of the S&P 500, making a short position here fantastic downside protection for a broader based portfolio of stocks. So you get a lot of selling here, as managers try to lock in performance for fiscal years that start ending as early as October 31.
*Did I mention that the stock market is at one of its most overbought levels in history, the worst since 1928? Bearish sentiment is at only 13%, the lowest since 1987. These are more reason to sell, as if you needed any.
My readers have made tons of money over the years playing the (IWM) on the short side. It?s time for another visit to the trough. I?m not finishing my year early.
Not yet, anyway.
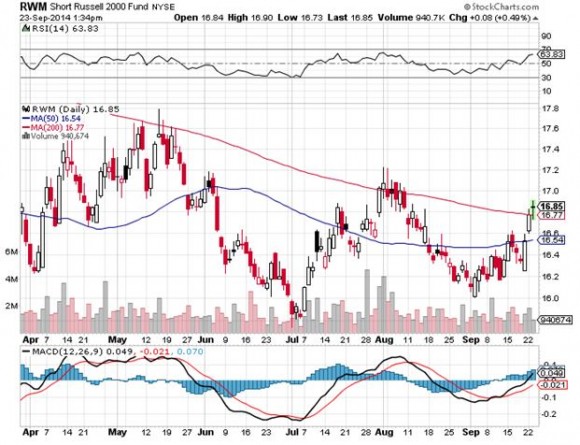
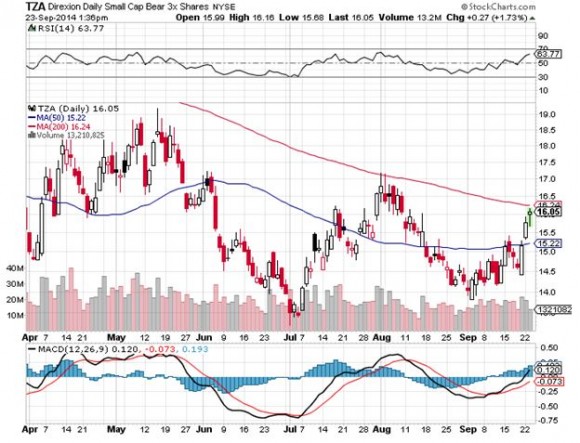
If you can?t trade options, then buy the Short Russell 2000 Fund ETF (RWM) as a 1X play, or the Direxion Daily Small Cap Bear 3X ETF (TZA) for a 3X trade. However, 3X ETF?s of any kind are for intra day traders only.
Time to Bail on a Burning House
https://www.madhedgefundtrader.com/wp-content/uploads/2014/04/Burning-Building-e1430840521423.jpg308400Mad Hedge Fund Traderhttps://madhedgefundtrader.com/wp-content/uploads/2019/05/cropped-mad-hedge-logo-transparent-192x192_f9578834168ba24df3eb53916a12c882.pngMad Hedge Fund Trader2014-09-24 01:05:532014-09-24 01:05:53Time to Bail on the Small Caps
Like a deer frozen in a car?s onrushing headlights, markets have been comatose awaiting Federal Reserve governor Janet Yellen?s decision on monetary policy and interest rates.
Interest rates are unchanged. Quantitative easing gets cut by $15 billion next month, and then goes to zero. Most importantly the key ?considerable period? language stayed in the FOMC statements, meaning that interest rates are staying lower for longer.
Personally, I don?t think she?s raising interest rates until 2016. The number of dissenters increased from one to two, but then both of them (Fisher and Plosser) are lame ducks. And, oh yes, the composition of the 2015 Fed will be the most dovish in history.
The latest data points made this a no brainer, what with the August nonfarm payroll coming in at a weak 142,000, and this morning?s CPI plunging to a deflationary -0.20% for the first time since the crash.
Of course, you already knew all of this if you have been reading the Mad Hedge Fund Trader. You knew it three months ago, six months ago, and even a year ago, before Janet Yellen was appointed as America?s chief central banker. Such is the benefit of lunching with her for five years while she was president of the San Francisco Fed.
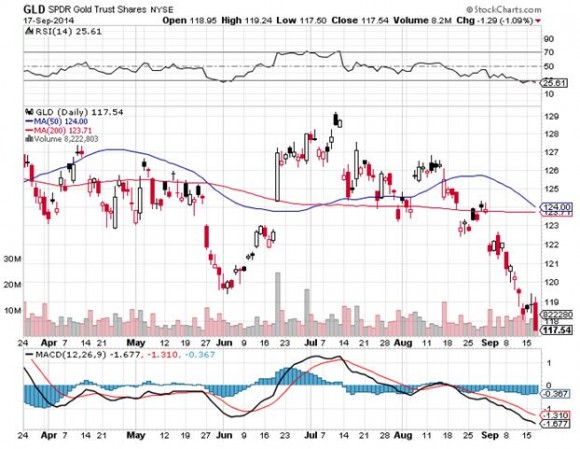
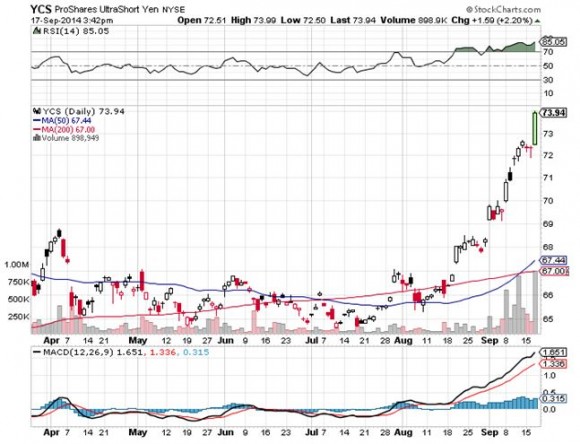
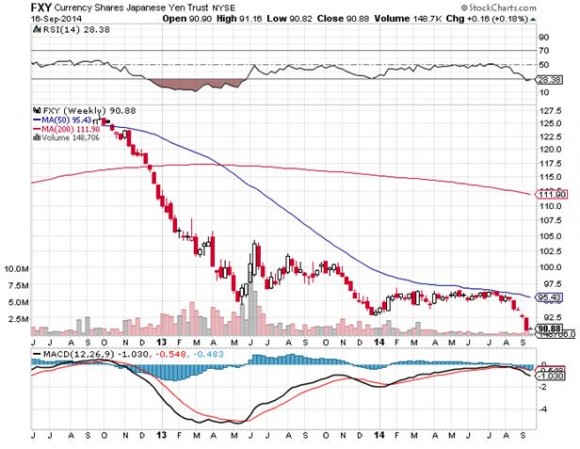
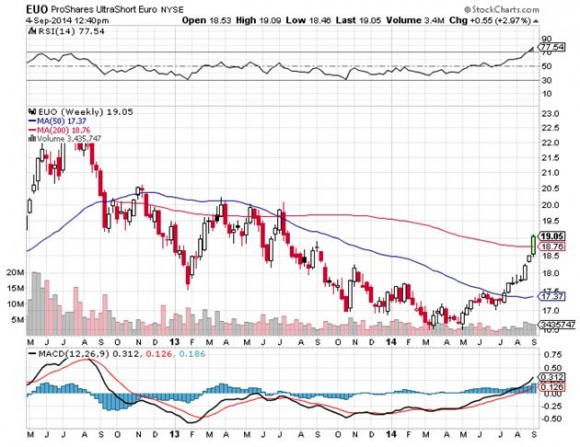
The markets reacted predictably, with the Euro (FXE), (EUO), and the yen (FXY), (YCS) hitting new multiyear lows, Treasury bonds (TLT), (TBT) breaking down, and precious metals (GLD), (SLV) taking it on the kisser.
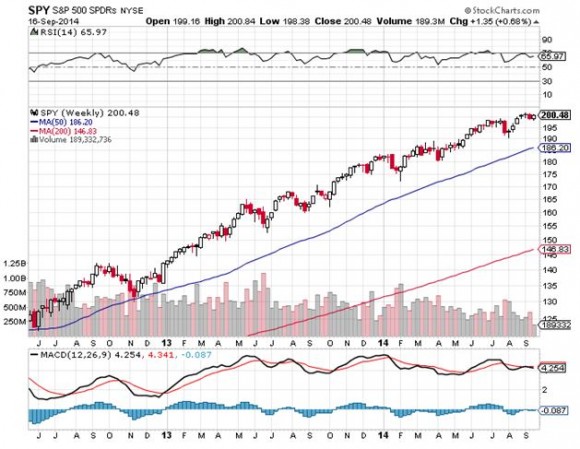
What Janet did not do was give us an entry point for an equity Trade Alert (SPY), with the indexes close to unchanged on the day. The high frequency trader?s front ran the entire move yesterday.
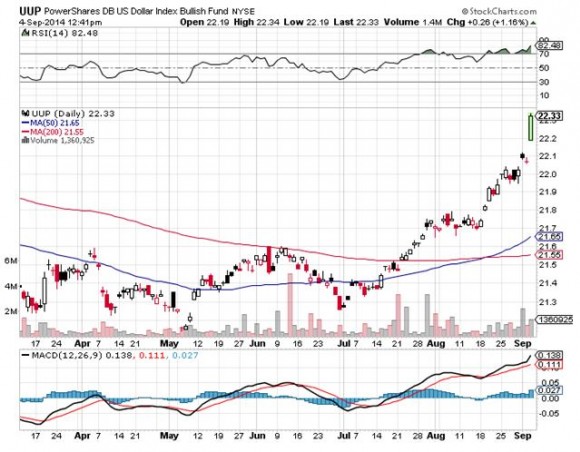
Virtually all asset classes are now sitting at the end of extreme moves, up for the dollar (UUP) and stocks, and down for the euro, yen, gold, silver, the ags, bonds and oil. It?s not a good place to dabble.
Putting on a trade here is a coin toss. And when you?re up 30.36% on the year, you don?t do coin tosses. At this time of the year, protecting gains is more important than chasing marginal gains, which people probably won?t believe anyway.
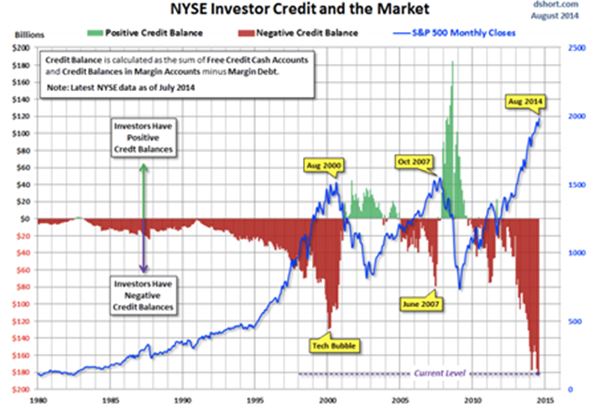
If you want to understand my uncharacteristic cautiousness, take a look at the chart below sent by a hedge fund buddy of mine. It shows that investor credit at all time highs are pushing to nosebleed altitudes. Not good, not good. Oops! Did somebody just say ?Flash Crash??
This is not to say that I?m bearish, I?m just looking for a better entry point, especially as the Q????????? 3 quarter end looms. I?ve gotten spoiled this year. Maybe the Scottish election results, the Alibaba IPO, or the midterm congressional elections will give us one. Buying here at a new all time high doesn?t qualify.
It?s time to maintain your discipline.
Sorry, no more pearls of wisdom today. I?ve come down with the flu.
Apparently, this year?s flu shot doesn?t cover the virulent Portland, Oregon variety. Was it the designer coffee that did it, the vintage clothes, or those giant doughnuts dripping with sugar?
Back to the aspirin, the antibiotics, the vitamin ?C?, and a chant taught to me by a Cherokee medicine man.
https://www.madhedgefundtrader.com/wp-content/uploads/2014/09/John-Thomas5-e1410989501597.jpg400266Mad Hedge Fund Traderhttps://madhedgefundtrader.com/wp-content/uploads/2019/05/cropped-mad-hedge-logo-transparent-192x192_f9578834168ba24df3eb53916a12c882.pngMad Hedge Fund Trader2014-09-18 01:04:402014-09-18 01:04:40She Speaks!
For the first time in three years, the model trading portfolio of my Trade Alert service has no positions. It is 100% in cash.
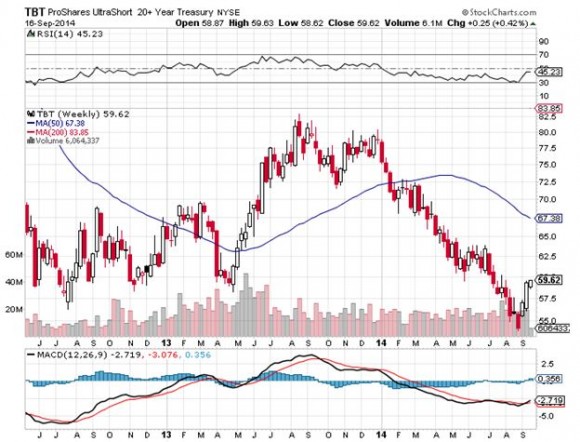
I took a small profit on my last remaining position on Friday, a long in the ProShares Ultra Short 20+ Year Treasury ETF (TBT), a bet that Treasury bond prices would fall and yields would rise. Call it rocketing back up to breakeven.
It?s not that I have suddenly fallen in love with the bond market. Au Contraire, I think this is the beginning of a move in Treasury bond yields that could take the ten year yields up from last month?s lowly 2.32% all the way to 3.0%, possibly by yearend.
That would boost the (TBT) by another 35% from here. However, discretion is the better part of valor, and it is better to allow markets to breathe, especially after bonds have made a whopping great six point move down in a week.
That last tactical move left me up 30.36% for 2014. This compares to the average hedge fund that is up only 7%, a Dow average that has appreciated by a mere 3%, and 90% of managers are underperforming even these arthritic benchmarks.
I have to tell you, I kind of like being up 30.36%. In fact, I like it so much that I have taken to standing back and admiring it.
I like to drive it around the block at least once a day. I have had a temporary tattoo made for my forearm that says ?30.36%.? I now wear a button on my lapel that says ?30.36%.?
At my club I have moved my locker to number 3036, although the members there are getting sick of me talking about it all the time and are thinking of having me blackballed.
One reason I am out of the market is that everything I have done over the past four months has worked. The Euro (FXE) and the Yen (FXY), (YCS) collapsed against the US dollar as I expected. Stocks went to new all time highs, despite the abuse that my bullish predictions invited. The bond market peaked and began a precipitous slide.
Apple rallied into the iPhone 6 announcement, right on schedule. Oil crashed, and gold died a slow death. Only a snakebite from General Motors (GM) prevented this from becoming a perfect quarter.
It?s not like I am going to stay out of the market forever. You can?t rest on your laurels for long in the financial advisory business. You really are only as good as your last trade, and readers constantly want to know what I have done for them lately.
Markets are coming to the end of their ?TIME? correction, and there are two important triggers looming ahead of us. Today, Janet Yellen clarifies Fed policy for the next six weeks, and on Friday, the Alibaba IPO starts to trade.
You know that great sucking sound you?ve been hearing all month? That is the sound of managers selling other stocks to make room for their allocations on this gargantuan $20 billion issue.
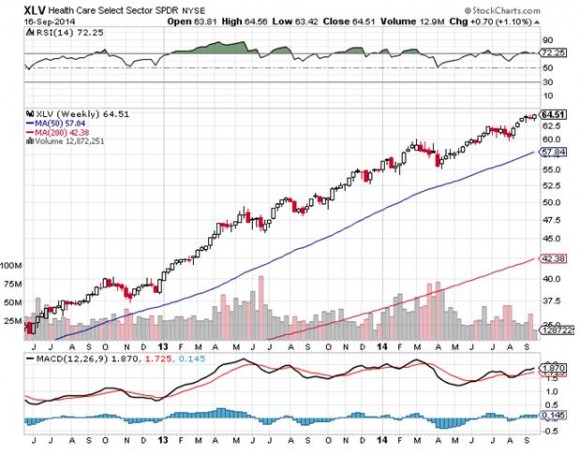
First went other Chinese Internet companies (BIDU), then Apple (AAPL), then technology in general, then other highflyers in health care (XLV), biotech (IBB), and energy (XLE), then the main market as a whole (SPY).
That sucking sound ended five minutes after yesterday?s market opening. Then it was back to business as usual, shutting out underweight mangers trying to get in. I think this story continues for the rest of the year.
I worked so late last night that I ended up doing my daily ten-mile hike mostly in the dark. What do I come upon but an entire hind leg of a deer (see photo below). The draught in California is so severe that many animals are starving and becoming unusually aggressive.
So I called my mother, a true daughter of the old American West and one eighth Cherokee Indian. I asked ?Hey Mom, can a coyote take down a deer?? ?No, son,? she answered. ?They eat mostly small animals like rabbits. Only a mountain lion can take down a deer.?
I said ?Thanks Mom, call you later.? and hurried down the hill.
Don?t Become Someone Else?s Dinner
I?ll be Cooking Up Some New Trades Shortly
https://www.madhedgefundtrader.com/wp-content/uploads/2014/09/John-Thomas4-e1410963740960.jpg379275Mad Hedge Fund Traderhttps://madhedgefundtrader.com/wp-content/uploads/2019/05/cropped-mad-hedge-logo-transparent-192x192_f9578834168ba24df3eb53916a12c882.pngMad Hedge Fund Trader2014-09-17 10:38:522014-09-17 10:38:52Why I Have No Positions
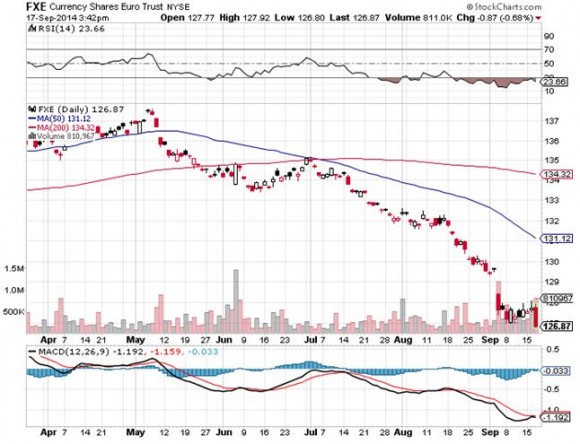
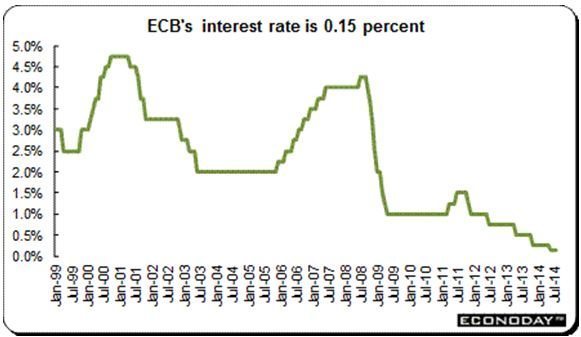
European Central Bank president Mario Draghi pulled the rug out from under the Euro (FXE), (EUO) this morning, announcing a surprise cut in interest rate and substantially adding to its program of quantitative easing.
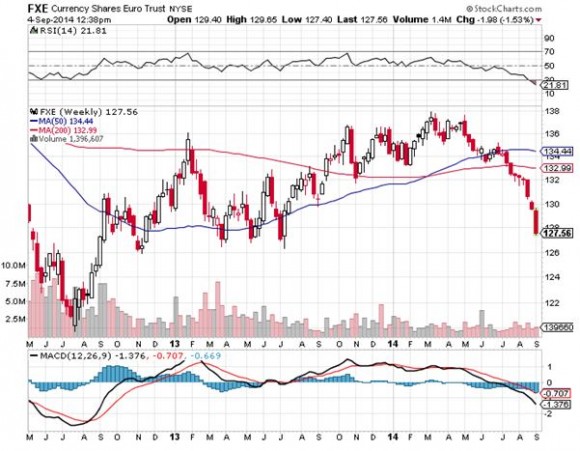
The action caused the beleaguered currency to immediately gap down two full cents against the dollar, the ETF hitting a 15 month low of $127.40.
Surprise, that is, to everyone except a handful of strategists, including myself. Apparently, I was one of 4 out of 47 economists polled who saw the move coming, beating on my drum out of the coming collapse of the euro for the past six months.
I put my money where my mouth was, slamming out Trade Alerts to sell the Euro short, and sometimes even running a double position.
Of course, it helps that I just spent two months on the continent splurging at 90% off sales, and afterwards feasting on $10 Big Macs and $20 ice cream cones. Europe was practically begging for a weaker currency. Shorting the Euro against the greenback appeared to be a no-brainer.
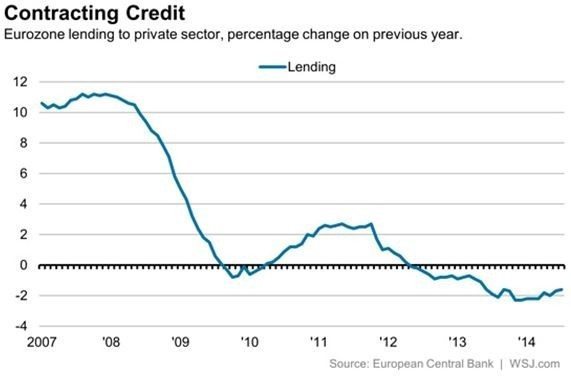
A number of key economic indicators conspired to force Draghi?s hand this time around. August Eurozone inflation fell to a feeble 0.3%. France cut its 2014 GDP estimate at the knees, from 1.0% to 0.5%. Unemployment hovers at a gut wrenching 11.5%. To the continent?s leaders it all looked like a deflationary lost decade was unfolding, much like we saw in Japan.
Call the move an hour late, and a dollar short. Or more like 43,800 hours late and $4 trillion short. The US Federal Reserve started its own aggressive quantitative easing five years ago. The fruits of Ben Bernanke?s bold move are only just now being felt.
A major reason for the delay is that having a new currency, Europe lacks the breadth and depth of financial instruments in which it can maneuver. The Euro will soon be approaching its 15th birthday. Uncle Buck has been around since 1782.
The ECB?s move is bold when compared to its recent half hearted efforts to stimulate its economy. Its overnight lending rate has been cut from 0.15% to 0.05%, the lowest in history. Deposit rates have been pushed further into negative territory, from -0.10% to -0.20%. Yes, you have to pay banks to take your money! A QE program will lead to the purchase of 400 billion Euros worth of securities.
Am I selling more Euros here?
Nope.
I covered the last of my shorts last week, after catching the move in the (FXE) from $136 down to $130. That?s a major reason why my model trading portfolio is up a blistering 30% so far this year.
At $127, we are bang on my intermediate downside target. But get me a nice two or three cent short covering rally, and I?ll be back in there in a heartbeat. My next downside targets are $120, $117, and eventually $100. My European vacations are getting cheaper by the day.
https://www.madhedgefundtrader.com/wp-content/uploads/2014/09/Dollar-Certificate-e1409868770980.jpg400305Mad Hedge Fund Traderhttps://madhedgefundtrader.com/wp-content/uploads/2019/05/cropped-mad-hedge-logo-transparent-192x192_f9578834168ba24df3eb53916a12c882.pngMad Hedge Fund Trader2014-09-05 01:04:162014-09-05 01:04:16A Euro Collapse At Last!
Regular readers of this letter are probably weary of me harping away about the financials as a great place to put your money for the rest of 2014.
Never mind that these names have all jumped 10% in the past month. But this is not an ?I told you so? story. This is more of a ?But wait, there?s more,? story.
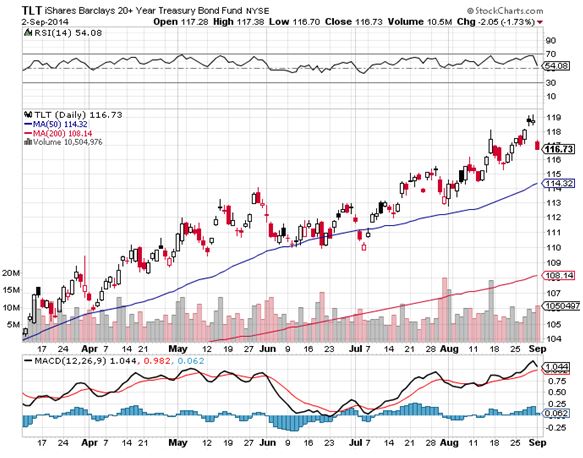
The basis for my call is quite simple. I believe that bond prices are peaking, and yields bottoming. As mining the yield curve is a major source of bank profits, borrowing short term and lending long term, a rise in interest rates falls straight to the bottom line. Thus, buying banks is an indirect way of selling short the bond market.
However, there are many more reasons to overweight this long neglected sector. In a market that has gone virtually straight up for the past three years, many large institutions are going to be forced to roll money out of leaders, like my favored technology, energy and health care, into laggards, such as the financials.
Expect this trend to accelerate as we head into yearend institutional book closing, which start as early as October 30.
Look at other important drivers of bank profits, and you?ll find them at multi decade lows.
Trading and investment banking volumes are off 30%-40% from mean historic levels. We options traders already know this all too well, as turnover has cratered and spreads widened due to investor lack of interest.
This is especially true of put options, which are now being given away virtually for free. Volatility that seems to permanently live at the $12 handle is another such indicator of this disinterest.
This will not last. If my ?Golden Age? scenario plays out in the 2020?s (click here for ?Get Ready for the Coming Golden Age?), trading and investment banking volumes will not only double to return to the norms, they will skyrocket tenfold from today?s tedious, moribund levels.
Indeed, I have recently discovered an entire subculture of financial oriented private equity firms currently amassing portfolios that are betting on precisely such an outcome. Think of big, smart, long-term money. The big bets on the coming decade are being made now.
There is another ripple in the case for banks. After passage of the Financial Stability Act of 2010, otherwise known as ?Dodd Frank?, banks became target numero uno of the federal government. The public?s demand for accountability for the 2008-09 crash knew no bounds.
As a result, the fines and settlements with the big banks, most of which were rescued from bankruptcy by the government, now well exceed $100 billion. Four years into the enforcement onslaught, the Feds are running out of scandals to prosecute. There is nothing left for the banks to plead guilty to.
This means that a major portion of the banks? costs are about to disappear, not only new massive fines, but hundreds of millions of dollars in legal fees and diverted management time as well. More money drops to the bottom line.
Dramatically rising income? Substantially falling costs? Sounds like ?Ka-ching? to me, and a ?BUY? for the bank stocks.
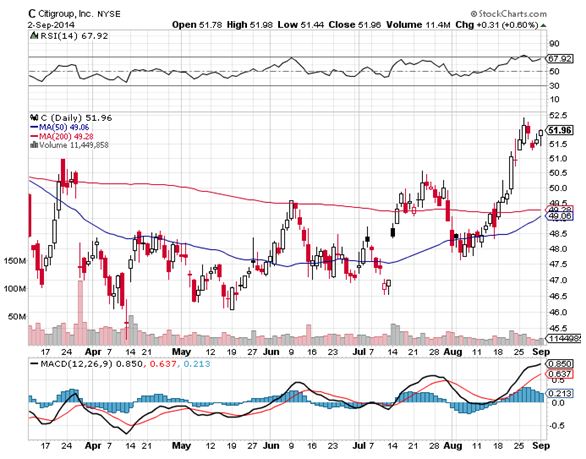
The bottom line is that bank stock could double from here in coming years. It is not hard to pick names. Bank of America (BAC) took the big hit on fines and settlements, and therefore should enjoy the largest bounce.
So should Citigroup (C), which came the closest to vaporizing. And for good measure, I?ll throw in American Express (AXP) as a play on the burgeoning credit card spending by the growing class of well to do.
Barney Frank Had a Few Things to Say
https://www.madhedgefundtrader.com/wp-content/uploads/2013/05/John-Thomas-and-Barney-Frank.jpg357577Mad Hedge Fund Traderhttps://madhedgefundtrader.com/wp-content/uploads/2019/05/cropped-mad-hedge-logo-transparent-192x192_f9578834168ba24df3eb53916a12c882.pngMad Hedge Fund Trader2014-09-03 09:29:542014-09-03 09:29:54The Case for Buying Financials
Legal Disclaimer
There is a very high degree of risk involved in trading. Past results are not indicative of future returns. MadHedgeFundTrader.com and all individuals affiliated with this site assume no responsibilities for your trading and investment results. The indicators, strategies, columns, articles and all other features are for educational purposes only and should not be construed as investment advice. Information for futures trading observations are obtained from sources believed to be reliable, but we do not warrant its completeness or accuracy, or warrant any results from the use of the information. Your use of the trading observations is entirely at your own risk and it is your sole responsibility to evaluate the accuracy, completeness and usefulness of the information. You must assess the risk of any trade with your broker and make your own independent decisions regarding any securities mentioned herein. Affiliates of MadHedgeFundTrader.com may have a position or effect transactions in the securities described herein (or options thereon) and/or otherwise employ trading strategies that may be consistent or inconsistent with the provided strategies.