When communications between intelligence agencies suddenly spike, as has recently been the case, I sit up and take note. Hey, you don't think I talk to all of those generals because I like their snappy uniforms, do you?
The word is that the despotic, authoritarian regime in Syria is on the verge of collapse, and is unlikely to survive more than a few more months. The body count is mounting, and the only question now is whether Bashar al-Assad will flee to an undisclosed African country or get dragged out of a storm drain to take a bullet in his head a la Gaddafy. It couldn?t happen to a nicer guy.
The geopolitical implications for the U.S. are enormous.? With Syria gone, Iran will be the last rogue state hostile to the U.S. in the Middle East, and it is teetering. The next and final domino of the Arab spring falls squarely at the gates of Tehran.
Remember that the first real revolution in the region was the street uprising there in 2009. That revolt was successfully suppressed with an iron fist by fanatical and pitiless Revolutionary Guards. The true death toll will never be known, but is thought to be in the thousands. The antigovernment sentiments that provided the spark never went away and they continue to percolate just under the surface.
At the end of the day, the majority of the Persian population wants to join the tide of globalization. They want to buy IPods and blue jeans, communicate freely through their Facebook pages and Twitter accounts, and have the jobs to pay for it all. Since 1979, when the Shah was deposed, a succession of extremist, ultraconservative governments ruled by a religious minority, have failed to cater to these desires
When Syria collapses, the Iranian ?street? will figure out that if they spill enough of their own blood that regime change is possible and the revolution there will reignite. The Obama administration is now pulling out all the stops to accelerate the process. Secretary of State Hillary Clinton has stiffened her rhetoric and worked tirelessly behind the scenes to bring about the collapse of the Iranian economy.
The oil embargo she organized is steadily tightening the noose, with heating oil and gasoline becoming hard to obtain. Yes, Russia and China are doing what they can to slow the process, but conducting international trade through the back door is expensive, and prices are rocketing. The unemployment rate is 25%.? Iranian banks are about to get kicked out of the SWIFT international settlements system, which would be a deathblow to their trade.
Let?s see how docile these people remain when the air conditioning quits running this summer because of power shortages. Iran is a rotten piece of fruit ready to fall off its own accord and go splat. Hillary is doing everything she can to shake the tree. No military action of any kind is required on America?s part.
The geopolitical payoff of such an event for the U.S. would be almost incalculable. A successful revolution will almost certainly produce a secular, pro-Western regime whose first priority will be to rejoin the international community and use its oil wealth to rebuild an economy now in tatters.
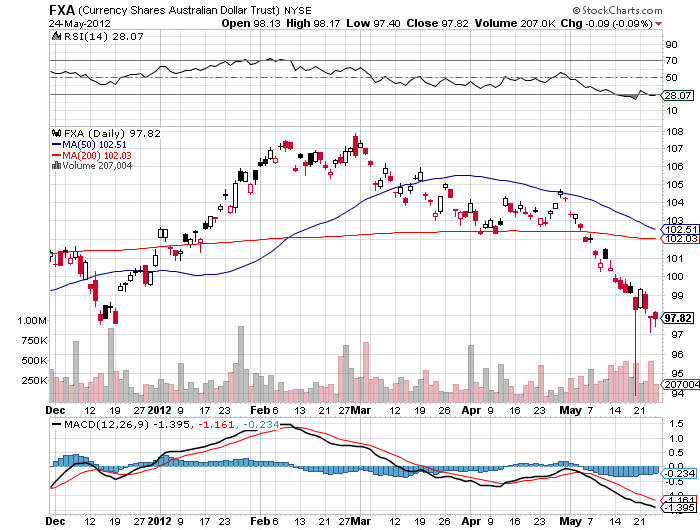
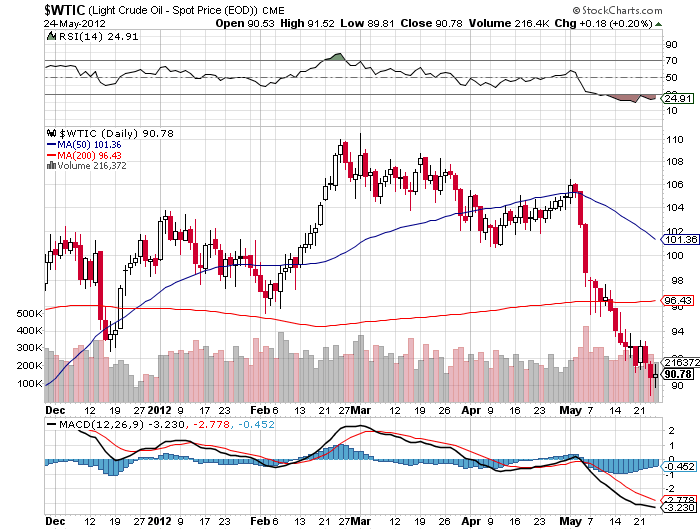
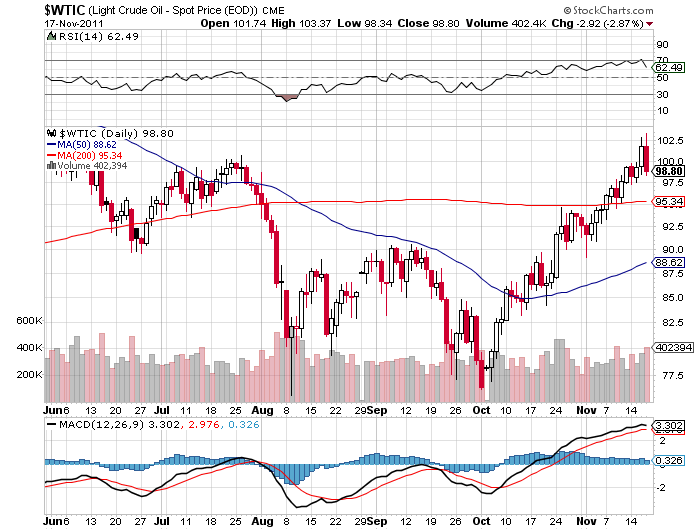
Oil will lose its risk premium, now believed by the oil industry to be $30 a barrel. A looming supply could cause prices to drop to as low as $30 a barrel. This would amount to a gigantic $1.66 trillion tax cut for not just the U.S., but the entire global economy as well (87 million barrels a day X 365 days a year X $100 dollars a barrel X 50%). Almost all funding of terrorist organizations will immediately dry up. I might point out here that this has always been the oil industry?s worst nightmare.
At that point, the US will be without enemies, save for North Korea, and even the Hermit Kingdom could change with a new leader in place. A long Pax Americana will settle over the planet.
The implications for the financial markets will be enormous. The U.S. will reap a peace dividend as large, or larger, than the one we enjoyed after the fall of the Soviet Union in 1992. As you may recall, that black swan caused the Dow Average to soar from 2,000 to 10,000 in less than eight years, also partly fueled by the technology boom. A collapse in oil imports will cause the U.S. dollar to rocket.? An immediate halving of our defense spending to $400 billion or less and burgeoning new tax revenues would cause the budget deficit to collapse. With the U.S. government gone as a major new borrower, interest rates across the yield curve will fall further.
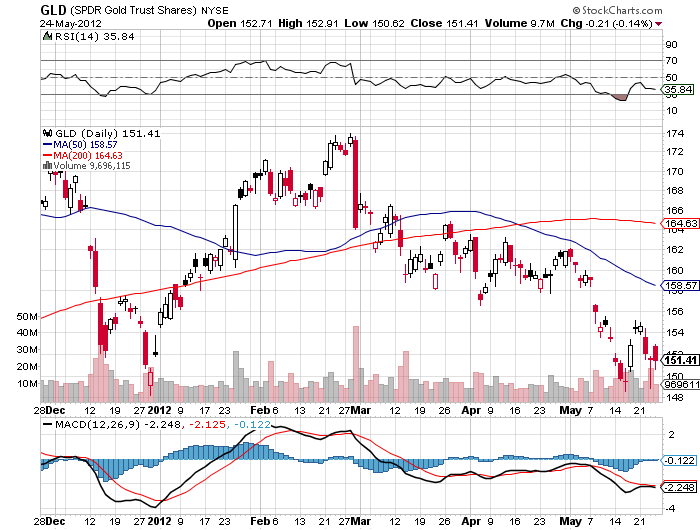
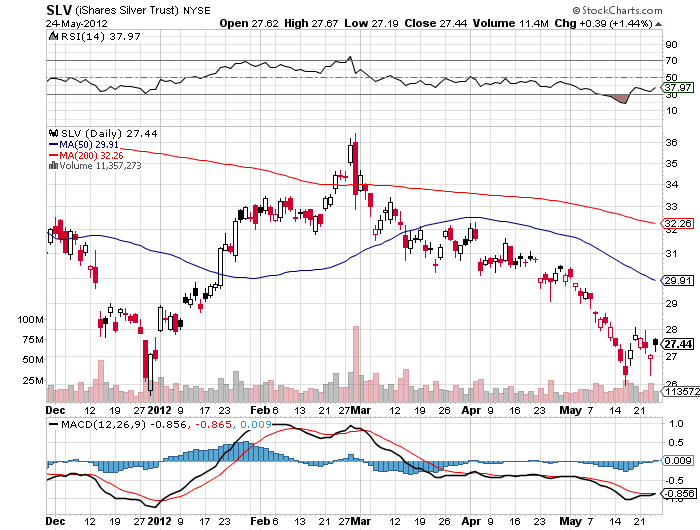
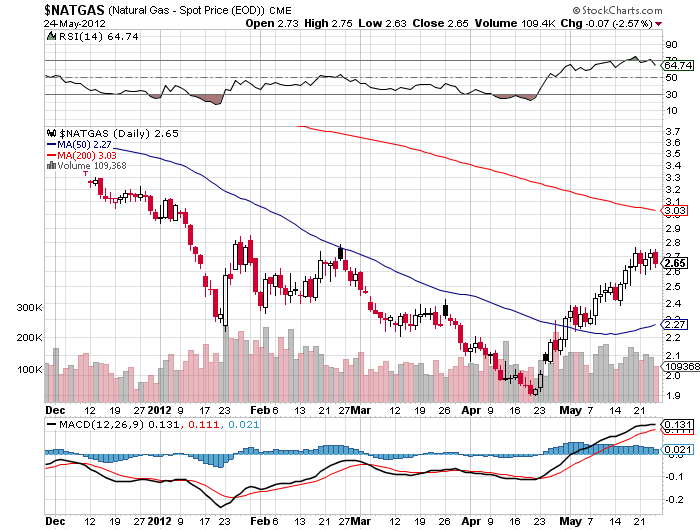
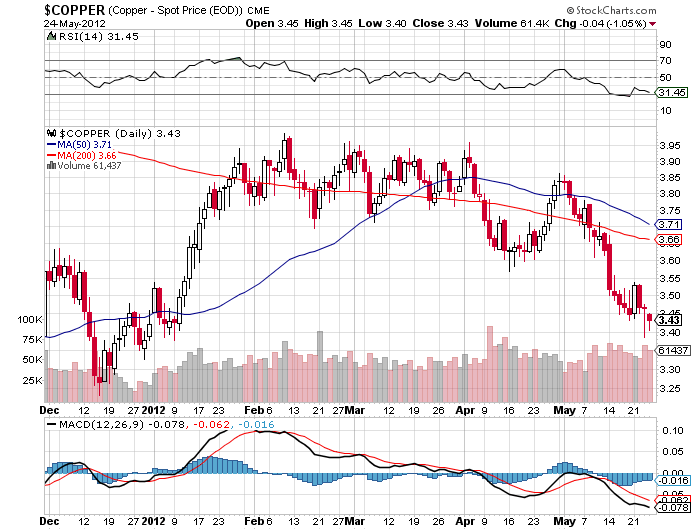
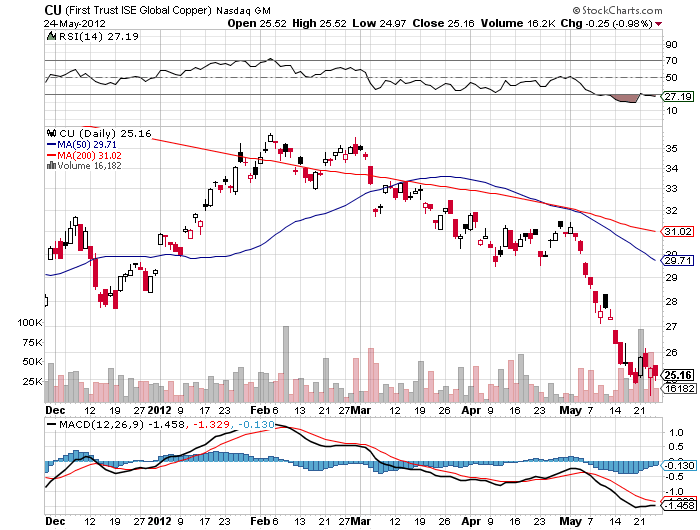
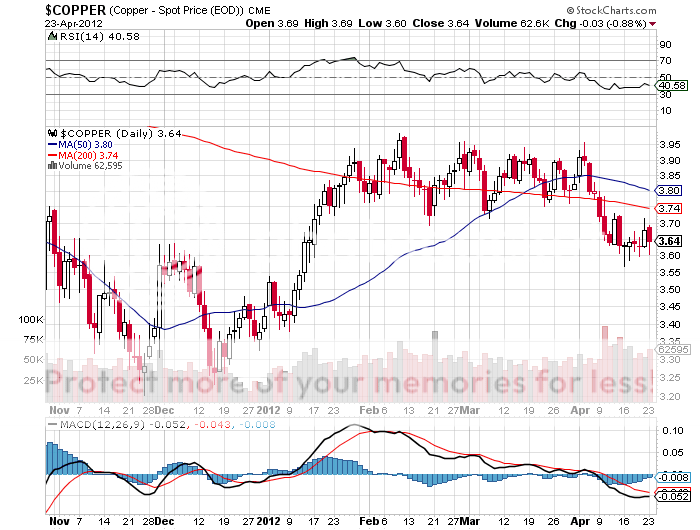
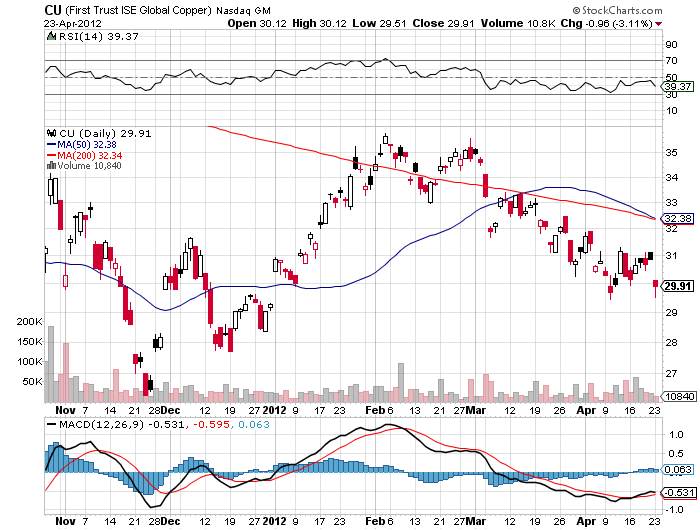
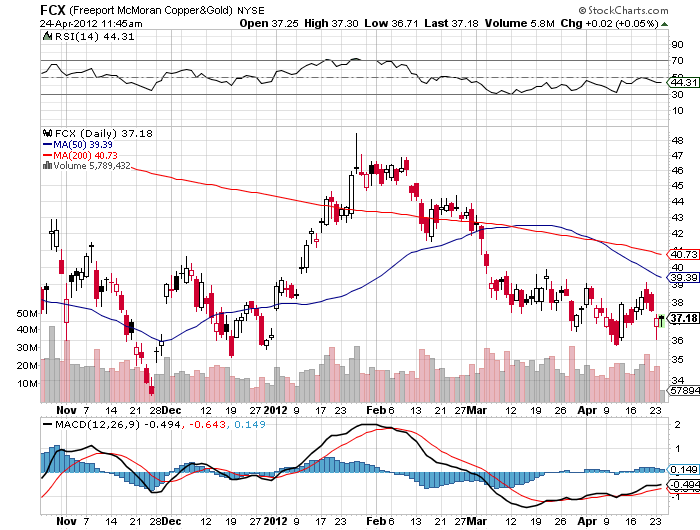
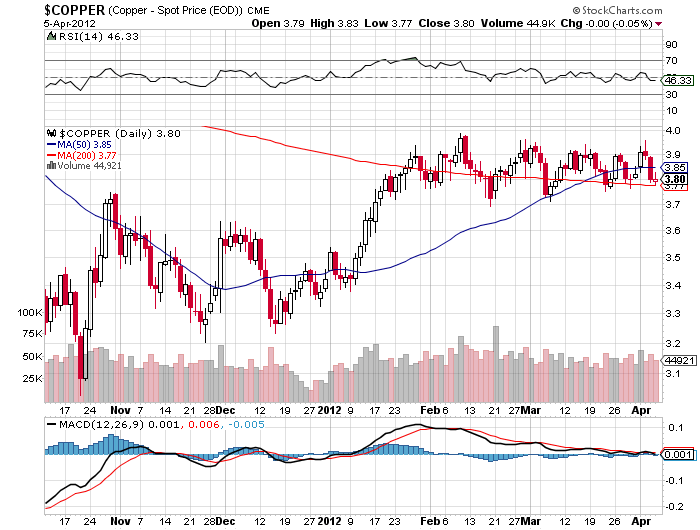
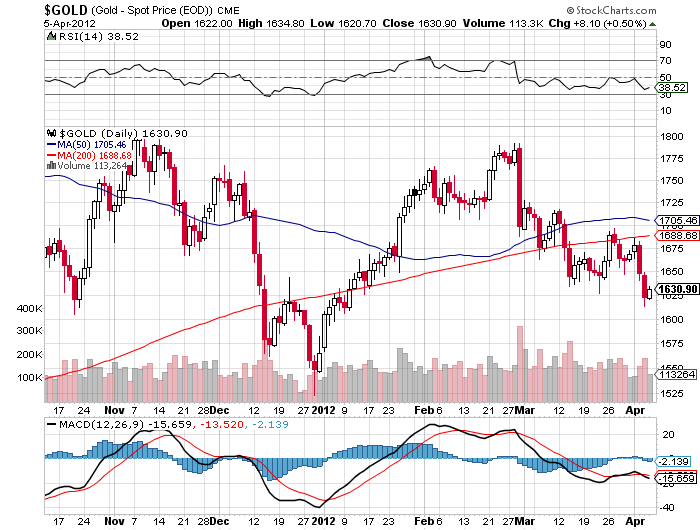
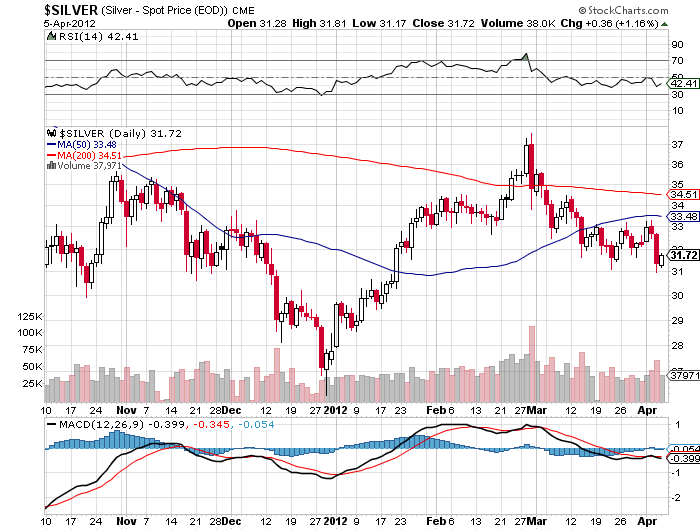
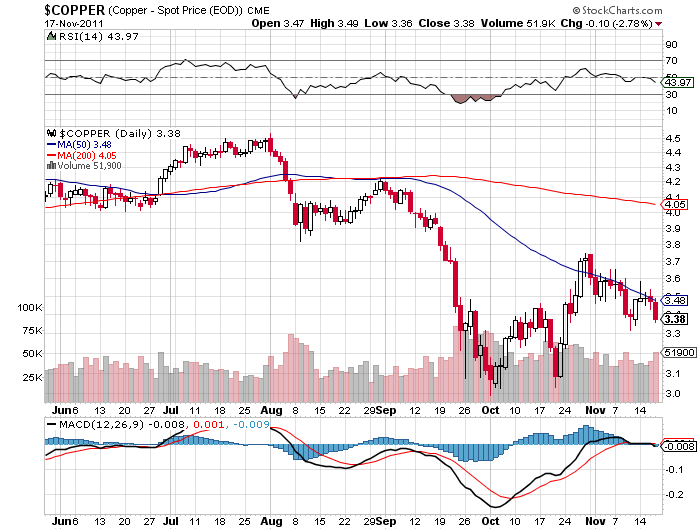
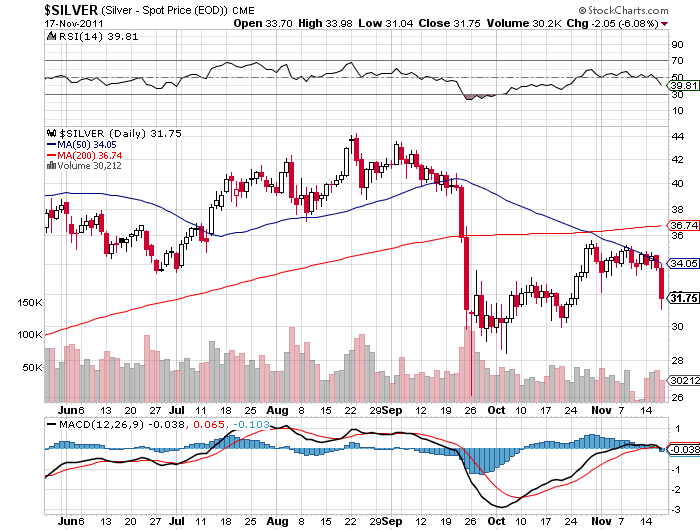
A peace dividend will also cause U.S. GDP growth to reaccelerate from 2% to 4%. Risk assets of every description will soar to multiples of their current levels, including stocks, junk bonds, commodities, precious metals, and food. The Dow will soar to 20,000, the Euro collapses to parity, gold rockets to $2,300 an ounce, silver flies to $100 an ounce, copper leaps to $6 a pound, and corn recovers $8 a bushel. The 60-year bull market in bonds ends.
Some 1 million of the armed forces will get dumped on the job market as our manpower requirements shrink to peacetime levels. But a strong economy should be able to soak these well-trained and motivated people right up. We will enter a new Golden Age, not just at home, but for civilization as a whole.
Wait, you ask, what if Iran develops an atomic bomb and holds the U.S. at bay? Don?t worry. There is no Iranian nuclear device. There is no real Iranian nuclear program. The entire concept is an invention of Israeli and American intelligence agencies as a means to put pressure on the regime. The head of the miniscule effort they have was assassinated by Israeli intelligence two weeks ago (a magnetic bomb, placed on a moving car, by a team on a motorcycle, nice!).
If Iran had anything substantial in the works, the Israeli planes would have taken off a long time ago. There is no plan to close the Straits of Hormuz, either. The training exercises in small rubber boats we have seen are done for CNN?s benefit, and comprise no credible threat.
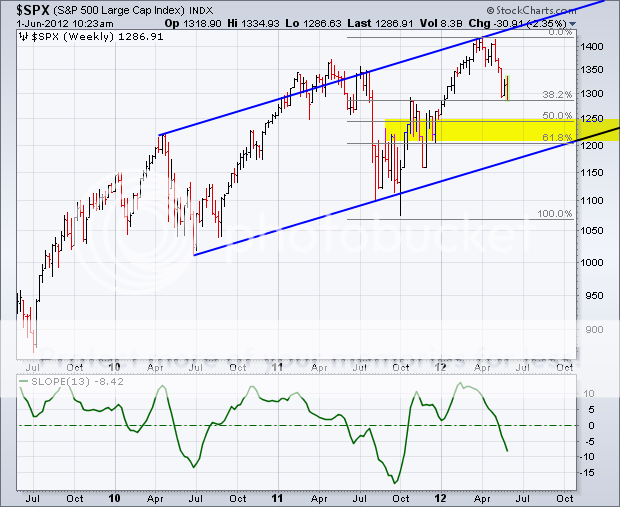
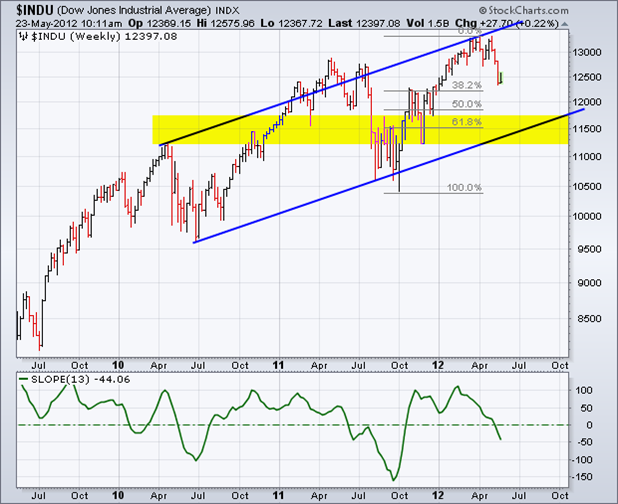
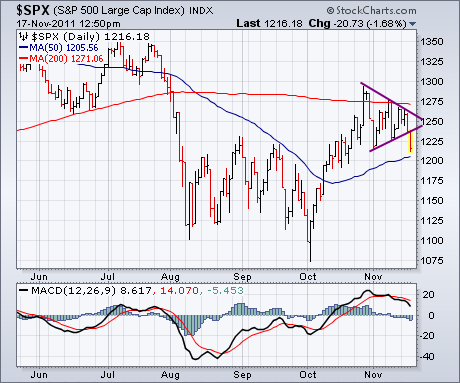
I am a firm believer in the wisdom of markets, and that the marketplace becomes aware of major history changing events well before we mere individual mortals do. The Dow began a 25-year bull market the day after American forces defeated the Japanese in the Battle of Midway in May of 1942, even though the true outcome of that confrontation was kept top secret for years.
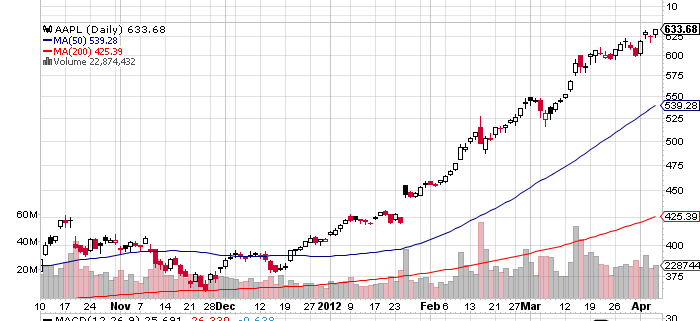
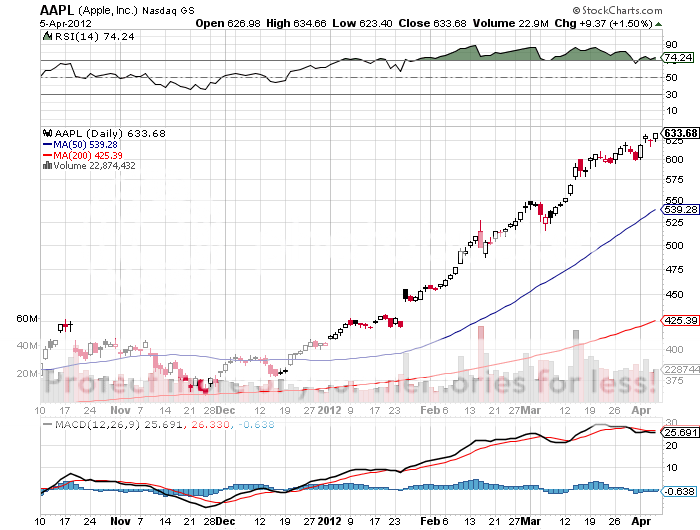
If the collapse of Iran was going to lead to a global multi-decade economic boom and the end of history, how would the stock markets behave now? They would rise virtually every day, led by the technology sector, offering no substantial pullbacks for latecomers to get in. That is exactly what they have been doing since mid-December. If you think I?m ?Mad?, just check out Apple?s chart below.