Featured Trade:
(FRIDAY, JUNE 15, 2018, DENVER, CO, GLOBAL STRATEGY LUNCHEON)
(ANATOMY OF A GREAT TRADE)
(TLT), (TBT), (SPY), (GLD), (USO),
(CYBERSECURITY IS ONLY JUST GETTING STARTED),
(PANW), (HACK), (FEYE), (CSCO), (FTNT), (JNPR), (CIBR)
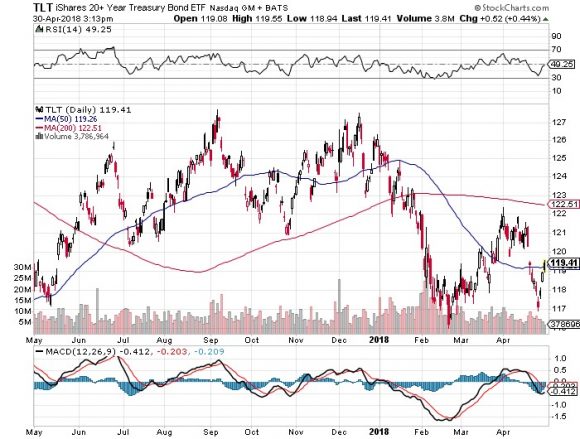
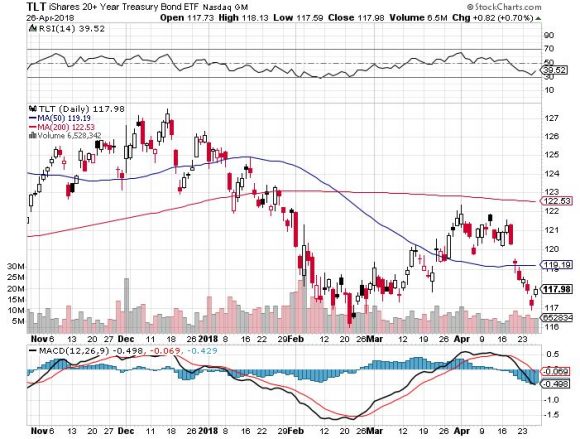
So, I'm sitting here agonizing over whether I should sell short the US Treasury bond market (TLT) once again.
Thanks to the bombshell Israel announced today alleging the existence of a secret Iranian nuclear missile program, oil has rallied by 2%, the US dollar has soared, and stocks have been crushed.
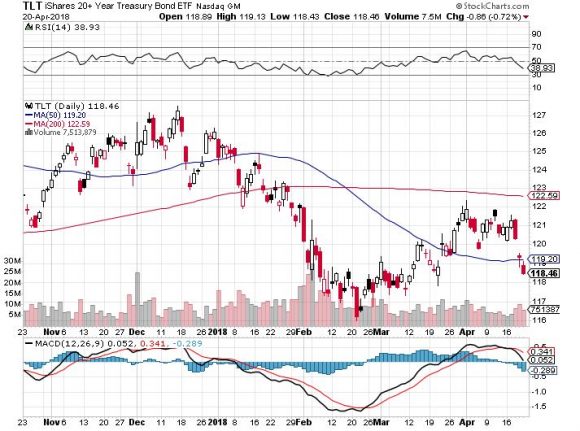
The (TLT) has popped smartly, some $2.5 points off of last week's low, taking yields down from a four-year high at 3.03% down to 2.93%.
The report is probably based on false intelligence, which is becoming a regular thing in the Middle East. Suffice it to say that the presenter, Prime Minister Benjamin "Bibi" Netanyahu, may soon be indicted on corruption charges. Clearly, they are going "American" in the Holy Land.
But for today, the market believes it.
You can understand me chomping at the bit, as selling short US government bonds has been my new rich uncle since the market last peaked in July 2017.
I just ran my Trade Alert history over the past nine months and here is what I found.
I sent you 38 Trade Alerts to sell short bonds generating 18 round trips, AND EVERY SINGLE ONE WAS PROFITABLE! In total these Alerts generated a trading profit of 216%, or 21.62% of my total portfolio return.
That means 35% of my profits over the past year came from selling short Treasuries.
You should do the same.
Falling Treasury prices have been one of the few sustainable trends in financial markets during the past year.
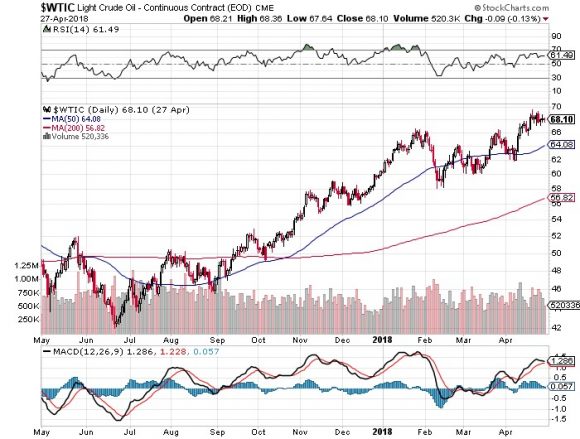
Stock rallied, then gave up a chunk. Gold (GLD) has gone nowhere. Only oil has surpassed as a sustainable trade, thanks to successful OPEC production quotas, which have been extended multiple times.
Texas tea is up an admirable 67% since the June $42 low. And who was loading up on crude way down there?
Absolutely no one.
Of course, I have an unfair advantage as a bond trader, as I have been doing this for nearly 50 years.
I caught the big inflation driven fixed income collapse during the 1970s, which had a major assist then from a rapidly devaluing US dollar.
That's when they brought out zero-coupon bonds, effectively increasing our leverage by 500% for virtually no cost. Principal only strips followed, another license to bring money on the short side.
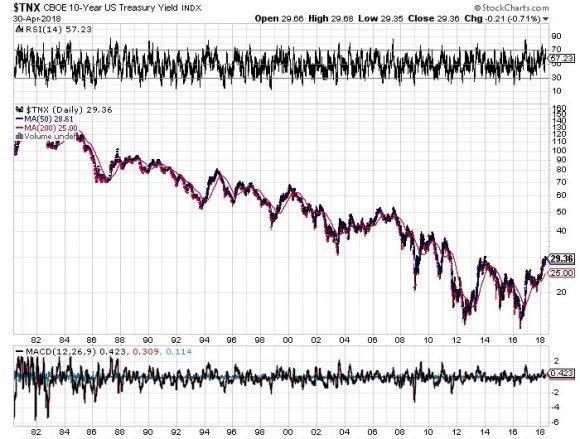
The big lesson from trading this market for a half century is that trends last for a really long time. The bull market in bonds that started in 1982, when 10-year yields hit 14%, lasted for 33 years.
As we are less than three years into the current bear market the opportunities are rife. We are very early into the new game. This one could last for the rest of my life.
The reasons are quite simple. The fundamentals demand it.
1) The Global Synchronized Recovery is accelerating.
2) The Fed will start dropping on the bond market in the very near future $6 billion a month, or $200 million a day, worth of paper in its QE unwind.
3) Tax cuts will provide further stimulus for the US economy.
4) With the foreign exchange markets now laser-focused on America's exploding deficits, a weak US dollar has triggered a capital flight out of the US.
5) We also now have evidence that China has started to dump its massive $1 trillion in US Treasury bond holdings.
All are HUGELY bond negative.
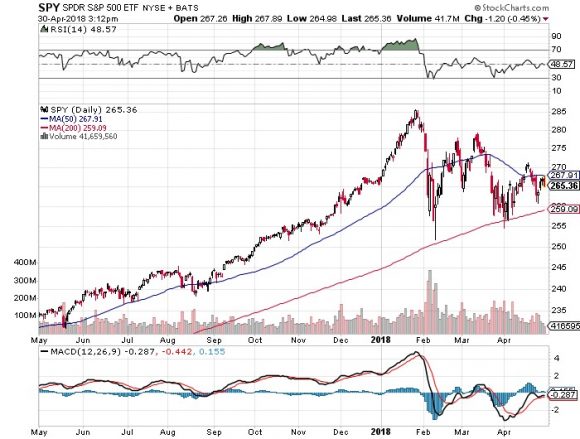
All of this should take bonds down to new 2018 lows. What we could be seeing here is the setting up for the perfect head and shoulders top of the (TLT) for 2018.
As for that next Trade Alert, I think I'll hold out for a better price to sell again. What's the point in spoiling a perforce record?
Time to Stick to Your Guns
https://madhedgefundtrader.com/wp-content/uploads/2019/05/cropped-mad-hedge-logo-transparent-192x192_f9578834168ba24df3eb53916a12c882.png00MHFTRhttps://madhedgefundtrader.com/wp-content/uploads/2019/05/cropped-mad-hedge-logo-transparent-192x192_f9578834168ba24df3eb53916a12c882.pngMHFTR2018-05-01 01:07:112018-05-01 01:07:11Anatomy of a Great Trade
Below please find subscribers Q&A for the Mad Hedge Fund Trader April Global Strategy Webinar with my guest co-host Mike Pisani of Smart Option Trading.
As usual, every asset class long and short was covered. You are certainly an inquisitive lot, and keep those questions coming!
Q: Are you out of Alphabet (GOOGL) and Microsoft (MSFT)?
A. I'm out of Alphabet and I'm in Microsoft, but only for the very short term. I'm waiting for another big meltdown day to go back and buy everything back because I think the FANGs and technology in general are still in a secular bull market.
Q. Are Advanced Micro Devices (AMD) and NVIDIA (NVDA) affected by the underperformance of Bitcoin?
A. They are. Bitcoin has been an important part of the chip story for the last two years because mining, or the creation of bitcoins, creates enormous demand for chips to do the processing. I think selling in bitcoin is over for the time being. You had a $25 billion in capital gains taxes that had to be paid by April 15.
People were paying those bills by selling their bitcoins. That's over now, and bitcoin is rallied about 30% since Tax Day because of that. So, yes, bitcoin is getting so big that it is starting to affect the chip sector meaningfully. That is another reason why we see secular long-term growth in the entire chip sector.
Mike Pisani: Interesting take on bitcoin today, and I've been with you on it. I think the worst of it is over; it's going to go. Today is the largest volume day we've seen on it so far. We're up over 15,500 contracts traded.
Q: If you're 100% cash, is now a good time to commit funds to the equity market?
A. Franz, I would say nein. Absolutely not. 2009 was the time to commit funds to the equity market. If you're 100% cash now I would stay out for the next six months. We may get a good entry point over the summer or the fall. I'll let you know when that happens because I will be jumping back in myself.
But right now, a week ahead of the worst six months of equity investment of the year, I would stay away and do research instead. Read your Mad Hedge Fund Trader letters. Build a list of names that you're going to buy on the next meltdown and practice buying meltdowns with your practice account, which doesn't use real money.
There's a lot of things you can get ready to do for the next leg up in the bull market, but buying right now, NO! I would put that in the category of, "Is it time to start shorting bonds question?" that we got a few minutes ago.
Q: Why did tech stocks sell off when they have great earnings results?
A: It's called, "Buy the rumor, sell the news." So many people already own the stocks and were expecting good earnings that there was no surprise when they were announced. These are some of the most over-owned stocks in history.
Everybody in the world owns them. Many people have multiple weightings in them, so when we enter a high-risk macro environment, which we have now, you want to get rid of the most over-owned stocks. That is exactly why all of these stocks that have had great runs are selling off, even though they have great earnings report.
Q: Are financials a good play here with interest rates rising though 3%?
A. Normally I would say yes. However, the macro background for the general market are so negative they are overwhelming any positive fundamentals specific to individual sectors like banks and stocks like Citigroup (C). By the way, financials all reported great results and got killed, so that is why I bailed out of my (C) position this morning at around cost. If you throw the best news in the world on a stock and it won't go up, it's time to get out of there.
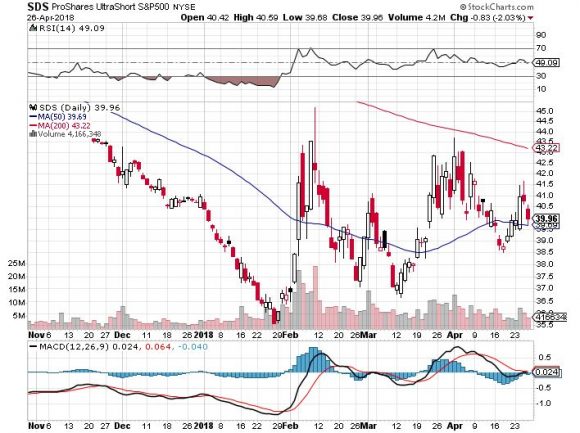
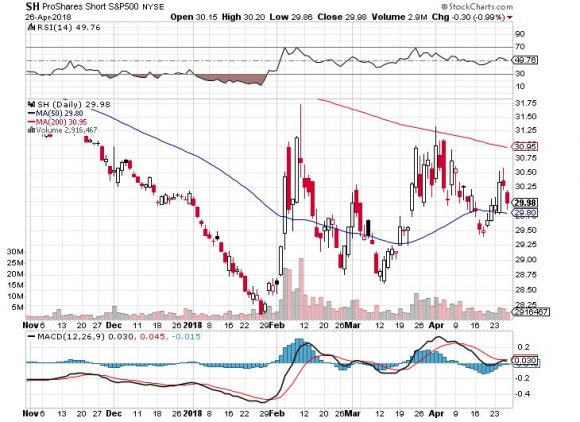
Q: Would an unleveraged inverse ETF like the ProShares Short S&P 500 ETF (SH) be good at a spike even now?
A. Yes, but when I say spike up better expect at least 20 (SPY) points or 1,000 Dow points. All these downside ETFs are great but you've got to get in at the right price. You know as they say in trading school, the profit is always made on the "BUY" and not on the "SELL."
So, if you can get on one of these super spikes up on the short side that is a great trade. So is the ProShares Ultra Short ETF (SDS) if you want to do the 2X leverage short fund. We've recently started doing this every month. We've been shorting (SPY)s and buying (VIX) on every one of these spikes up, and it's been working like a charm.
Q: Here's the best question of the day. Your timing has been perfect says Mary in Chicago, Ill.
A: Well, I'll take that kind of question all day long. Thank you very much. You're too nice to do that.
Q: Richard is asking would you buy an NVIDIA (NVDA) LEAP?
A: I would wait for meltdown days. Remember this is a market that gives you lots of meltdown days. Just wait for the next presidential tweet and you might get another 600-700-point dip in the markets. Those are the days you buy LEAPS. You don't have to get buy writing Trade Alerts like I do. You can just enter a limit order in your account. Put it as a stupidly low level to "BUY" and you may get hit. And that's where you really make the big money in this kind of market.
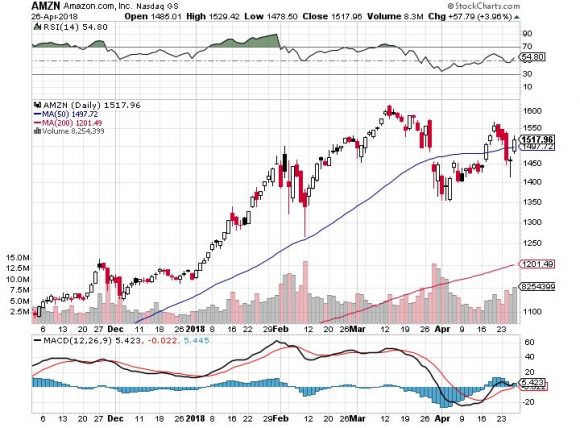
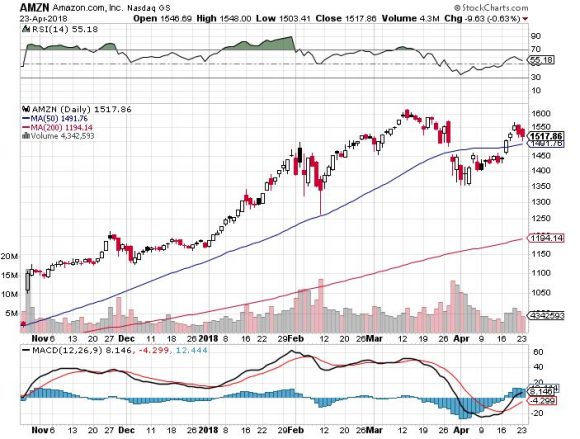
Q: Is there a good one- or two-month trade in Amazon?
A: Yeah, Paul, with this volatility you can pick a big winner like Amazon and you know to buy the 250-point dips and sell the rallies. These ranges are so wide now that even a beginner can make money. So, I would say you have to wait until after tomorrow on Amazon and let them get their earnings out. We know they're going to be great. They're doing home deliveries now to your car.
Q: Can long bond interest rates go up to 4%, and if that happens what would the market do?
A: Yes, they can go up to 4%, and I expect them to probably do that next year. What will it do to the market? Answer: Cause a bear market and a recession. Is that answer clear enough? My bet is that interest rates cap in this cycle much lower than they did in past cycles, maybe 4%-5%. We have been used to zero cost of money for so long that a move to 4% would be like stabbing somebody in the chest. People are much less able to deal with rising rates than they ever have been in the past, so watch this space.
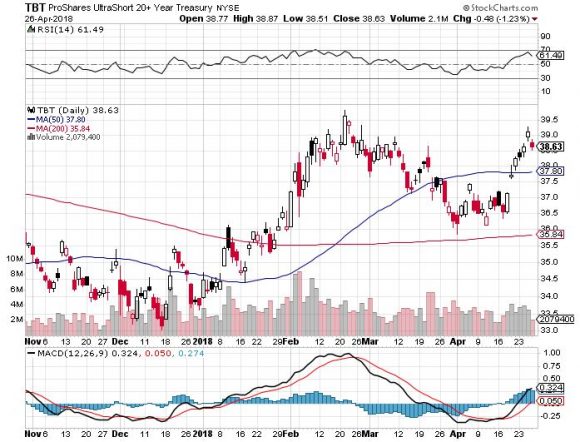
Q: Should I buy the ProShares Ultra Short Treasury ETF (TBT) or the iShares 20+ Year Treasury Bond Fund (TLT)?
A: Brad, it's really is a leverage question for you. The (TLT) is 1X; the TBT is 2X, so I would be taking profits on the (TBT) here and then buying a couple of points lower. Or if you want to keep it for the long term you can but remember the cost of carry on the TBT is around 7% a year.
Q: Yves in Paris, France is asking: What possible scenario will you see material wage growth that could lead to higher inflation?
A: We're starting to see that now with the ultra-low unemployment rates. People are having great difficulty hiring anyone in technology. But at the minimum wage level there seems to be plenty of supply. The other possibility is that the cost of everything else goes up but wages, because technology is replacing jobs so fast there may never be any increase in wages.
So, we will get inflation, but nothing like the inflation we saw in the past driven by rising wages, commodity prices, oil prices, and interest rates. Yes, money is a commodity, which can add quite a lot to the cost of leveraged companies like airlines, REITs, and so on.
Q: Will rising interest rates force the US dollar up?
A. The answer is yes! It has been a long time coming, but if rates continue to rise from here, you can expect that to lead to a continuously rising dollar and falling foreign currencies, and that will become a major drag on the economy and corporate earnings going forward.
Q: When is a good time to buy TIPS?
A: Just like your Treasury bond short, I would buy Treasury Inflation Protected Securities (TIPS) on the next rally in bond prices (TLT) and dip in yields. That will give you a decent entry point. That said, TIPS have been a horrible performer for the last 10 years because there has just been no inflation. A lot of people just keep TIPS as a hedge in their portfolio and it just costs them money every year.
Q: Which could blow up, Brad wants to know, TBT or TLT?
A: The easy answer there is probably neither. But if I had to pick between the two, the (TBT) would be the one to blow up because it's a 2X and has a lot less liquidity. So, I can't image in what world has (TBT) blowing up, but then I don't watch zombie TV shows either.
Q: I think US equities are expensive. Are emerging markets (EEM) or Europe (HEDJ) a better bet for the rest of the year?
A: I would say yes. Because if interest rates here in the US go higher that means a stronger dollar. That means a weaker US stock market. Because US companies are punished by a rising dollar. And European and Asian companies benefit from a rising dollar and falling home currencies, so that makes Europe the first choice of any of the global markets.
Q: Does oil going to $100 have a chance of bringing down the US economy?
A: Absolutely yes. If oil prices don't start to slow down, they will start having a big impact on the economy because that means rising prices for any energy consumer, which is you and me.
With no ability to offset that by rising prices of your products that would put a squeeze on any oil consuming industry, which is why things like the transports and consumer staples have been performing so poorly. If we get to $100, then you're really looking at a full-on recession and bear market for stocks. By bear market I mean down 25% or more in stocks.
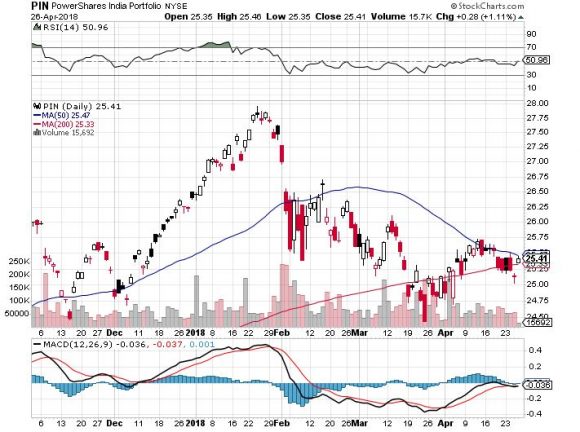
Q: How do you see the India ETF?
A: We like it. India is the No. 1 pick of any hedge fund investor in emerging markets, and the ETF you can buy there is the PowerShares India Portfolio ETF (PIN).
Featured Trade:
(DON'T MISS THE APRIL 25 GLOBAL STRATEGY WEBINAR),
(MONDAY, JUNE 11, FORT WORTH, TEXAS, GLOBAL STRATEGY LUNCHEON)
(WHY INDEXERS ARE TOAST),
(VIX), (VXX), (SPY), (AAPL), (HACK),
Hardly a day goes by without some market expert predicting that it's only a matter of time before machines completely take over the stock market.
Humans are about to be tossed into the dustbin of history.
Recently, money management giant BlackRock, with a staggering $5.4 trillion in assets under management, announced that algorithms would take over a much larger share of the investment decision-making process.
Exchange Traded Funds (ETFs) are adding fuel to the fire.
By moving capital out of single stocks and into baskets, you are also sucking the volatility, and the vitality out of the market.
This is true whether money is moving into the $237 billion S&P 500 (SPY), or the miniscule $1 billion PureFunds ISE Cyber Security ETF (HACK), which holds only 30 individual names.
The problem is being greatly exacerbated by the recent explosive growth of the ETF industry.
In the past five years, the total amount of capital committed to ETFs has doubled to more than $3 trillion, while the number of ETFs has soared to well over 2,000.
In fact, there is now more money committed to ETFs than publicly listed single stocks!
While many individual investors say they are moving into ETFs to save on commissions and expenses, in fact, the opposite is true.
You just don't see them.
They are buried away in wide-dealing spreads and operating expenses buried deeply in prospectuses.
The net effect of the ETF industry is to greatly enhance Wall Street's take from their brokerage business, i.e., from YOU.
Every wonder why the shares of the big banks are REALLY trading at new multi-year highs?
I hate to say this, but I've seen this movie before.
Whenever a strategy becomes popular, it carries with it the seeds of its own destruction.
The most famous scare was the "Portfolio Insurance" of the 1980s, a proprietary formula sold to institutional investors that allegedly protected them by automatically selling in down markets.
Of course, once everyone was in the boat, the end result was the 1987 crash, which saw the Dow Average plunge 20% in one day.
The net effect was to maximize everyone's short positions at absolute market bottoms.
A lot of former portfolio managers started driving Yellow Cabs after that one!
I'll give you another example.
Until 2007, every computer model in the financial industry said that real estate prices only went up.
Trillions of dollars of derivative securities were sold based on this assumption.
However, all of these models relied on only 50 years' worth of data dating back to the immediate postwar era.
Hello subprime crisis!
If their data had gone back 70 years, it would have included the Great Depression.
The superior models would have added one extra proviso - that real estate can collapse by 90% at any time, without warning, and then stay down for a decade.
The derivate securities based on THIS more accurate assumption would have been priced much, much more expensively.
And here is the basic problem.
As soon as money enters a strategy, it changes the behavior of that strategy.
The more money that enters, the more that strategy changes, to the point where it produces the opposite of the promised outcome.
Strategies that attract only $10 million market-wide can make 50% a year returns or better.
But try and execute with $1 billion, and the identical strategies lose money. Guess what happens at $1 trillion?
This is why high frequency traders can't grow beyond their current small size on a capitalized basis, even though they account for 70% of all trading.
I speak from experience.
During the 1980s I used a strategy called "Japanese Equity Warrant Arbitrage," which generated a risk-free return of 30% a year or more.
This was back when overnight Japanese yen interest rates were at 6%, and you could buy Japanese equity warrants at parity with 5:1 leverage (5 X 6 = 30).
When there were only a tiny handful of us trading these arcane securities, we all made fortunes. Every other East End London kid was driving a new Ferrari (yes, David, that's you!).
At its peak in 1989, the strategy probably employed 10,000 people to execute and clear in London, Tokyo, and New York.
However, once the Japanese stock market crash began in earnest, liquidity in the necessary instruments vaporized, and the strategy became a huge loser.
The entire business shut down within two years. Enter several thousand new Yellow Cab drivers.
All of this means that the current indexing fad is setting up for a giant fall.
Except that this time, many managers are going to have to become Uber drivers instead.
Computers are great at purely quantitative analysis based on historical data.
Throw emotion in there anywhere, and the quants are toast.
And, at the end of the day, markets are made up of high emotional human beings who want to get rich, brag to their friends, and argue with their spouses.
In fact, the demise has already started.
Look no further than investment performance so far in 2018.
The (SPY) is up a scant 0% this year.
Amazon (AAPL), on the other hand, one of the most widely owned stocks in the world, is up an eye-popping 30%.
If you DON'T own Amazon, you basically don't HAVE any performance to report for 2017.
I'll tell you my conclusion to all of this.
Use a combination of algorithms AND personal judgment, and you will come out a winner, as I do. It also helps to have 50 years of trading experience.
You have to know when to tell your algorithm a firm "NO."
While your algo may be telling you to "BUY" ahead of a monthly Nonfarm Payroll Report or a presidential election, you may not sleep at night if you do so.
This is how I have been able to triple my own trading performance since 2015, taking my 2017 year-to-date to an enviable 20%.
It's not as good as being 30% invested in Amazon.
But it beats the pants off of any passive index all day long.
Yup, This is a Passive Investor
https://madhedgefundtrader.com/wp-content/uploads/2019/05/cropped-mad-hedge-logo-transparent-192x192_f9578834168ba24df3eb53916a12c882.png00MHFTRhttps://madhedgefundtrader.com/wp-content/uploads/2019/05/cropped-mad-hedge-logo-transparent-192x192_f9578834168ba24df3eb53916a12c882.pngMHFTR2018-04-24 01:06:262018-04-24 01:06:26Why Indexers Are Toast
Featured Trade:
(THE MARKET OUTLOOK FOR THE WEEK AHEAD, or HERE COMES THE FOUR HORSEMEN OF THE APOCALYPSE),
(SPY), (GOOGL), (TLT), (GLD), (AAPL), (VIX), (VXX), (C), (JPM), (HOW TO AVOID PONZI SCHEMES),
(TESTIMONIAL)
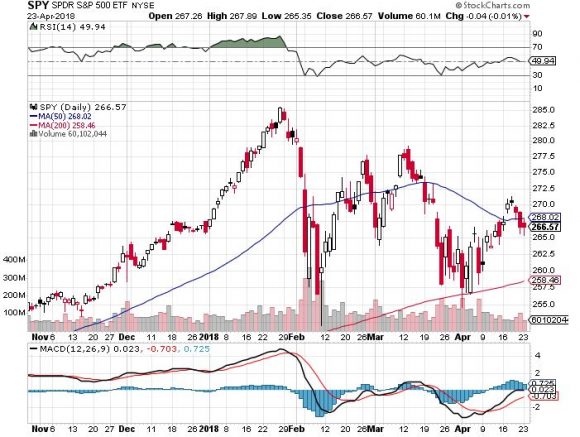
Because if you are an index player, you get to do it all over again. For the major stock indexes are now unchanged on the year. In effect, it is January 1 once more.
Unless of course you are a follower of the Mad Hedge Fund Trader. In that case, you are up an eye-popping 19.75% so far in 2018. But more on that later.
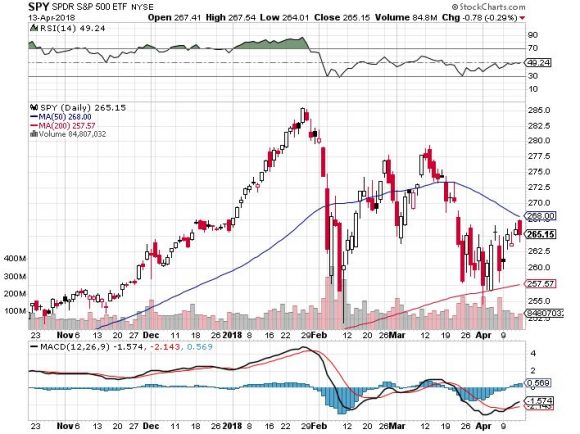
Last week we caught the first glimpse in this cycle of the investment Four Housemen of the Apocalypse. Interest rates are rising, the yield on the 10-year Treasury bond (TLT) reaching a four-year high at 2.96%. When we hit 3.00%, expect all hell to break loose.
The economic data is rolling over bit by bit, although it is more like a death by a thousand cuts than a major swoon. The heavy hand of major tariff increases for steel and aluminum is making itself felt. Chinese investment in the US is falling like a rock.
The duty on newsprint imports from Canada is about to put what's left of the newspaper business out of business. Gee, how did this industry get targeted above all others?
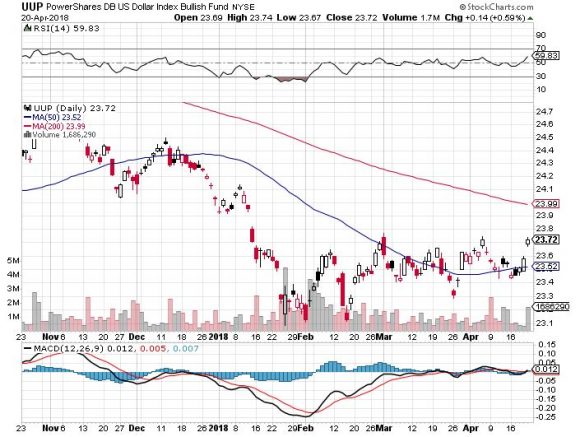
The dollar is weak (UUP), thanks to endless talk about trade wars.
Anecdotal evidence of inflation is everywhere. By this I mean that the price is rising for everything you have to buy, like your home, health care, college education, and website upgrades, while everything you want to sell, such as your own labor, is seeing the price fall.
We're not in a recession yet. Call this a pre-recession, which is a long-leading indicator of a stock market top. The real thing shouldn't show until late 2019 or 2020.
There was a kerfuffle over the outlook for Apple (AAPL) last week, which temporarily demolished the entire technology sector. iPhone sales estimates have been cut, and the parts pipeline has been drying up.
If you're a short-term trader, you should have sold your position in April 13 when I did. If you are a long-term investor, ignore it. You always get this kind of price action in between product cycles. I still see $200 a share in 2018. This too will pass.
This month, I have been busier than a one-armed paper hanger, sending out Trade Alerts across all asset classes almost every day.
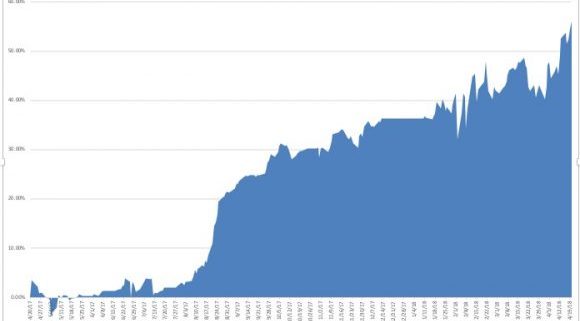
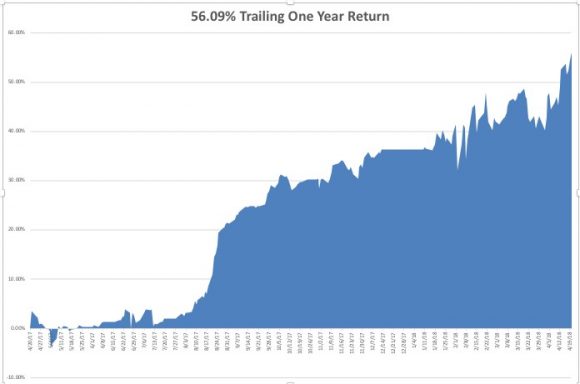
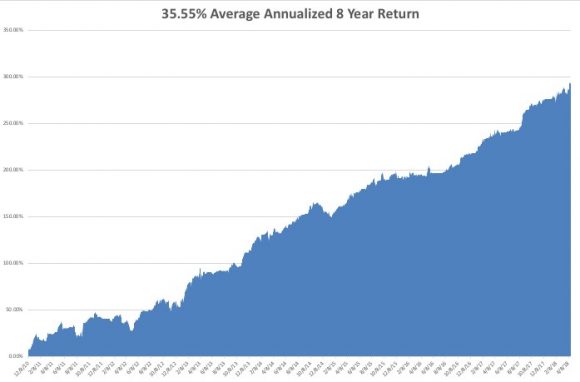
Last week, I bought the Volatility Index (VXX) at the low, took profits in longs in gold (GLD), JP Morgan (JPM), Alphabet (GOOGL), and shorts in the US Treasury bond market (TLT), the S&P 500 (SPY), and the Volatility Index (VXX). It is amazing how well that "buy low, sell high" thing works when you actually execute it. As a result, profits have been raining on the heads of Mad Hedge Trade Alert followers. That brings April up to an amazing +12.99% profit, my 2018 year-to-date to +19.75%, my trailing one-year return to +56.09%, and my eight-year performance to a new all-time high of 296.22%. This brings my annualized return up to 35.55% since inception.
The last 14 consecutive Trade Alerts have been profitable. As for next week, I am going in with a net short position, with my stock longs in Alphabet (GOOGL) and Citigroup (C) fully hedged up.
And the best is yet to come!
I couldn't help but laugh when I heard that Republican House Speaker Paul Ryan announced his retirement in order to spend more time with his family. He must have the world's most unusual teenagers.
When I take my own teens out to lunch to visit with their friends, I have to sit on the opposite side of the restaurant, hide behind a newspaper, wear an oversized hat, and pretend I don't know them, even though the bill always mysteriously shows up on my table.
This will be FANG week on the earnings front, the most important of the quarter.
On Monday, April 23, at 10:00 AM, we get March Existing-Home Sales. Expect the Sohn Investment Conference in New York to suck up a lot of airtime. Alphabet (GOOGL) reports.
On Tuesday, April 24, at 8:30 AM EST, we receive the February S&P CoreLogic Case-Shiller Home Price Index, which may see prices accelerate from the last 6.3% annual rate. Caterpillar (CAT) and Coca Cola (KO) report.
On Wednesday, April 25, at 2:00 PM, the weekly EIA Petroleum Statistics are out. Facebook (FB), Advanced Micro Devices (AMD), and Boeing (BA) report.
Thursday, April 26, leads with the Weekly Jobless Claims at 8:30 AM EST, which saw a fall of 9,000 last week. At the same time, we get March Durable Goods Orders. American Airlines (AAL), Raytheon (RTN), and KB Homes (KBH) report.
On Friday, April 27, at 8:30 AM EST, we get an early read on US Q1 GDP.
We get the Baker Hughes Rig Count at 1:00 PM EST. Last week brought an increase of 8. Chevron (CVX) reports.
As for me, I am going to take advantage of good weather in San Francisco and bike my way across the San Francisco-Oakland Bay Bridge to Treasure Island.
Good Luck and Good Trading.
https://www.madhedgefundtrader.com/wp-content/uploads/2018/04/Trailing-one-year-story-1-image-1-2-e1524264283463.jpg384580MHFTRhttps://madhedgefundtrader.com/wp-content/uploads/2019/05/cropped-mad-hedge-logo-transparent-192x192_f9578834168ba24df3eb53916a12c882.pngMHFTR2018-04-23 01:08:102018-04-23 01:08:10The Market Outlook for the Week Ahead, or Here Comes The Four Horsemen of the Apocalypse
Featured Trade:
(THE MARKET OUTLOOK FOR THE WEEK AHEAD, or THE WEEK THAT NOTHING HAPPENED),
(TLT), (GLD), (SPY), (QQQ), (USO), (UUP),
(VXX), (GOOGL), (JPM), (AAPL),
(HOW TO HANDLE THE FRIDAY, APRIL 20 OPTIONS EXPIRATION), (TLT), (VXX), (GOOGL), (JPM)
This was the week that American missiles were supposed to rain down upon war-torn Syria, embroiling Russia in the process. It didn't happen.
This was the week that the president was supposed to fire special prosecutor Robert Mueller, who with his personal lawyer is currently reading his private correspondence for the past decade with great interest. That didn't happen either.
It was also the week that China was supposed to raise the stakes in its trade war with the United States. Instead, President Xi offered a conciliatory speech, taking the high road.
What happens when you get a whole lot of nothing?
Stocks rally smartly, the S&P 500 (SPY) rising by 2.87% and the NASDAQ (QQQ) tacking on an impressive 3.45%. Several of the Mad Hedge long positions jumped by 10%.
And that pretty much sums up the state of the market today.
Get a quiet week and share prices will naturally rise, thanks to the power of that fastest earnings growth in history, stable interest rates, a falling dollar, and gargantuan share buybacks that are growing by the day.
With a price earnings multiple of only 16, shares are offering investors the best value in three years, and there is very little else to buy.
This is why I am running one of the most aggressive trading books in memory with a 70% long 30% short balance.
Something else unusual happened this week. I added my first short position of the year in the form of puts on the S&P 500 right at the Friday highs.
And, here is where I am sticking to my guns on my six-month range trade call. If you buy every dip and sell every rally in a market that is going nowhere, you will make a fortune over time.
Provided that the (SPY) stays between $250 and $277 that is exactly what followers of the Mad Hedge Fund Trader are going to do.
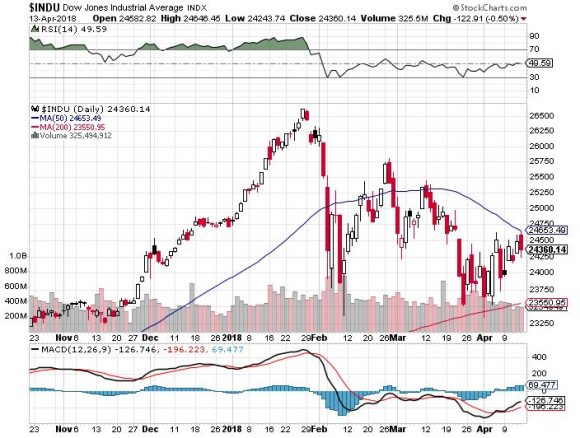
By the way, 3 1/2 months into 2018, the Dow Average is dead unchanged at 24,800.
Will next week be so quiet?
I doubt it, which is why I'm starting to hedge up my trading book for the first time in two years. Washington seems to be an endless font of chaos and volatility, and the pace of disruption is increasing.
The impending attack on Syria is shaping up to more than the one-hit wonder we saw last year. It's looking more like a prolonged air, sea, and ground campaign. When your policies are blowing up, nothing beats like bombing foreigners to distract attention.
Expect a 500-point dive in the Dow Average when this happens, followed by a rapid recovery. Gold (GLD) and oil prices (USO) will rocket. The firing of Robert Mueller is worth about 2,000 Dow points of downside.
Followers of the Mad Hedge Trade Alert Service continued to knock the cover off the ball.
I continued to use weakness to scale into long in the best technology companies Alphabet (GOOGL) and banks J.P. Morgan Chase (JPM), and Citigroup (C). A short position in the Volatility Index (VXX) is a nice thing to have during a dead week, which will expire shortly.
As hedges, I'm running a double short in the bond market (TLT) and a double long in gold (GLD). And then there is the aforementioned short position in the (SPY). I just marked to market my trading book and all 10 positions are in the money.
Finally, I took profits in my Apple (AAPL) long, which I bought at the absolute bottom during the February 9 meltdown. I expect the stock to hit a new all-time high in the next several weeks.
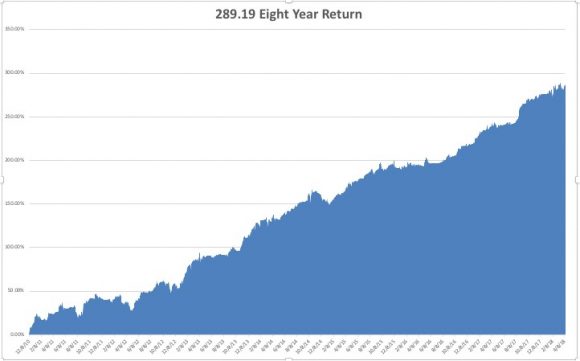
That brings April up to a +5.81% profit, my trailing one-year return to +50.23%, and my eight-year average performance to a new all-time high of 289.19%. This brings my annualized return up to 34.70%.
The coming week will be a slow one on the data front. However, there has been a noticeable slowing of the data across the board recently.
Is this a one-off weather-related event, or the beginning of something bigger? Is the trade war starting to decimate confidence and drag on the economy?
On Monday, April 16, at 8:30 AM, we get March Retail Sales. Bank of America (BAC) and Netflix (NFLX) report.
On Tuesday, April 17, at 8:30 AM EST, we receive March Housing Starts. Goldman Sachs (GS) and United Airlines (UAL) report.
On Wednesday, April 18, at 2:00 PM, the Fed Beige Book is released, giving an insider's view of our central bank's thinking on interest rates and the state of the economy. Morgan Stanley (MS) and American Express (AXP) report.
Thursday, April 19, leads with the Weekly Jobless Claims at 8:30 AM EST, which saw a fall of 9,000 last week. Blackstone (BX) and Nucor (NUE) report.
On Friday, April 20, at 10:00 AM EST, we get the Baker Hughes Rig Count at 1:00 PM EST. Last week brought an increase of 8. General Electric (GE) and Schlumberger (SLB) report.
As for me, I'll be heading into San Francisco's Japantown this weekend for the annual Northern California Cherry Blossom Festival. I'll be viewing the magnificent flowers, listening to the Taiko drums, eating sushi, and practicing my rusty Japanese.
Good Luck and Good Trading.
https://www.madhedgefundtrader.com/wp-content/uploads/2018/04/Japan-pix-story-1-image-6.jpg330219MHFTRhttps://madhedgefundtrader.com/wp-content/uploads/2019/05/cropped-mad-hedge-logo-transparent-192x192_f9578834168ba24df3eb53916a12c882.pngMHFTR2018-04-16 01:07:542018-04-16 01:07:54The Market Outlook for the Week Ahead, or The Week That Nothing Happened
Legal Disclaimer
There is a very high degree of risk involved in trading. Past results are not indicative of future returns. MadHedgeFundTrader.com and all individuals affiliated with this site assume no responsibilities for your trading and investment results. The indicators, strategies, columns, articles and all other features are for educational purposes only and should not be construed as investment advice. Information for futures trading observations are obtained from sources believed to be reliable, but we do not warrant its completeness or accuracy, or warrant any results from the use of the information. Your use of the trading observations is entirely at your own risk and it is your sole responsibility to evaluate the accuracy, completeness and usefulness of the information. You must assess the risk of any trade with your broker and make your own independent decisions regarding any securities mentioned herein. Affiliates of MadHedgeFundTrader.com may have a position or effect transactions in the securities described herein (or options thereon) and/or otherwise employ trading strategies that may be consistent or inconsistent with the provided strategies.