Long-term observers of financial markets are befuddled, confused, and amazed at their complete lack of interest in the rapidly unfolding events in the Middle East.
It seems that the more horrific the atrocities, the higher stock prices want to climb.
Go figure.
ISIS is in fact accelerating the most important geopolitical event so far in this century, the rapprochement of relations between the U.S. and Iran, which have been in a deep freeze for 40 years.
A serious dialogue has not been held between these two countries since 52 hostages were seized at the American embassy in Tehran in 1979 and held for 444 days.
The Mullahs in Iran can?t help but notice last week?s U.S. air strikes to protect Shiite cities from a Sunni slaughter at the hands of ISIS. Suddenly, our natural enemy in the region has become our natural ally.
The Iranians have even offered to back up our air power with their ground forces, an offer the Obama administration has so far wisely turned down.
Don?t worry about ISIS. Their threat is being wildly overrated by the media.
There is a reason why terrorist groups have never held territory before. That makes them a big fat target for drones, smart bombs, and all the other types of fire that we rain down upon our enemies from above. This may be the first war in history entirely fought by drones on our side. That means it will be cheap, without casualties, and over quickly.
So what will the new treaty and peace between the U.S. and Iran bring us?
So far, Iran has agreed to a freeze on its nuclear enrichment program in exchange for international inspections and the unfreezing of $100 billion of their assets. Secret negotiations are being held intermittently in Geneva, Switzerland (I stopped by to say hello a few weeks ago).
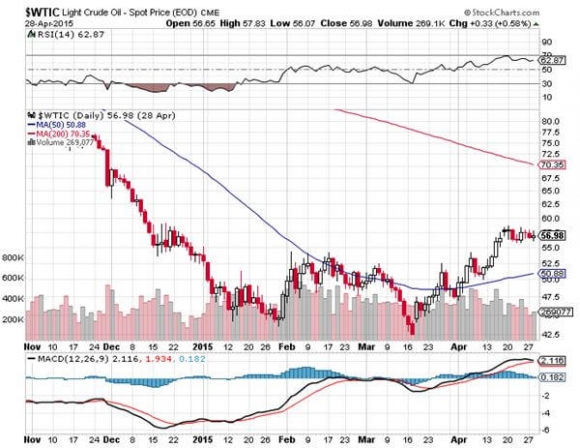
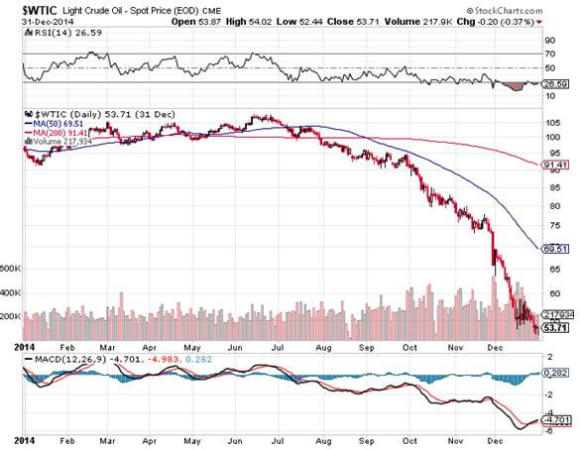
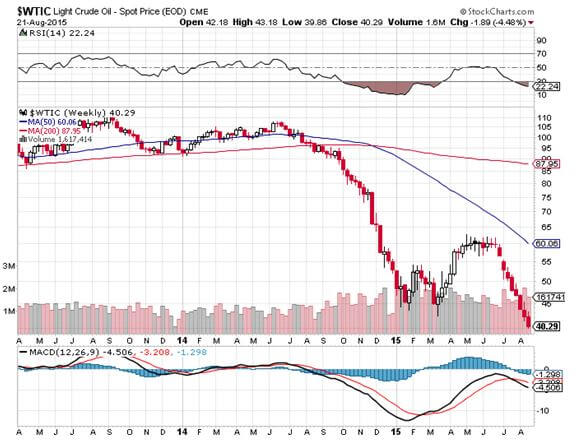
This is unbelievably positive for all asset classes, except energy. This is the cause of the recent collapse of oil prices, which are now 65% off their 2014 high.
The US is now in a tremendously powerful negotiating position. If Iran dumps their nuclear program to our satisfaction, Iran then gets the carrot.
It will rejoin the world economy, unfreeze the rest of its assets and recover $100 billion a year in trade. The country?s banks will be allowed to rejoin U.S. dollar clearing, the $1 trillion a day CHIPS and SWIFT systems, their absence from which has been a deathblow to their international trade.
Its oil exports (USO) can recover from 750,000 barrels a day back to the pre crisis level of 3 million barrels. If it doesn?t then it gets the stick again in six months, resuming their economic freefall.
The geopolitical implications for the U.S. are enormous.? Iran is the last major rogue state hostile to the US in the Middle East, and it is teetering. The final domino of the Arab spring falls squarely at the gates of Tehran.
A friendly, or at least a non-hostile Iran, means we really don?t care what happens in Syria.
Remember that the first real revolution in the region was Iran?s Green Revolution in 2009. That revolt was successfully suppressed with an iron fist by fanatical and pitiless Revolutionary Guards.
The true death toll will never be known, but is thought to be well into the thousands. The antigovernment sentiments that provided the spark never went away and they continue to percolate just under the surface.
At the end of the day, the majority of the Persian population wants to join the relentless tide of globalization. They want to buy iPods and blue jeans, communicate freely through their Facebook pages and Twitter accounts, and have the jobs to pay for it all.
Since 1979, when the Shah was deposed, a succession of extremist, ultraconservative governments ruled by a religious minority, have abjectly failed to cater to these desires
If Iran doesn?t do a deal on nukes soon, it?s economy with sink deeper into the morass in which they currently find themselves. The Iranian ?street? will figure out that if they spill enough of their own blood that regime change is possible and the revolution there will reignite.
The Obama administration is now pulling out all the stops to accelerate the process.
The oil embargo former Secretary of State, Hillary Clinton, organized is steadily tightening the noose, with heating oil and gasoline becoming hard to obtain.
Yes, Russia and China are doing what they can to slow the process. This is what the Ukraine crisis is really all about, an attempt to keep oil prices high, Russia?s biggest earner.
But conducting international trade through the back door is expensive, and prices are rocketing. The unemployment rate is 40%.? The Iranian Rial has collapsed by 50%.
Let?s see how docile these people remain when the air conditioning quits running because of power shortages. Iran is a rotten piece of fruit ready to fall off on its own accord and go splat. The US is doing everything she can to shake the tree.
No military action of any kind is required on America?s part. No shot has been fired. That?s a big deal when the shots cost $10,000 apiece.
The geopolitical payoff of such an event for the U.S. would be almost incalculable. A successful revolution will almost certainly produce a secular, pro-Western regime whose first priority will be to rejoin the international community and use its oil wealth to rebuild an economy now in tatters.
Oil will has completely lost its risk premium, once believed by the oil industry to be $30 a barrel. A looming supply could cause prices to drop to as low as $20 a barrel.
This price drop seen so far amount to a gigantic $2.18 trillion trillion tax cut for not just the US, but the entire global economy as well (92 million barrels a day X 365 days a year X $65).
Almost all funding of terrorist organizations will immediately dry up. I might point out here that this has always been the oil industry?s worst nightmare.
ISIS is a short.
At that point, the US will be without enemies, save for North Korea, and even the Hermit Kingdom could change with a new leader in place. A long Pax Americana will settle over the planet.
The implications for the financial markets will be enormous. The US will reap a peace dividend as large, or larger, than the one we enjoyed after the fall of the Soviet Union in 1992.
As you may recall, that black swan caused the Dow Average to soar from 2,000 to 10,000 in less than eight years, also partly fueled by the technology boom.
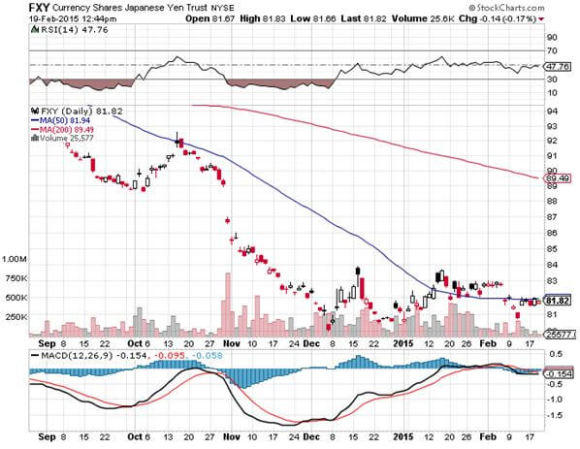
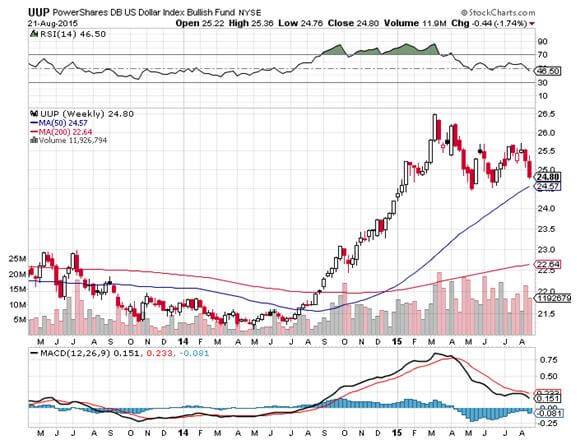
A collapse in oil imports will cause the U.S. dollar (UUP) to rocket.? An immediate halving of our defense spending to $400 billion or less and burgeoning new tax revenues would cause the budget deficit to collapse.
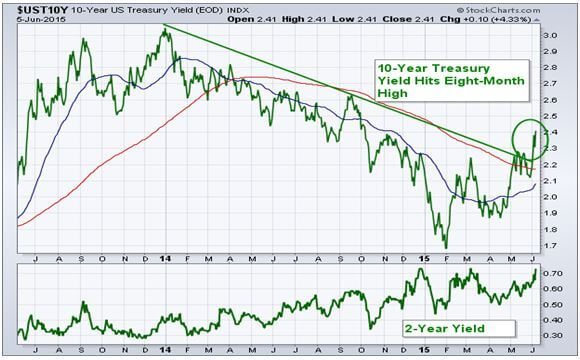
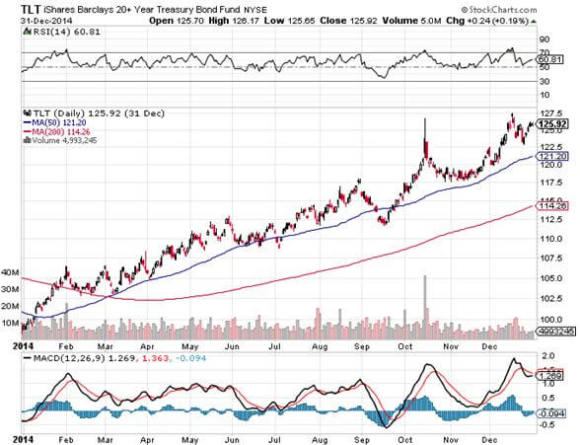
With the US government gone as a major new borrower, interest rates across the yield curve will fall further. The national debt completely disappears by the 2030?s (as it almost did during the late 1990?s).
A peace dividend will also cause US GDP growth to reaccelerate from 2% to 4%. Risk assets of every description will soar to multiples of their current levels, including stocks, junk bonds, commodities, precious metals, and food.
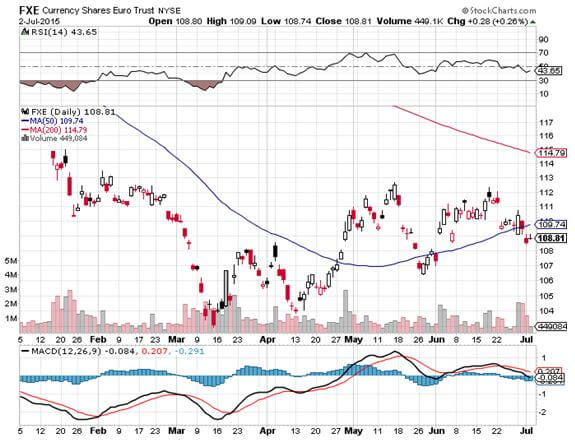
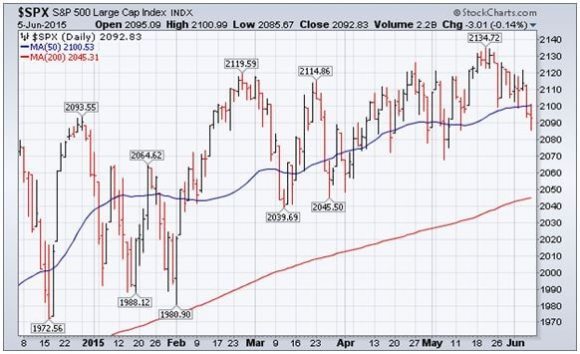
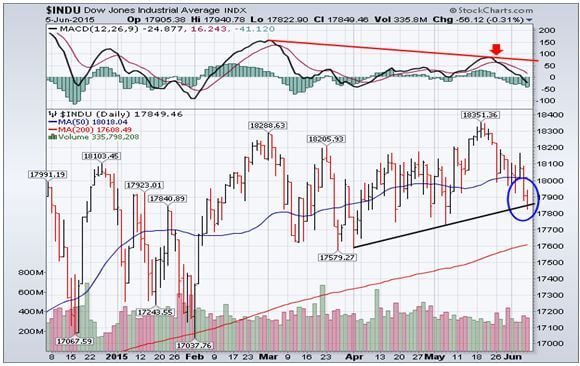
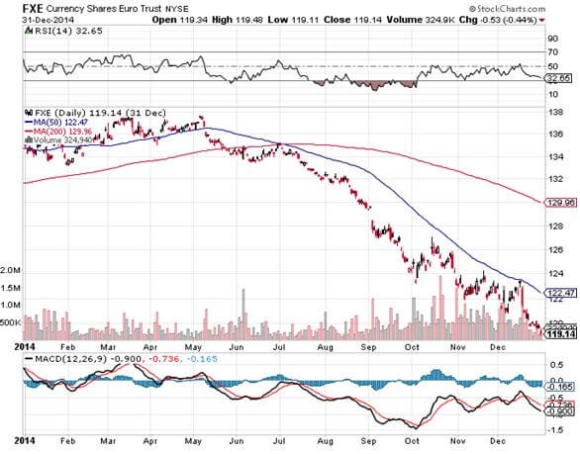
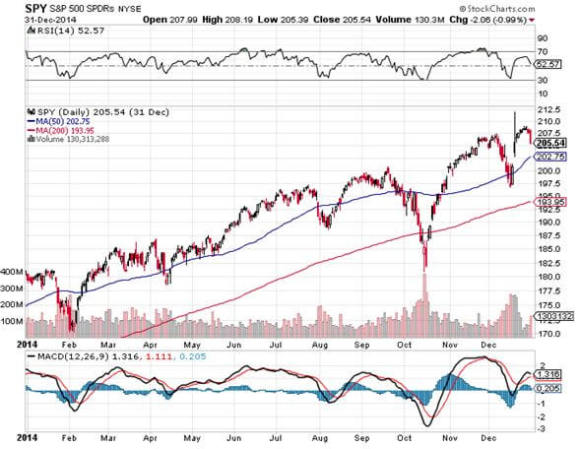
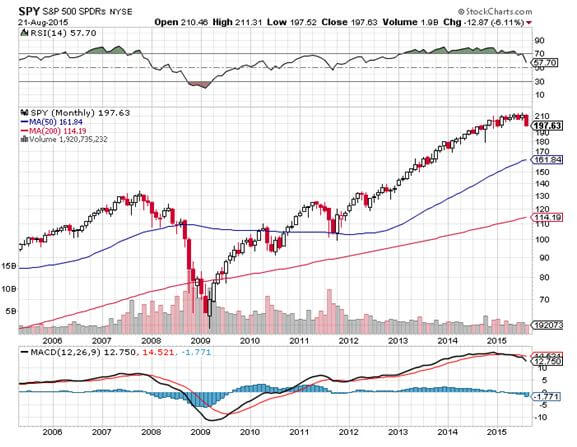
The Dow will soar to 30,000 and the S&P 500 (SPY) to 3,500, the Euro collapses to parity, gold rockets to $2,300 an ounce, silver flies to $100 an ounce, copper leaps to $6 a pound, and corn recovers $8 a bushel.
Some 2 million of the armed forces will get dumped on the job market as our manpower requirements shrink to peacetime levels. But a strong economy should be able to soak these well-trained and motivated people right up.
We will enter a new Golden Age, not just at home, but for civilization as a whole.
Wait, you ask, what if Iran develops an atomic bomb and holds the US at bay?
Don?t worry. There is no Iranian nuclear device. There is no real Iranian nuclear program large enough to threaten the United States. The entire concept is an invention of Israeli and American intelligence agencies as a means to put pressure on the regime.
According to them, Iran has been within a month of producing a tactical nuclear weapon for the last 30 years. I'm still waiting.
The head of the miniscule effort they have was assassinated by Israeli intelligence two years ago (a magnetic bomb, placed on a moving car, by a team on a motorcycle, nice!).
If Iran had anything substantial in the works, the Israeli planes would have taken off a long time ago.
Even if Iran had one nuclear weapon, would they really want to attack a country with 6,700, the US?
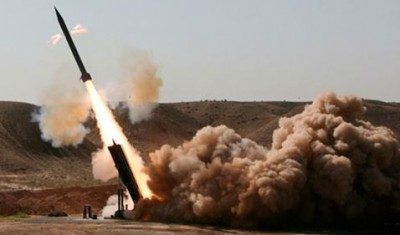
There is no plan to close the Straits of Hormuz, either. The training exercises in small rubber boats we have seen are done for CNN?s benefit, and comprise no credible threat.
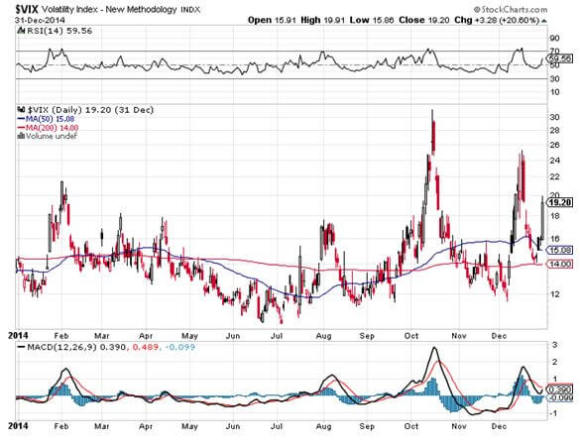
I am a firm believer in the wisdom of markets, and that the marketplace becomes aware of major history changing events well before we mere individual mortals do.
The Dow began a 25-year bull market the day after American forces defeated the Japanese in the Battle of Midway in May of 1942, even though the true outcome of that confrontation was kept top secret for years.
If the advent of a new, docile Iran were going to lead to a global multi-decade economic boom and the end of history, how would the stock markets behave now?
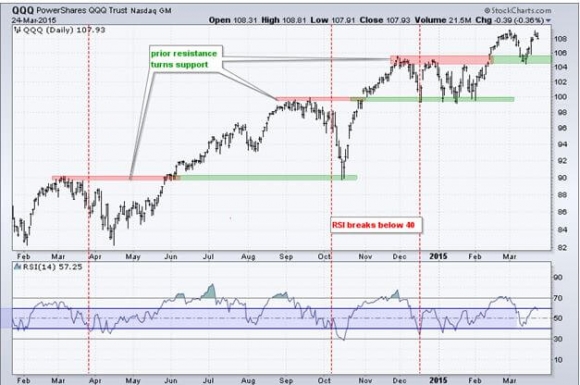
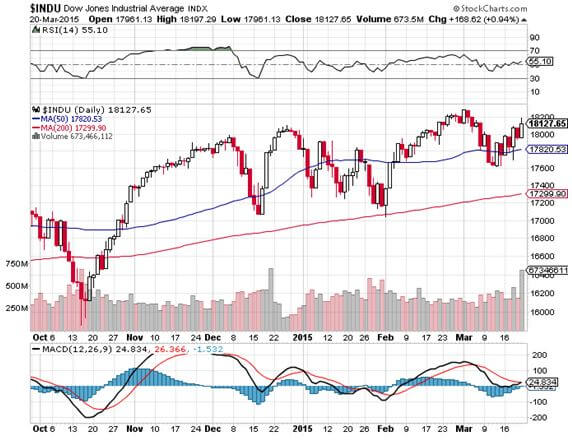
They would remain in a long-term bull market, much like we have seen for the past six years. That?s why 10% corrections have been few and far between.
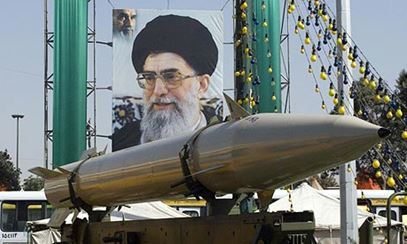
![Nuclear Missile - Ayatollan Ali Khamenei]() The Problem is That it?s a Hollow Threat
The Problem is That it?s a Hollow Threat