Featured Trade: (SPECIAL UPDATE ON THE OIL COLLAPSE), (USO), (XOM), (OXY), (COP), (LINE)
United States Oil Fund LP (USO) Exxon Mobil Corporation (XOM) Occidental Petroleum Corporation (OXY) ConocoPhillips (COP) Linn Energy, LLC (LINE)
?
The Middle East is a miserable place to be during Ramadan, a month where the faithful reevaluate their lives and recommit to the teachings of Islam. This year it runs from June 17 to July 17.
During this period, the Muslims are not permitted to eat or drink from sunrise to sunset, or criticize others, or engage in a long list of other hurtful activities.
Although infidels, such as myself, are exempt from these rules, living amidst a population subject to these eighth century laws can be wearing. Everyone is starving, exhausted, and in a foul mood. Restaurants don?t open until sunset. Then people party all night, keeping you awake.
In the more fundamentalist conservative countries, like Saudi Arabia, Oman, and Kuwait, the Religious Police beat offenders with sticks and clubs that they come across in public.
That includes those eating, drinking, or women wearing immodest dress, like short pants and tank tops. Did I mention it reached 120 degrees yesterday in those countries?
As a result, anyone who can afford to do so flees to more liberal regimes during the fasting period, like Turkey, Egypt, and Morocco.
As a result, I am bumping into quite a few interesting people in the five star hotels here who have quite a lot to say about the price of oil.
A rash of hurried negotiations has suddenly broken out between American and European oil majors and the government of Iran. The word is out. Iran is going to imminently cave on US demands of inspections of nuclear facilities, especially the military ones.
The fact that this is all happening now is no coincidence. According to the Koran, Ramadan is a time to ?make peace with those who have wronged us.?
The hard numbers being assigned to these contracts is having the effect of increasing the size of the carrot for both the West and Iran to wind up the talks. The impact will be to permit Iran to rejoin the global economy for the first time in 36 years.
This paves the way for Iran to double its oil exports from 1.2 to 2.4 million barrels a day immediately, and then double them again once desperately needed energy infrastructure investments are made.
It won?t take long for this impending tsunami of oil to hit the markets. The Reuters news agency is reporting that 38 million barrels of Iranian oil are sitting in 15 VLCC tankers slow cruising the Persian Gulf and Indian Ocean.
The second the ink is dry on any US/Iran agreements, these ships are sailing for western and Asian ports to make delivery.
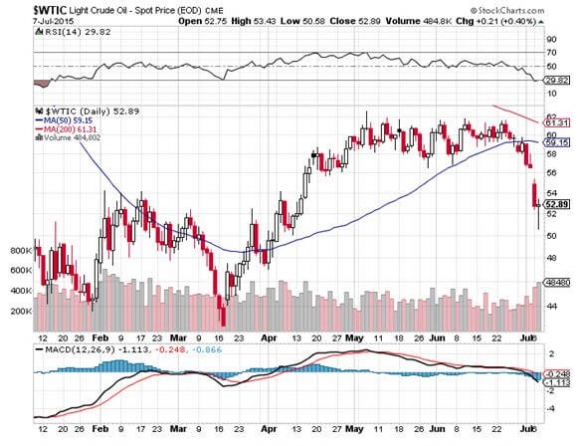
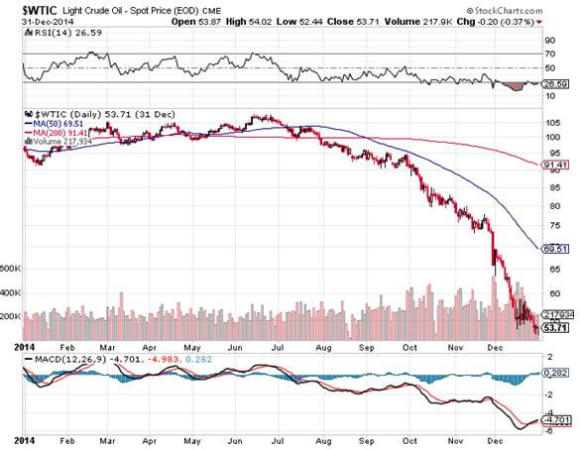
This is why you have seen a cataclysmic plunge in the price of Texas tea over the past few weeks, from $62 to $51, some 18%.
Saudi Arabia has responded to the decline by aggressively cutting prices for their largest customer, and ramping up production even more, in a determined effort to boost market share.
Therefore, the March low of $43 now seems within range, and maybe then some. You have already seen this in the contango for far month futures markets, which have widened fantastically. The world has returned to paying huge premiums for storage.
In case you missed the generational low at these prices four months ago, you now have another shot.
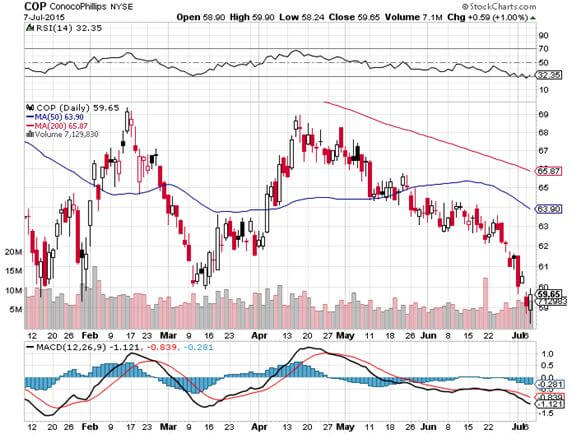
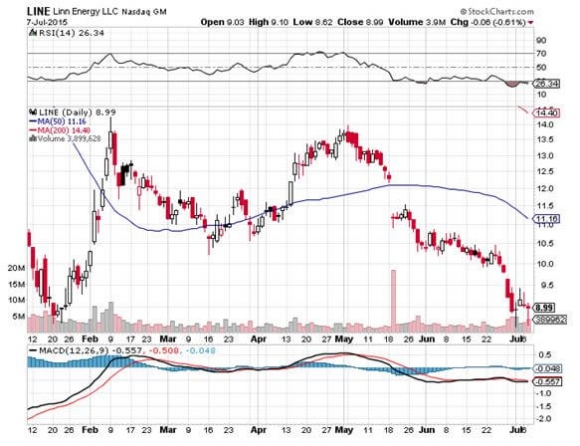
The share prices of my favorite oil plays, Exxon Mobile (XOM), Occidental Petroleum (OXY), Conoco Phillips (COP), and Linn Energy (LINE) all saw this route coming months ago and are already there.
In fact, the weak energy sector, which accounts for 10% of the S&P 500, was a major reason why the index failed to break out to new highs a few weeks ago.
I think that energy could be one of your seminal investment plays for the rest of 2015. Crude should make it back up to the $90 handle within the next three years, riding on the back of the global synchronized economic recovery.
After that, the question arises of whether the next move is to $10, as carbon based energy forms are replaced by alternatives on a large scale. Allow for a Moore?s Law type exponential growth of efficiencies, and we?ll soon be there.
That is Saudi Arabia?s current $5 per barrel cost of production, plus a 20% profit margin and $4 for shipping. Remember, it was only $8 as recently as 1998.
Just thought you?d like to know.
And now, back to my loyal rental camel, whose price, it turns out, is determined by, you guessed it, the price of oil.
Sometimes, You Have to Go to the Source
https://www.madhedgefundtrader.com/wp-content/uploads/2015/07/John-Thomas1-e1436361891975.jpg389400Mad Hedge Fund Traderhttps://madhedgefundtrader.com/wp-content/uploads/2019/05/cropped-mad-hedge-logo-transparent-192x192_f9578834168ba24df3eb53916a12c882.pngMad Hedge Fund Trader2015-07-08 09:26:132015-07-08 09:26:13July 8, 2015 - SPECIAL EDITION - Special Update on the Oil Collapse
We have several options positions that expire on Friday, and I just want to explain to the newbies how to best maximize their profits.
These include:
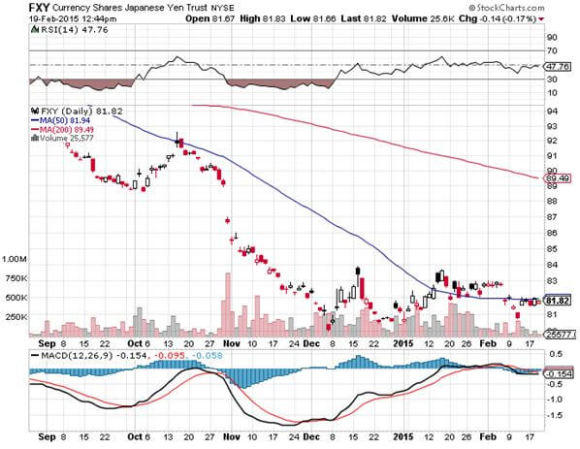
The Currency Shares Japanese Yen Trust (FXY) February $84-$87 vertical bear put spread
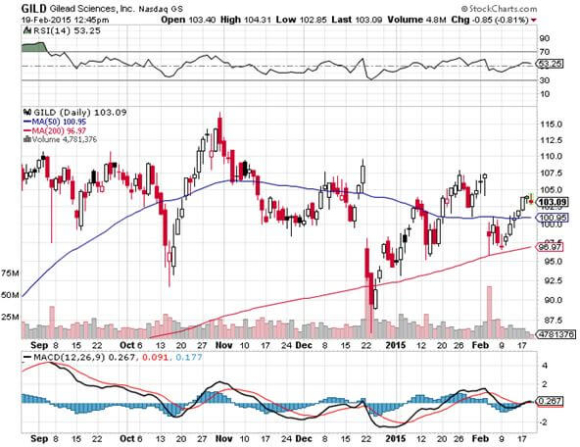
The Gilead Sciences (GILD) February $87.50-$92.50 vertical bull call spread
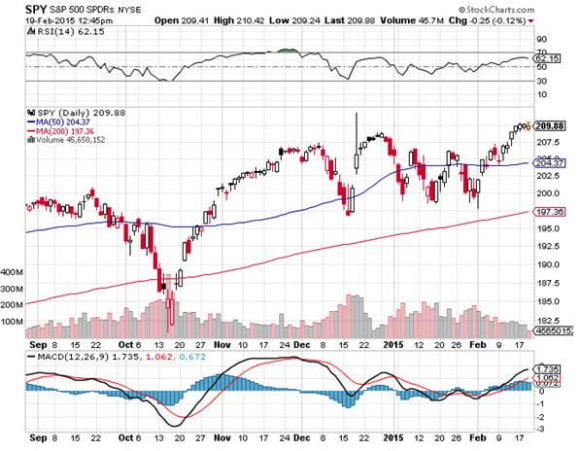
The S&P 500 (SPY) February $199-$202 vertical bull call spread
My bets that (GILD) and the (SPY) would rise, and that the (FXY) would fall during January and February proved dead on accurate. We got a further kicker with the two stock positions in that we captured a dramatic plunge in volatility (VIX).
Provided that some 9/11 type event doesn?t occur today, all three positions should expire at their maximum profit point. In that case, your profits on these positions will amount to 13% for the (FXY), 19% for (GILD) and 20% for the (SPY).
This will bring us a fabulous 5.58% profit so far for February, and a market beating 6.11% for year-to-date 2015.
Many of you have already emailed me asking what to do with these winning positions. The answer is very simple. You take your left hand, grab your right wrist, pull it behind your neck and pat yourself on the back for a job well done. You don?t have to do anything.
Your broker (are they still called that?) will automatically use your long put position to cover the short put position, cancelling out the total holding. Ditto for the call spreads. The profit will be credited to your account on Monday morning, and he margin freed up.
If you don?t see the cash show up in you account on Monday, get on the blower immediately. Although the expiration process is now supposed to be fully automated, occasionally mistakes do occur. Better to sort out any confusion before losses ensue.
I don?t usually run positions into expiration like this, preferring to take profits two weeks ahead of time, as the risk reward is no longer that favorable.
But we have a ton of cash right now, and I don?t see any other great entry points for the moment. Better to keep the cash working and duck the double commissions. This time being a pig paid off handsomely.
If you want to wimp out and close the position before the expiration, it may be expensive to do so. Keep in mind that the liquidity in the options market disappears, and the spreads substantially widen, when a security has only hours, or minutes until expiration. This is known in the trade as the ?expiration risk.?
One way or the other, I?m sure you?ll do OK, as long as I am looking over your shoulder, as I will be.
This expiration will leave me with a very rare 100% cash position. I am going to hang back and wait for good entry points before jumping back in. It?s all about getting that ?buy low, sell high? thing going again.
There are already interesting trades setting up in bonds (TLT), the (SPY), the Russell 2000 (IWM), NASDAQ (QQQ), solar stocks (SCTY), oil (USO), and gold (GLD).
The currencies seem to have gone dead for the time being, so I?ll stay away.
Well done, and on to the next trade.
Pat Yourself on the Back
https://www.madhedgefundtrader.com/wp-content/uploads/2015/02/Pat-on-the-back-e1424375419249.jpg259400Mad Hedge Fund Traderhttps://madhedgefundtrader.com/wp-content/uploads/2019/05/cropped-mad-hedge-logo-transparent-192x192_f9578834168ba24df3eb53916a12c882.pngMad Hedge Fund Trader2015-02-20 01:04:322015-02-20 01:04:32A Note on the Friday Options Expiration
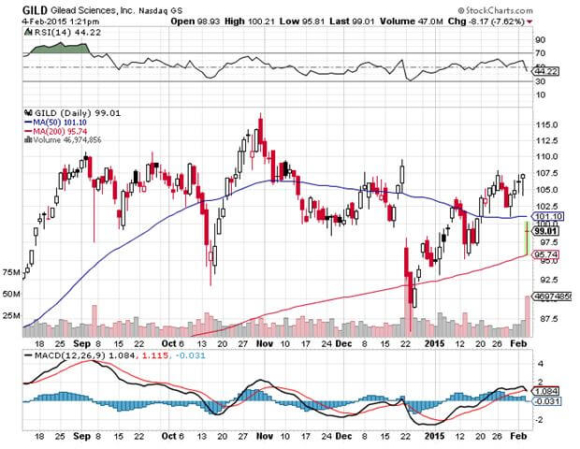
This is a stock that could double by the end of 2015. Buy a great performing stock in the top performing sector on a 10% dip.
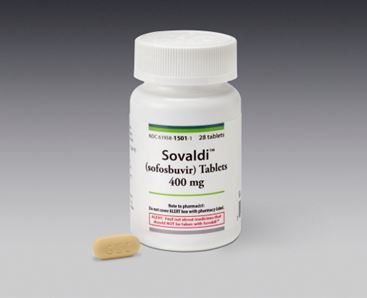
The stock has over reacted to an earnings report that was fantastic; but carried conservative forward guidance, based on expected future pricing pressure on its blockbuster Hepatitis C drugs, Sovaldi and Harvini.
I am giving a nod to the current high risk, high volatility environment and being very cautious here buy going with strike prices for the options that are well below the 200-day moving average. A very short, 11 trading day expiration gives us some extra protection.
This position should be able to weather some pretty fierce storms.
If you want to be more aggressive and take a longer view, buy the (GILD) April, 2015 $110 calls at $2.20 or better. If we break to a new all time high by the April 17 expiration, as I expect, you could score a 3-5 bagger for these options.
If you don?t do options, just buy the shares and sit on them for the rest of the year.
I spoke to a friend of mine who works for a health care venture capital firm, and I thought I?d pass through a few tidbits.
Gilead Sciences (GILD) is basking in the glow of the most profitable drug launch in history. Its treatment for hepatitis C, launched in 2013, inhibits the RNA polymerase that the hepatitis C virus (HCV) uses to replicate its RNA. It traders? parlance, it kills the bug.
(GILD) has taken in $5.7 billion in sales of this drug during the first half of 2014, and could sell as much as $10-$12 billion for the full year.
The drug is so revolutionary, that it on the scale of medical miracles of decades past, such as Salk vaccine immunizations for polio and penicillin treatments for bacterial infections. So far, Gilead has cured a breathtaking 90% of patients.
Now the company is using various drug combinations that produce even higher success rates with fewer side effects, and may be expended to treat other life threatening diseases. These could take Hepatitis C drug sales as high as $15-$18 billion in 2015.
A big controversy has been its immense cost, which works out to $84,000-$135,000 per patient. This has become a bigger issue with the advent of Obamacare, now that the government is picking up much of the tab.
But, that?s a bargain compared to full treatment of the disease, which can run as high as $350,000 per patient. That is, unless you don?t care if you die.
Partly in response to these complaints, the company is making the drug available at deep discounts in 91 emerging nations that account for 50% of all Hepatitis C cases globally. What it loses on margins there it will make back in volume.
With any luck, we may see hepatitis C wiped out in my lifetime, as I have already seen with smallpox (I saw some of the last few live cases in kids in Nepal in 1976).
All of this makes the stock appear a bargain at its current $99.01 price. At a multiple of a subterranean 11X earnings, the stock should hit $140 next year.
You all know that health care is one of my three core industries to bet on for the long term (there others are energy and technology).
The short-term driver of the share price for (GILD) is obviously whether the health care sector is in, or out of vogue. But for the long term Gilead looks like a good bet to me.
And I don?t even have hepatitis, or Ebola.
Time for Another Dose of Gilead Sciences
https://www.madhedgefundtrader.com/wp-content/uploads/2014/10/Sovaldi-Pills.jpg298367Mad Hedge Fund Traderhttps://madhedgefundtrader.com/wp-content/uploads/2019/05/cropped-mad-hedge-logo-transparent-192x192_f9578834168ba24df3eb53916a12c882.pngMad Hedge Fund Trader2015-02-05 09:31:422015-02-05 09:31:42Going Back Into Gilead Sciences
It seems that the harder I work, the luckier I get.
Last week I made a bet that companies with a high share of international business would be punished severely during earnings season.
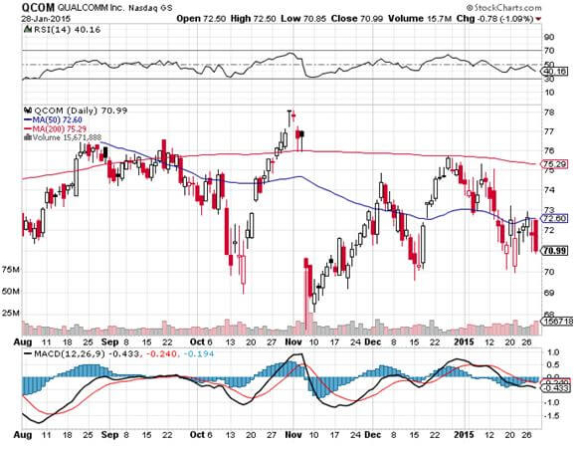
Specifically, I picked QUALCOMM (QCOM), the San Diego based maker of processors for cell phones, tablets, and laptops, because it had the highest percentage of foreign earnings among the S&P 500.
Three days later, after years of dawdling, the European Central Bank announced a particularly aggressive form of quantitative easing that sent the Euro crashing. You might as well have sent a torpedo directly into QUALCOMM?s bottom line.
The company?s Q4 earnings report, announced after the Tuesday close, confirmed my worst fears. While the earnings held up surprisingly well, the second half guidance was downright apocalyptic.
The stock immediately gapped down to $65 in the aftermarket, off some 8%, in a heartbeat.
Foreign earnings are a great place to hide when the greenback is soggy. It is a terrible place to be when the buck is moving from strength to strength, as it has for the past eight months.
It turns out that there is much more that is wrong under the hood at QUALCOMM than the recent collapse of the Euro and the Yen.
Much of the meteoric growth of Apple?s (AAPL) iPhone 6 sales in recent months has been at the expense of Samsung and other competitors. I hate to say ?I told you so? but I have been predicting this all along.
While QUALCOMM sells to both companies, particularly its Snapdragon 800 quadcore processor, it gets a lesser share of the profits on its sales to Apple. QUALCOMM is therefore, effectively, an indirect short position in Apple.
Oops!
I think you can take QUALCOMM?s woeful stock performance today as a warning that there is more suffering to come on the foreign earnings front by other companies yet to report.
For more depth on this, please read yesterday?s piece on ?The Unintended Consequences of the Euro Crash? by clicking here.
As for the happy holders of my recommended QUALCOMM (QCOM) February, 2015 $75-$80 in-the-money bear put spread, good for you! You have just made a nearly instant 2.25% profit on your total portfolio in a mere seven trading days. That works out to a gain of 22% on this single position.
There is no point in running this position the remaining three weeks into the February 20 expiration, as you have already reaped 95% of the potential profit. Better to free up the cash to roll into a new position, while simultaneously reducing your risk.
Or, you could simply take a long vacation from the miserable, unforgiving market.
There Goes QUALCOMM?s Earnings
https://www.madhedgefundtrader.com/wp-content/uploads/2015/01/Ship-e1422539739992.jpg262400Mad Hedge Fund Traderhttps://madhedgefundtrader.com/wp-content/uploads/2019/05/cropped-mad-hedge-logo-transparent-192x192_f9578834168ba24df3eb53916a12c882.pngMad Hedge Fund Trader2015-01-29 09:10:192015-01-29 09:10:19Qualcomm Guidance Crushes Stock
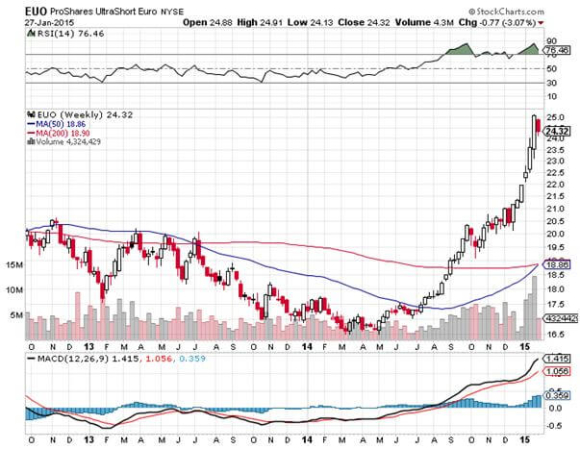
For those of you who heeded my expert advice to buy the ProShares Ultra Short Euro ETF (EUO) last July, well done!
You are up a massive 48%! This is on a move in the underlying European currency of only 18.5%.
My browsing of the Galleria in Milan, the strolls through Spanish shopping malls, and my dickering with an assortment of dubious Greek merchants, all paid off big time. It turns out that everything I predicted for this beleaguered currency came true.
The European economy did collapse. Cantankerous governments made the problem worse by squabbling, delaying and obfuscating, as usual.
The European Central Bank finally threw in the towel and did everything they could to collapse the value of the Euro and reinvigorate their comatose economies. This they did by imitating America?s wildly successful quantitative easing, which they announced with local variations last Thursday.
And now for the good news: The best is yet to come!
Europe is now six days into a strategy of aggressive monetary easing which may take as long as five years until it delivers tangible, sustainable results. That?s how long it took for the Federal Reserve?s QE to restore satisfactory levels of confidence in the US economy.
The net net is that we have almost certainly only seen the first act of a weakening of the Euro which may last for years. A short Euro could be the trade that keeps on giving.
The ECB?s own target now is obviously parity against the greenback, which you will find predicted in my own 2015 Annual Asset Class Review released at the beginning of January (click here).
Once they hit that target, 87 cents to the Euro will become the new goal, and that could be achieved sooner than later.
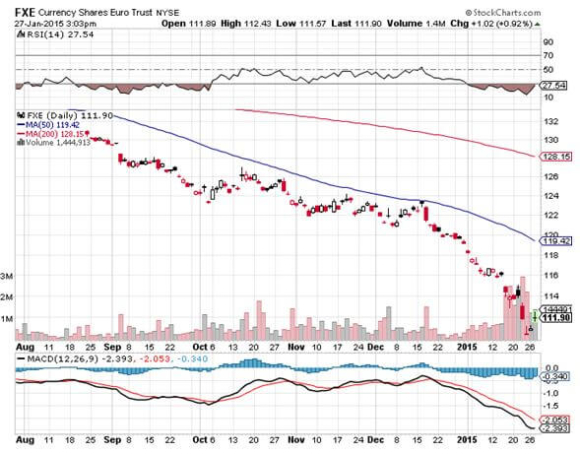
However, you will not find me short the Euro up the wazoo this minute. I think we have just stumbled into a classic ?Buy the Rumor, Sell the News? situation with the Euro.
The next act will involve the ECB sitting on its hands for a year, realizing that their first pass at QE was inadequate, superficial, and flaccid, and that it is time to pull the bazooka out of their pockets once again.
This is a problem when the entire investment world is short the Euro. That paves the way for countless, rip your face off short covering rallies in the months ahead. Any smidgeon or blip of positive European economic data could spark one of these.
Trading the Euro for the past eight months has been like falling off a log. It is about to get dull, mean and brutish. So for the moment, my currency play has morphed into selling short the Japanese yen, which has its own unique set of problems.
As for the unintended consequences of the Euro crash, the Q4 earnings reports announced so far by corporate America tells the whole story.
Companies with a heavy dependence on foreign (read Euro and yen) denominated earnings are almost universally coming up short. On this list you can include Caterpillar (CAT), Procter and Gamble (PG), and Microsoft (MSFT).
Who are the winners in the strong dollar, weak Euro contest? US companies that see a high proportion of their costs denominated in flagging foreign currencies, but see their incomes arrive totally in the form of robust, virile dollars.
You may not realize it, but you are playing the global currency arbitrage game every time you go shopping. The standout names here are US retailers, which manufacture abroad virtually all of the junk they sell you here, especially in low waged China.
The stars here are Macy?s (M), Family Dollar Stores (FDO), Costco (COST), Target (TGT), and Wal-Mart (WMT).
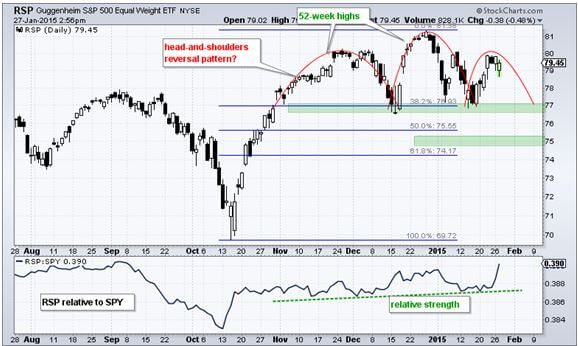
You can see this divergence crystal clear in examining the behavior of the major stock indexes. The chart for the Guggenheim S&P 500 Equal Weight ETF (RSP), which has the greatest share of currency sensitive multinationals, looks positively dire, and may be about to put in a fatal ?Head and Shoulders? top (see the following story).
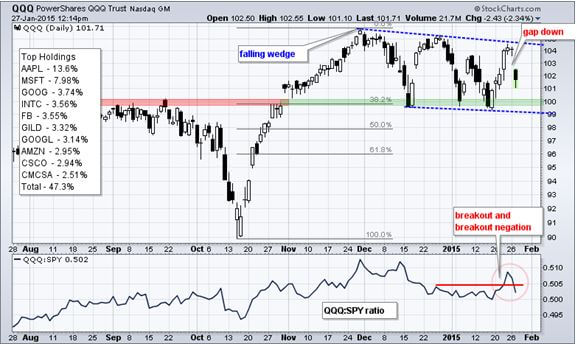
The chart for the NASDAQ (QQQ), where constituent companies have less, but still a substantial foreign currency exposure, appears to be putting in a sideways pennant formation before eventually breaking out to new highs once again.
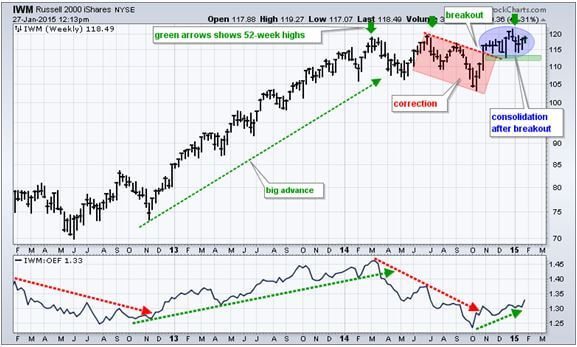
The small cap Russell 2000, which is composed of almost entirely domestic, dollar based, ?Made in America? type companies, is by far the strongest index of the trio, and looks like it is just biding time before it blasts through to new highs.
If you are a follower of my Trade Alert Service, then you already know that I have a long position in the (IWM), which has already chipped in 2.12% to my 2015 performance.
You see, there is a method to my Madness.
Never Underestimate the Value of Research
https://www.madhedgefundtrader.com/wp-content/uploads/2015/01/John-Thomas1-e1422462857973.jpg302400Mad Hedge Fund Traderhttps://madhedgefundtrader.com/wp-content/uploads/2019/05/cropped-mad-hedge-logo-transparent-192x192_f9578834168ba24df3eb53916a12c882.pngMad Hedge Fund Trader2015-01-28 11:35:022015-01-28 11:35:02The Unintended Consequences of the Euro Crash
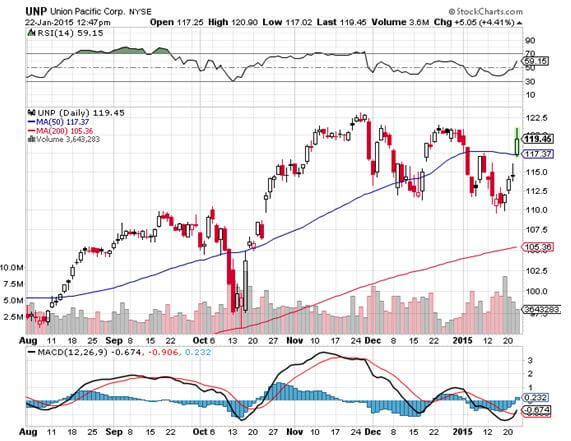
I was fascinated by the recent comments made by Union Pacific (UNP) CEO, Jack Koraleski, about the current robust health of his company.
Fourth quarter profits rocketed by an amazing 22% and those stellar numbers look set to continue.
I love railroads, not because they used to belch smoke and steam and have these incredibly loud, romantic, wailing whistles. In fact, my first career goal in life (when I was 5) was to become a train engineer.
It turns out that the railroads are also a great proxy for the health of the entire US economy. They are, in effect, our canary in the coalmine.
Jack sees moderate economic growth in the US continuing. Demand for the heavy products the company shifts is booming. Construction products like stone, gravel, cement and lumber, are up 10%.
The dramatic plunge in oil prices brings positives and negatives. The boom in oil shipments from North Dakota has been a windfall for the railroads that may now ebb.
But if prices stay low enough for long enough, it will boost demand for everything else that the Union Pacific ships, including houses, furniture, cars and every other sweet spot for their franchise. (UNP), in effect, has a great internal hedge for its many businesses. When one product line weakens, another strengthens. This has been going on forever.
The company is watching carefully the construction of a second Panama Canal across Nicaragua (the subject of a future article, when I get some time).
If completed by its Chinese promoters within the next decade, it could bring a tiny incremental shift of traffic from the US west coast to the Gulf ports. Even this is a mixed bag, as this will move some business away from strike plagued ports that are currently causing so much trouble.
When I rode Amtrak?s California Zephyr service from Chicago to San Francisco last year, I passed countless trains heading west, hauling hoppers full of coal for shipment to China.
This year I took the same trip. The coal trains were gone. Instead I saw 100 car long tanker trains transporting crude oil from North Dakota south to the Gulf Coast. I thought, ?There?s got to be a trade here?. It turns out I was right.
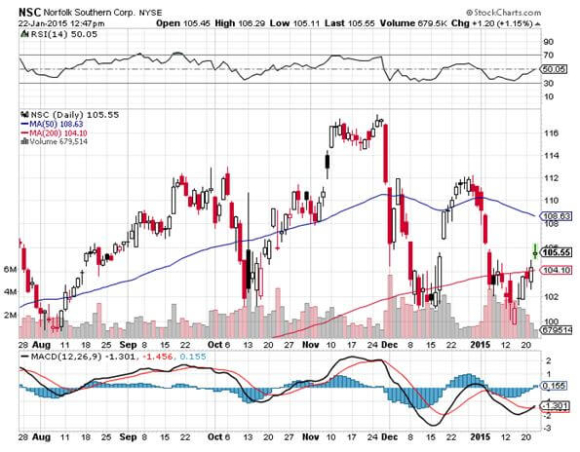
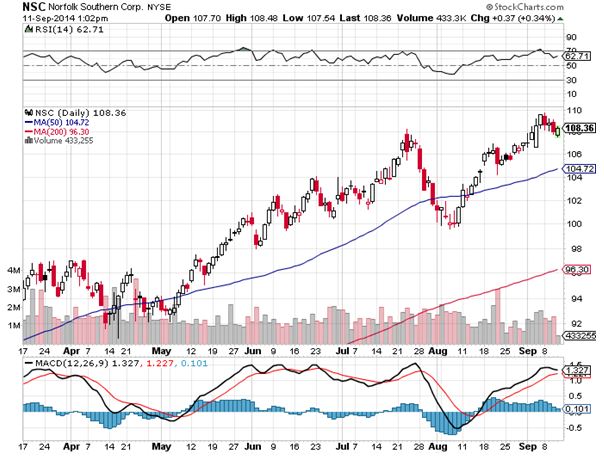
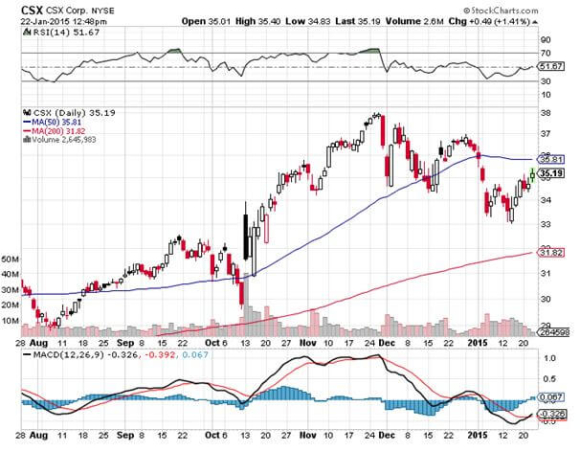
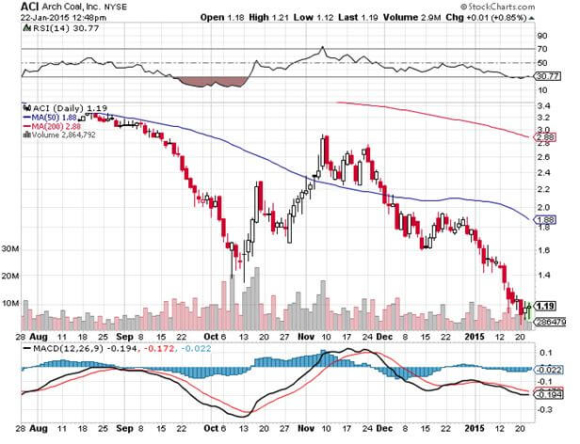
Take a look at the charts below, and you will see that the shares of virtually the entire railroad industry are breaking out to the upside.
In two short years, the big railroads have completely changed their spots, magically morphing from coal plays to natural gas ones. You?ve heard of ?fast fashion?? This is ?fast railroading?.
Today the big business is coming from the fracking boom, shipping oil from North Dakota?s Bakken field to destinations south. In fact, the first trainload of Texas tea arrived here in the San Francisco Bay area only a year ago, displacing crude that formerly came from Alaska.
Look at the share prices of the major listed railroads, and it is clear they have been chugging right along to produce one of the best performances of 2013. These include Union Pacific (UNP), CSX Corp (CSX), Norfolk Southern (NSC), and Canadian Pacific (CP). In the meantime, competing coal shares, like Arch Coal (ACI) have been one of the worst performing this year.
Those of a certain age, such as myself, remember railroads as one of the great black holes of American industry. During the sixties, they were constantly on strike, always late, and delivered terrible service.
A friend of mine taking a passenger train from New Mexico to Los Angeles found his car abandoned on a siding for 24 hours, where he froze and starved until discovered.
New airlines and the trucking industry were eating their lunch. They also hemorrhaged money like crazy. The industry finally hit bottom in 1970, when the then dominant Penn Central Railroad went bankrupt, freight was spun off, and the government owned Amtrak passenger service was created out of the ashes. I know all of this because my late uncle was the treasurer of Penn Central.
Fast forward nearly half a century and what you find is not your father?s railroad. While no one was looking, they quietly became one of the best run and most efficient industries in America. Unions were tamed, costs slashed, and roads were reorganized and consolidated.
The government provided a major assist with a sweeping deregulation. It became tremendously concentrated, with just four roads dominating the country, down from hundreds a century ago, giving you a great oligopoly play. The quality of management improved dramatically.
Then the business started to catch a few lucky breaks from globalization. The China boom that started in the nineties created enormous demand for shipment inland of manufactured goods from west coast ports.
A huge trade also developed moving western coal out to the Middle Kingdom, which now accounts for 70% of all traffic. The ?fracking? boom is having the same impact on the North/South oil by rail business.
All of this has ushered in a second ?golden age? for the railroad industry. This year, the industry is expected to pour $14 billion into new capital investment. The US Department of Transportation expects gross revenues to rise by 50% to $27.5 billion by 2040. The net net of all of this is that freight rates are rising right when costs are falling, sending railroad profitability through the roof.
Union Pacific is investing a breathtaking $3.6 billion to build a gigantic transnational freight terminal in Santa Teresa, NM. It is also spending $500 million building a new bridge across the Mississippi River at Canton, Iowa. Lines everywhere are getting double tracked or upgraded. Mountain tunnels are getting rebored to accommodate double-stacked sea containers.
Indeed, the lines have become so efficient, that overnight couriers, like FedEx (FDX) and UPS (UPS), are diverting a growing share of their own traffic. Their on time record is better than that of competing truckers, who face delays from traffic jams and crumbling roads, and are still hobbled by antiquated regulation.
I have some firsthand knowledge of this expansion. Every October 1, I volunteer as a docent at the Truckee, California Historical Society on the anniversary of the fateful day in 1846 when the ill-fated Donner Party was snowed in.
There, I guide groups of tourists over the same pass my ancestors crossed during the 1849 gold rush. The scars on enormous ancient pines made by passing wagon wheels are still visible.
During 1866-1869, thousands of Chinese laborers blasted a tunnel through a mile of solid granite to complete the Transcontinental Railroad. I can guide my guests through that tunnel today with flashlights because (UNP) moved the line to a new tunnel a mile south to improve the grade. The ceiling is still covered with soot from the old wood and coal-fired engines.
While the rebirth of this industry has been impressive, conditions look like they will get better still. Massive international investment in Mexico (low end manufacturing and another energy renaissance) and Canada (natural resources) promise to boost rail traffic with the US.
The rapidly accelerating ?onshoring? trend, whereby American companies relocate manufacturing facilities from overseas back home, creates new rail traffic as well. It turns out that factories that produce the biggest and heaviest products are coming home first, all great cargo for railroads.
And who knew? Railroads are also a ?green? play. As Burlington Northern Railroad owner, Warren Buffett never tires of pointing out, it requires only one gallon of diesel fuel to move a ton of freight 500 miles. That makes it four times more energy efficient than competing trucks.
In fact, many companies are now looking to railroads to reduce their overall carbon footprints. Warren doesn?t need any convincing himself. The $34 billion he invested in the Burlington Northern Railroad two years ago has probably
doubled in value since then.
You have probably all figured out by now that I am a serious train nut, beyond the industry?s investment possibilities. My past letters have chronicled adventures riding the Orient Express from London to Venice, and Amtrak from New York to San Francisco.
I even once considered buying my own steam railroad; the fabled ?Skunk? train in Mendocino, California, until I figured out that it was a bottomless money pit. Some 50 years of deferred maintenance is not a pretty sight.
It gets worse. Union Pacific still maintains in running condition some of the largest steam engines every built, for historical and public relations purposes. One, the ?Old 844? once steamed its way over the High Sierras to San Francisco on a nostalgia tour.
The 120-ton behemoth was built during WWII to haul heavy loads of steel, ammunition and armaments to California ports to fight the war against Japan. The 4-8-4-class engine could pull 26 passenger cars at 100 mph.
When the engine passed, I felt the blast of heat of the boiler singe my face. No wonder people love these things! To watch the video, please click here and hit the ?PLAY? arrow in the lower left hand corner. Please excuse the shaky picture.
I shot this with one hand, while using my other hand to restrain my over excited kids from running on to the tracks to touch the laboring beast.
00Mad Hedge Fund Traderhttps://madhedgefundtrader.com/wp-content/uploads/2019/05/cropped-mad-hedge-logo-transparent-192x192_f9578834168ba24df3eb53916a12c882.pngMad Hedge Fund Trader2015-01-26 01:04:452015-01-26 01:04:45Will the Oil Bust Kill the Railroads?
When is the Mad Hedge Fund Trader a genius, and when is he a complete moron?
That is the question readers have to ask themselves whenever their smart phones ping, and a new Trade Alert appears on their screens.
I have to confess that I wonder myself sometimes.
So I thought I would run my 2014 numbers to find out when I was a hero, and when I was a goat.
The good news is that I was a hero most of the time, and a goat only occasionally. Here is the cumulative profit and loss for the 75 Trade Alerts that I closed during calendar 2014, listed by asset class.
Profit by Asset Class
Foreign Exchange 15.12% Equities 12.52% Fixed Income 7.28% Energy 1.4% Volatility -1.68%
Total 37.64%
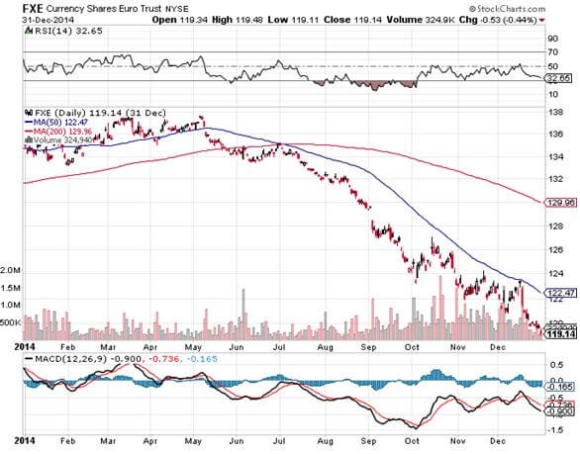
Foreign exchange trading was my big winner for 2014, accounting for nearly half of my profits. My most successful trade of the year was in my short position in the Euro (FXE), (EUO).
I piled on a double position at the end of July, just as it became apparent that the beleaguered European currency was about to break out of a multi month sideway move into a pronounced new downtrend.
I then kept rolling the strikes down every month. Those who bought the short Euro 2X ETF (EUO) made even more.
The fundamentals for the Euro were bad and steadily worsening. It helped that I was there for two months during the summer and could clearly see how grotesquely overvalued the currency was. $20 for a cappuccino? Mama mia!
Nothing beats on the ground, first hand research.
Stocks generated another third of my profits last year and also accounted for my largest number of Trade Alerts.
I correctly identified technology and biotech as the lead sectors for the year, weaving in and out of Apple (AAPL) and Gilead Sciences (GILD) on many occasions. I also nailed the recovery of the US auto industry (GM), (F).
I safely stayed away from the energy sector until the very end of the year, when oil hit the $50 handle. I also prudently avoided commodities like the plague.
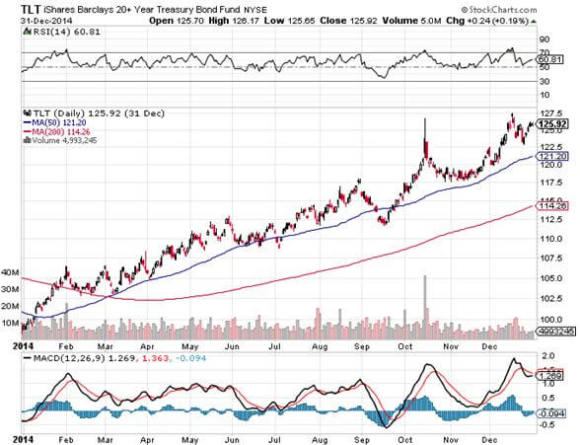
Unfortunately, I was wrong on the bond market for the entire year. That didn?t stop me from making money on the short side on price spikes, with fixed income chipping a healthy 7.28% into the kitty.
It was only at the end of the year, when the prices accelerated their northward trend that they started to cost me money. My saving grace was that I kept positions small throughout, doubling up on a single occasion and then coming right back out.
My one trade in the energy sector for the year was on the short side, in natural gas (UNG), selling the simple molecule at the $5.50 level. With gas now plumbing the depths at $2.90, I should have followed up with more Trade Alerts. But hey, a 1.4% gain is better than a poke in the eye with a sharp stick.
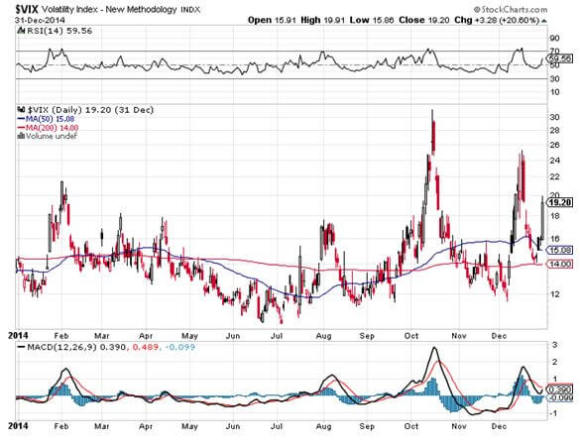
In which asset class was I wrong every single time? Both of the volatility (VIX) trades I did in 2014 lost money, for a total of -1.68%. I got caught in one of many downdrafts that saw volatility hugging the floor for most of the year, giving it to me in the shorts with the (VXX).
All in all, it was a pretty good year.
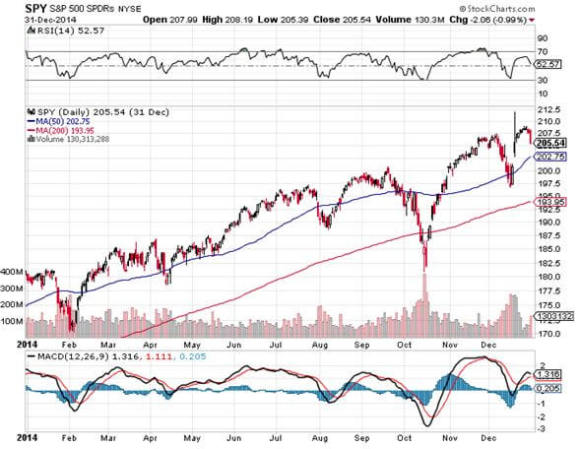
What was my best trade of 2014? I made 2.75% with a short position in the S&P 500 in July, during one of the market?s periodic 5% corrections.
And my worst trade of 2014? I got hit with a 6.63% speeding ticket with a long position in the same index. But I lived to fight another day.
After a rocky start, 2015 promises to be another great year. That is, provided you ignore my advice on volatility.
Here is a complete list of every trade I closed last year, sorted by asset class, from best to worse.
Date
Position
Asset Class
Long/short
?
?
?
?
?
?
7/25/14
(SPY) 8/$202.50 - $202.50 put spread
equities
long
?
?
?
?
?
2.75%
10/16/14
(GILD) 11/$80-$85 call spread
equities
long
?
?
?
?
?
2.57%
5/19/14
(TLT) 7/$116-$119 put spread
fixed income
long
?
?
?
?
?
2.48%
4/4/14
(IWM) 8/$113 puts
equities
long
?
?
?
?
?
2.38%
7/10/14
(AAPL) 8/$85-$90 call spread
equities
long
?
?
?
?
?
2.30%
2/3/14
(TLT) 6/$106 puts
equities
long
?
?
?
?
?
2.27%
9/19/14
(IWM) 11/$117-$120 put spread
equities
long
?
?
?
?
?
2.26%
10/7/14
(FXE) 11/$127-$129 put spread
foreign exchange
long
?
?
?
?
?
2.22%
9/26/14
(IWM) 11/$116-$119 put spread
equities
long
?
?
?
?
?
2.21%
4/17/14
(TLT) 5/$114-$117 put spread
fixed income
long
?
?
?
?
?
2.10%
8/7/14
(FXE) 9/$133-$135 put spread
foreign exchange
long
?
?
?
?
?
2.07%
10/2/14
(BAC) 11/$15-$16 call spread
equities
long
?
?
?
?
?
2.04%
4/9/14
(SPY) 5/$191-$194 put spread
equities
long
?
?
?
?
?
2.02%
10/15/14
(DAL) 11/$25-$27 call spread
equities
long
?
?
?
?
?
1.89%
9/25/14
(FXE) 11/$128-$130 put spread
foreign exchange
long
?
?
?
?
?
1.86%
6/6/14
(JPM) 7/$52.50-$55.00 call spread
equities
long
?
?
?
?
?
1.81%
4/4/14
(SPY) 5/$193-$196 put spread
equities
long
?
?
?
?
?
1.81%
3/14/14
(TLT) 4/$111-$114 put spread
fixed income
long
?
?
?
?
?
1.68%
10/17/14
(AAPL) 11/$87.50-$92.50 call spread
equities
long
?
?
?
?
?
1.56%
10/15/14
(SPY) 11/$168-$173 call spread
equities
long
?
?
?
?
?
1.51%
7/3/14
(FXE) 8/$138 put spread
foreign exchange
long
?
?
?
?
?
1.51%
10/9/14
(FXE) 11/$128-$130 put spread
foreign exchange
long
?
?
?
?
?
1.48%
9/19/14
(FXE) 10/$128-$130 put spread
foreign exchange
long
?
?
?
?
?
1.45%
10/22/14
(SPY) 11/$179-$183 call spread
equities
long
?
?
?
?
?
1.44%
5/29/14
(TLT) 7/$118-$121 put spread
fixed income
long
?
?
?
?
?
1.44%
2/24/14
(UNG) 7/$26 puts
energy
long
?
?
?
?
?
1.40%
2/24/14
(BAC) 3/$15-$16 call spread
equities
long
?
?
?
?
?
1.39%
6/23/14
(SPY) 7/$202 put spread
equities
long
?
?
?
?
?
1.37%
9/29/14
(SPY) 10/$202-$205 Put spread
equities
long
?
?
?
?
?
1.29%
5/20/14
(AAPL) 7/$540 $570 call spread
equities
long
?
?
?
?
?
1.22%
9/26/14
(SPY) 10/$202-$205 Put spread
equities
long
?
?
?
?
?
1.22%
5/22/14
(GOOGL) 7/$480-$520 call spread
equities
long
?
?
?
?
?
1.16%
5/19/14
(FXY) 7/$98-$101 put spread
foreign exchange
long
?
?
?
?
?
1.14%
1/15/14
(T) 2/$35-$37 put spread
equities
long
?
?
?
?
?
1.08%
3/3/14
(TLT) 3/$111-$114 put spread
fixed income
long
?
?
?
?
?
1.07%
1/28/14
(AAPL) 2/$460-$490 call spread
equities
long
?
?
?
?
?
1.06%
4/24/14
(SPY) 5/$192-$195 put spread
equities
long
?
?
?
?
?
1.05%
6/6/14
(CAT) 7/$97.50-$100 call spread
equities
long
?
?
?
?
?
1.04%
7/23/14
(FXE) 8/$134-$136 put spread
foreign exchange
long
?
?
?
?
?
0.99%
8/18/14
(FXE) 9/$133-$135 put spread
foreign exchange
long
?
?
?
?
?
0.94%
11/4/14
(BAC) 12/$15-$16 call spread
equities
long
?
?
?
?
?
0.88%
4/9/14
(SPY) 6/$193-$196 put spread
equities
long
?
?
?
?
?
0.88%
7/25/14
(SPY) 8/$202.50 -205 put spread
equities
long
?
?
?
?
?
0.88%
6/6/14
(MSFT) 7/$38-$40 call spread
equities
long
?
?
?
?
?
0.87%
10/23/14
(FXY) 11/$92-$95 puts spread
foreign exchange
long
?
?
?
?
?
0.86%
7/23/14
(TLT) 8/$117-$120 put spread
fixed income
long
?
?
?
?
?
0.81%
3/5/14
(DAL) 4/$30-$32 Call spread
equities
long
?
?
?
?
?
0.76%
4/10/14
(VXX) long volatility ETN
equities
long
?
?
?
?
?
0.76%
1/30/14
(UNG) 7/$23 puts
equities
long
?
?
?
?
?
0.66%
4/1/14
(FXY) 5/$96-$99 put spread
foreign currency
long
?
?
?
?
?
0.60%
1/15/14
(TLT) 2/$108-$111 put spread
equities
long
?
?
?
?
?
0.47%
3/6/14
(EBAY) 4/$52.50- $55 call spread
equities
long
?
?
?
?
?
0.24%
10/14/14
(TBT) short Treasury Bond ETF
fixed income
long
?
?
?
?
?
0.22%
3/28/14
(VXX) long volatility ETN
equities
long
?
?
?
?
?
0.20%
7/17/14
(TBT) short Treasury Bond ETF
fixed income
long
?
?
?
?
?
0.08%
3/26/14
(VXX) long volatility ETN
equities
long
?
?
?
?
?
0.06%
7/8/14
(TLT) 8/$115-$118 put spread
fixed income
long
?
?
?
?
?
-0.18%
4/28/14
(SPY) 5/$189-$192 put spread
equities
long
?
?
?
?
?
-0.45%
3/5/14
(GE) 4/$24-$25 call spread
equities
long
?
?
?
?
?
-0.73%
4/28/14
(VXX) long volatility ETN
volatility
long
?
?
?
?
?
-0.81%
4/24/14
(TLT) 5/$113-$116 put spread
fixed income
long
?
?
?
?
?
-0.87%
4/28/14
(VXX) long volatility ETN
volatility
long
?
?
?
?
?
-0.87%
6/6/14
(IBM) 7/$180-$185 call spread
equities
long
?
?
?
?
?
-1.27%
9/30/14
(SPY) 11/$185-$190 call spread
equities
long
?
?
?
?
?
-1.51%
10/9/14
(TLT) 11/$122-$125 put spread
fixed income
long
?
?
?
?
?
-1.55%
9/24/14
(TSLA) 11/$200 call spread
equities
long
?
?
?
?
?
-1.62%
2/27/14
(SPY) 3/$189-$192 put spread
equities
long
?
?
?
?
?
-1.67%
3/6/14
(BAC) 4/$16 calls
equities
long
?
?
?
?
?
-2.01%
10/14/14
(SPY) 10/$180-$184 call spread
equities
short
?
?
?
?
?
-2.13%
11/14/14
(BABA) 12/$100-$105 call spread
equities
short
?
?
?
?
?
-2.38%
10/20/14
(SPY) 11/$197-$202 call spread
equities
short
?
?
?
?
?
-2.72%
7/3/14
(GM) 8/$33-$35 call spread
equities
long
?
?
?
?
?
-2.91%
3/7/14
(GM) 4/$34-$36 call spread
equities
long
?
?
?
?
?
-2.96%
11/25/14
(SCTY) 12/47.50-$52.50 call spread
equities
long
?
?
?
?
?
-3.63%
10/20/14
(SPY) 11/$197-$202 call spread
equities
short
?
?
?
?
?
-4.22%
4/14/14
(SPY) 5/$188-$191 put spread
equities
long
?
?
?
?
?
-6.63%
What a Year!
https://www.madhedgefundtrader.com/wp-content/uploads/2014/08/John-Thomas-Beach-e1416856744606.png400276Mad Hedge Fund Traderhttps://madhedgefundtrader.com/wp-content/uploads/2019/05/cropped-mad-hedge-logo-transparent-192x192_f9578834168ba24df3eb53916a12c882.pngMad Hedge Fund Trader2015-01-15 09:01:572015-01-15 09:01:572014 Trade Alert Review
Here are the long-winded, feeble bunch of excuses I promised you.
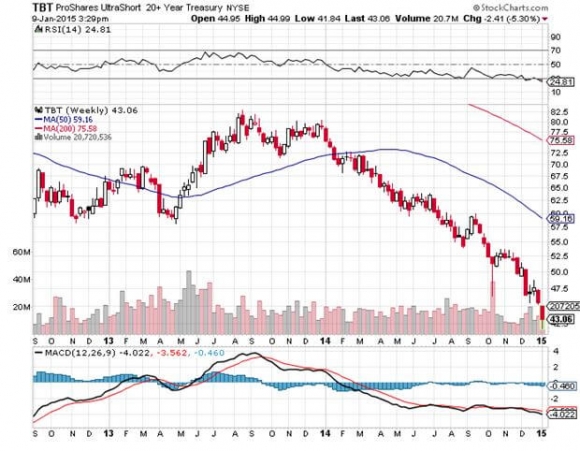
I have broken every rule in my trading book hanging on to my position in the (TBT) for the past four months. I ignored my own stop losses. I listened to the morons on TV saying interest rates were about to spike up. I took the pile of charts that were telling me there was no bottom in sight, and deliberately lost them behind the radiator.
I even listened to the Fed signaling me with an emergency flare gun that they would raise rates in June.
As a result, I have been punished. Not too severely though, for I did follow one cardinal rule: I kept the position small. I did not double, triple and quadruple up, as many in the hedge fund industry have done.
As a result, I am merely suffering a thrashing in the woodshed, the kind my grandfather used to give me when he caught me shooting out the lights with my .22 rifle on our ranch in Indio, California. This is not a beheading, nor even a water boarding, and not a scintilla of an existential threat.
Still, a $14, 25% loss on a single position is no laughing matter. It?s about as welcome as a slap in the face with a wet mackerel. This is all proof that after 45 years in this business, I can still make the mistakes of a first year intern that was only hired for her good looks, shapely figure and loose morals.
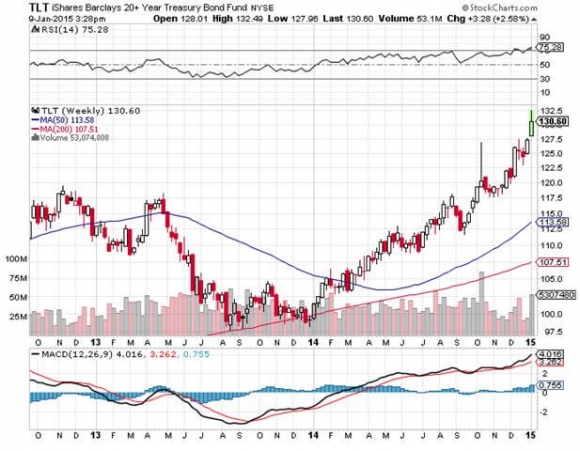
If you told me that US GDP growth was 5%, unemployment was at a ten year low at 5.6%, and energy prices had just halved, I would have pegged the ten-year Treasury bond yield at 6.0%. The US economy created 2.9 million jobs in 2014, the most since 1999. Full employment is now almost a gimme.
Yet here we are at 2.00%.
You might as well take your traditional economic books and throw them in the trash. Apologies to John Maynard Keynes, John Kenneth Galbraith, and Paul Samuelson. It is yet another indication that this market has an insatiable need to teach an old dog new tricks.
After turning a blind eye to the writing on the wall, it?s time for me to read it out to you loud and clear.
The collapse of the German bond market is the big deal here. With the European economy in free fall, and doubts remaining about the ability of quantitative easing to work there under any circumstances, investors are assuming the future demand for money on the beleaguered continent will be zero.
German 10 year bond yields at 0.45% and still falling make 10 year US Treasuries at 2.00% appear the bargain of the century. Governments and hedge funds alike can buy US paper, sell short European paper against it, hedge out the currency risk, and lock in a risk free 1.55% a year for ten years. Sounds like a deal to me.
Multiply this by trillions of dollars and you can see what the problem is.
The other big deal here is the price of oil. I will reiterate my belief that if Texas tea stays down at the $40 handle, it is worth not just a 10% gain in stocks, but a double. The flipside is that interest rates stay far lower for longer than anyone expects, even including the Fed.
People just don?t understand how far reaching the impact of oil prices is. This heralds an entire new leg in the deflation story, one that could continue for years. It completely rules out any chance of a hike in interest rates this year. It is also fantastic news for the US bond market, and terrible for the (TBT).
If you want to add a third strike against continuing with a short bond position, look no further than the string US dollar. Investors around the world are pouring money into the greenback for a host of reasons. What do they do with the dollars when they get here? Buy bonds.
For more depth on why I totally missed the boat on bonds, please click here for ?10 Reasons Why I Am Wrong on Bonds?.
There are also opportunistic issues to consider here.
With implied volatilities on options sky high here, I can slap on almost any other options position and make back my 2.5% loss on the (TBT) in a couple of weeks. So there is no point in tying up 10% of my portfolio in a position that is dying a death of a thousand cuts.
Also, If you have been short the Euro (FXE), (EUO) and the Japanese yen (FXY), (YCS) after the past seven months, as I begged you to do, you have already more than made back the money.
https://www.madhedgefundtrader.com/wp-content/uploads/2014/09/John-Thomas5-e1410989501597.jpg400266Mad Hedge Fund Traderhttps://madhedgefundtrader.com/wp-content/uploads/2019/05/cropped-mad-hedge-logo-transparent-192x192_f9578834168ba24df3eb53916a12c882.pngMad Hedge Fund Trader2015-01-12 01:04:492015-01-12 01:04:49Throwing in the Towel on the Bond Market
Pack your portfolios with agricultural plays like Potash (POT), Mosaic (MOS), and Agrium (AGU) if Dr. Paul Ehrlich is just partially right about the impending collapse in the world's food supply. You might even throw in long positions in wheat (WEAT), corn (CORN), soybeans (SOYB), and rice.
The never dull and often controversial Stanford biology professor told me he expects that global warming is leading to significant changes in world weather patterns that will cause droughts in some of the largest food producing areas, causing massive famines. Food prices will skyrocket, and billions could die.
At greatest risk are the big rice producing areas in South Asia, which depend on glacial run off from the Himalayas. If the glaciers melt, this crucial supply of fresh water will disappear. California faces a similar problem if the Sierra snowpack fails to show up in sufficient quantities, as it has for the past two years.
Rising sea levels displacing 500 million people in low-lying coastal areas is another big problem. One of the 80-year-old professor's early books The Population Bomb was required reading for me in college in 1970, and I used to drive up from Los Angeles to the San Francisco Bay area just to hear his lectures (followed by the obligatory side trip to the Haight-Ashbury).
Other big risks to the economy are the threat of a third world nuclear war caused by population pressures, and global plagues facilitated by a widespread growth of intercontinental transportation and globalization. And I won't get into the threat of a giant solar flare frying our electrical grid.
?Super consumption? in the US needs to be reined in where the population is growing the fastest. If the world adopts an American standard of living, we need four more Earths to supply the needed natural resources. We must to raise the price of all forms of carbon, preferably through taxes, but cap and trade will work too. Population control is the answer to all of these problems, which is best achieved by giving women an education, jobs, and rights, and has already worked well in Europe and Japan.
All sobering food for thought.
Buy Now While Supplies Last!
https://www.madhedgefundtrader.com/wp-content/uploads/2013/12/Fruit-Market.jpg311370Mad Hedge Fund Traderhttps://madhedgefundtrader.com/wp-content/uploads/2019/05/cropped-mad-hedge-logo-transparent-192x192_f9578834168ba24df3eb53916a12c882.pngMad Hedge Fund Trader2014-12-22 01:04:312014-12-22 01:04:31The 'Population Bomb' Echoes
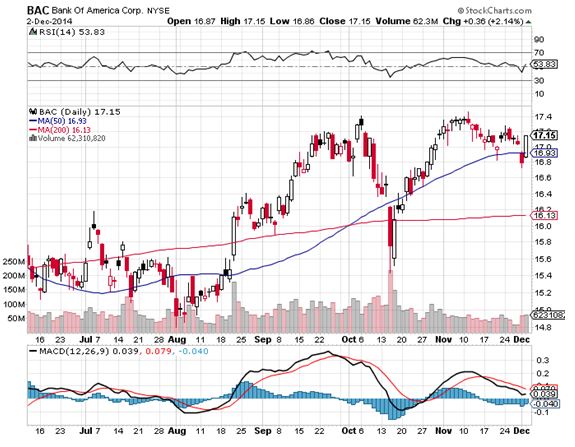
This morning, Bank of America paid out a five cent quarterly dividend, which works out to an annualized yield of 1.18% and the shares will open this morning trading ex.
For those of you who have wisely followed my Trade Alert to buy the Bank of America (BAC) December, 2014 $15-$16 vertical bull call spread, good for you. As of last night, you were showing a profit of 0.88% on the position.
However, there is a chance that the short side of the trade, the December, 2014 $16 calls were exercised against you before the opening this morning. If that is the case, you would have been informed by your broker by email and immediate action is required on your part to avoid unnecessary risk.
The options traded on US exchanges and referred to in my Trade Alerts are American style, meaning that they can be exercised at any time by the owner. This is in contrast to European style options, which can only be exercised on the expiration day. The vertical option spreads that I have been recommending for the past year are composed of a deep in-the-money long strike price plus a short portion at a nearer money strike price.
When stocks have high dividends, there is a chance that the near money option you are short, the December, 2014 $16 calls, gets exercised against you by the owner.
This requires you to deliver the stock equivalent of the option you are short, plus any quarterly dividends that are due. Don?t worry, because your long position perfectly hedges you against any principal risk in this situation.
However, you will be liable for the five-cent dividend, which works out to $5 for every call option you are short. If you executed the full 110 contracts recommended in my Trade Alert that works out to $550 (100 shares per option X $.05 dividend X 110 contracts). You then need to email or call your broker back immediately informing him that you want to exercise your remaining long option position to meet your assigned short position.
This should completely close out your position and leave you with about half your remaining profit. This is not an automatic process and requires action on your part!
It also means that you get your margin back, plus your profit, the next day, and don?t have to run the position another two weeks into expiration. That means you are free to use the money to put on new trades. Assignments are made on a random basis by an exchange computer, and can happen any day. You may get exercised, or you may not. Exercise means the owner of the option that you are short completely loses the entire premium on his call.
Dividends have to be pretty high to make such a move economic, usually at least over 3% on an annual rate. But these days, markets are so efficient that traders, or their machines, will exercise options for a single penny profit.
In fact, there are now some dedicated hedge funds and independent individual options traders that specialize in buying up calls the day before and ex dividend day to capture a tiny 29 basis point gross overnight profit. That is before execution expenses.
It hardly seems worth it to me, but I guess what they lack in size, they make up in volume. Hey, you do what you can do to earn a living. Surprise assignments create a risk for option spread owners in a couple of ways. If you don?t check your email every day, you might not be aware that you have been assigned.
Alternatively, such emails sometimes get lost, or hung up in local servers or spam filters, which occasionally happens to readers of my own letter.
Then, you are left with the long side deep out-of-the-money call without on offsetting short position. You are now unhedged. This means you will have a substantially higher margin requirement, and is the equivalent of going outright long the stock in large size.
Suddenly, you are playing a totally different game, and not one I recommended. If the stock rises, then you could be in for a windfall profit. But if it falls, you could take a big hit. Guess which way the stock usually goes.
Better to completely avoid this situation at all cost and not take the chance. You are probably not set up to do this type of trading. If you don?t have the cash in your account to cover this, you could get a margin call. If you ignore this call as well, your broker will close out your position at market without your permission.
It could produce some disconcerting communications from your broker. They generally hate issuing margin calls, and could well close your account if it is too small to bother with, as they create regulatory issues. In order to get belt and braces coverage on this issue, it is best to call your broker and find out exactly what are their assignment policies and procedures. Believe it or not, some are still in the Stone Age, and have yet to automate the assignment process or give notice by email.
An ounce of prevention could be worth a pound of cure here. You can?t believe how irresponsible some of these people can be. The phone calls are free. Consider all this a cost of doing business, or a frictional execution cost. In-the-money options are still a great strategy. But you should be aware of all the ins and outs to get the most benefit.
Good Luck and Good Trading John Thomas
https://www.madhedgefundtrader.com/wp-content/uploads/2014/10/John-Thomas2-e1412947546239.jpg400290Mad Hedge Fund Traderhttps://madhedgefundtrader.com/wp-content/uploads/2019/05/cropped-mad-hedge-logo-transparent-192x192_f9578834168ba24df3eb53916a12c882.pngMad Hedge Fund Trader2014-12-03 09:20:512014-12-03 09:20:51A Special Note on Exercised Bank of America Options
Legal Disclaimer
There is a very high degree of risk involved in trading. Past results are not indicative of future returns. MadHedgeFundTrader.com and all individuals affiliated with this site assume no responsibilities for your trading and investment results. The indicators, strategies, columns, articles and all other features are for educational purposes only and should not be construed as investment advice. Information for futures trading observations are obtained from sources believed to be reliable, but we do not warrant its completeness or accuracy, or warrant any results from the use of the information. Your use of the trading observations is entirely at your own risk and it is your sole responsibility to evaluate the accuracy, completeness and usefulness of the information. You must assess the risk of any trade with your broker and make your own independent decisions regarding any securities mentioned herein. Affiliates of MadHedgeFundTrader.com may have a position or effect transactions in the securities described herein (or options thereon) and/or otherwise employ trading strategies that may be consistent or inconsistent with the provided strategies.