Finally, the economy is starting to deliver the blockbuster numbers that I have been predicting all year.
The 321,000 gain in the November nonfarm payroll on Friday wasn?t just good, they were fantastic, truly of boom time proportions. It was the best report in nearly three years. The headline unemployment rate stayed at 5.8%, a seven year low.
It vindicates my ultra bullish view for the US economy of a robust 4% GDP growth rate in 2015. It also makes my own out-of-consensus $2,100 yearend target for the S&P 500 a chip shot (everybody and his brother?s target now, but certainly out-of-consensus last January).
There has been a steady drip, drip of data warning that something big was headed our way for the last several months. November auto sales a 17 million annualized rate was a key piece of the puzzle, as consumers cashed in on cheap gas prices to buy low mileage, high profit margin SUV?s. The Chrysler Jeep Cherokee, a piece of crap car if there ever was one, saw sales rocket by a mind-boggling 60%!
It reaffirms my view that the 40% collapse in the price of energy since June is not worth the 10% improvement in stock indexes we have seen so far. It justifies at least a double, probably to be spread over the next three years.
It also looks like Santa Claus will be working overtime this Christmas. Retailers are reporting a vast improvement over last year?s weather compromised sales results. A standout figure in the payroll report was the 50,000 jobs added by the sector. This is much more than just a seasonal influence, as FedEx and UPS pile on new workers.
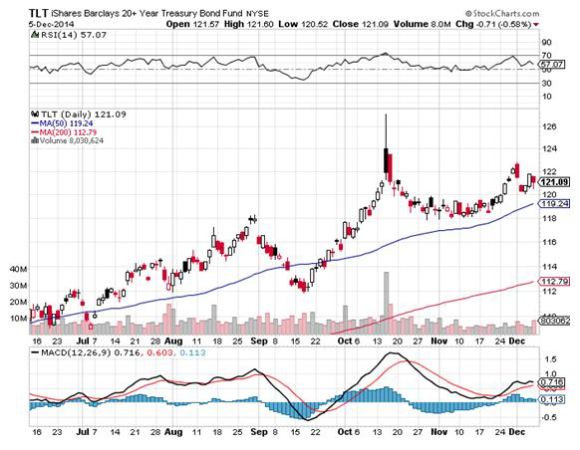
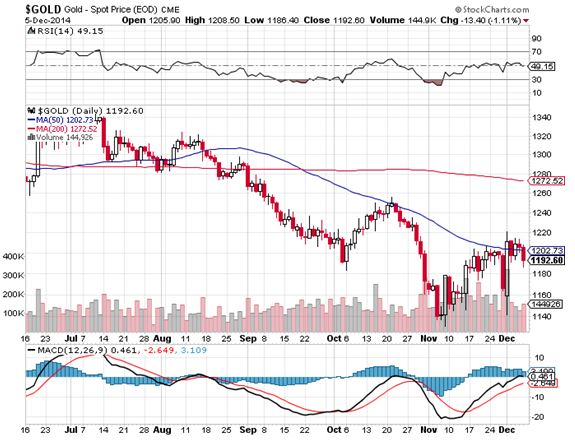
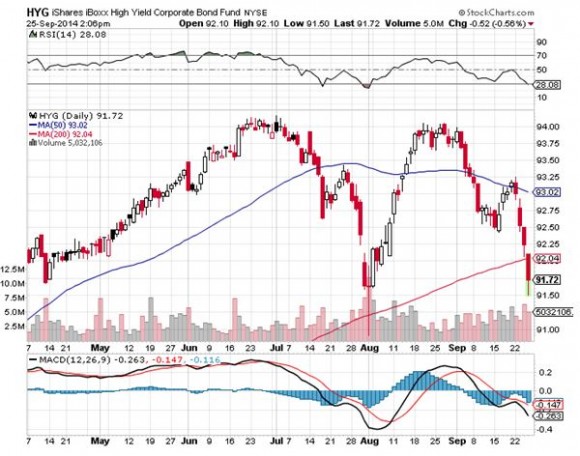
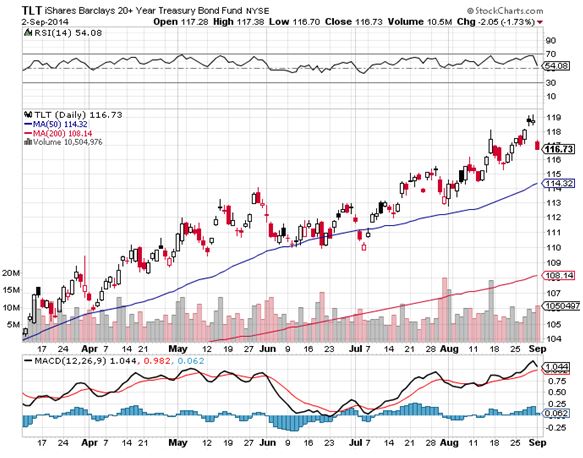
The market impact was predictable. Treasury bond yields (TLT) spiked 10 basis points, the biggest one-day gain in four years. My position in the short Treasury ETF (TBT) saw a nice pop. Unloved gold (GLD) got slaughtered, again, cratering $25.
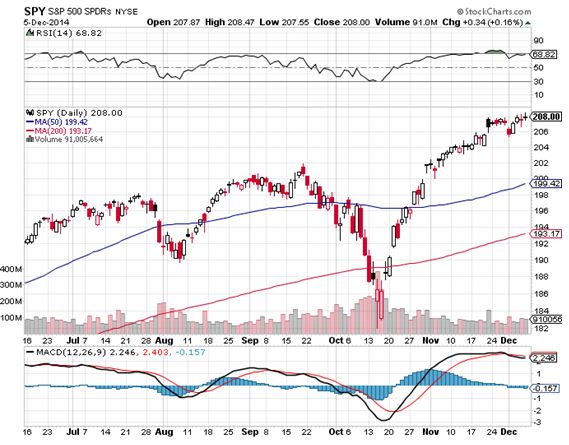
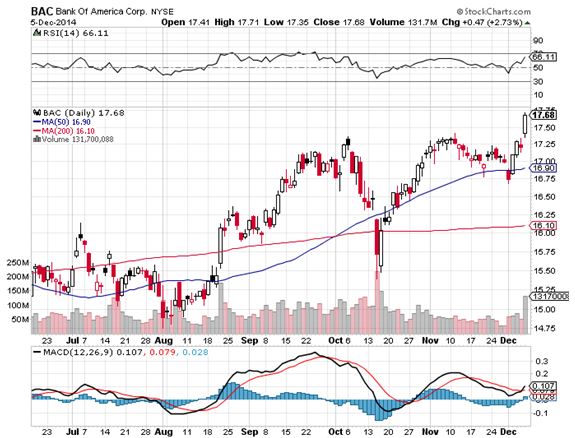
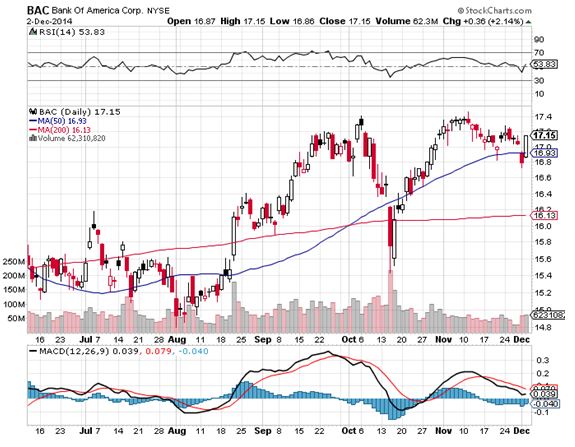
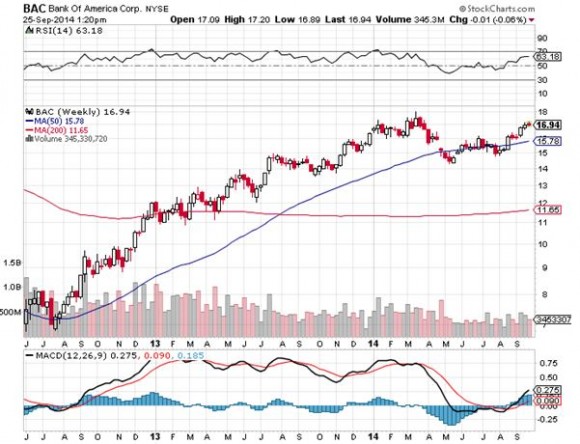
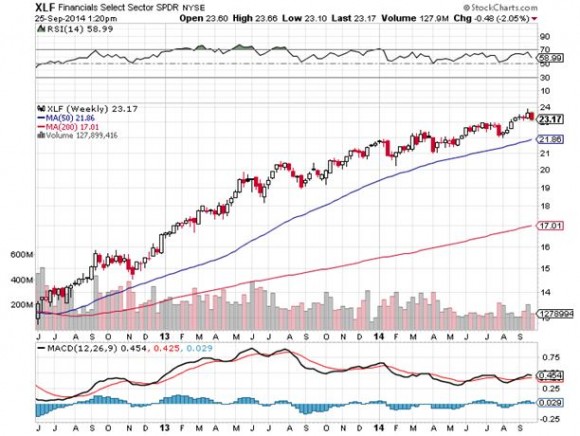
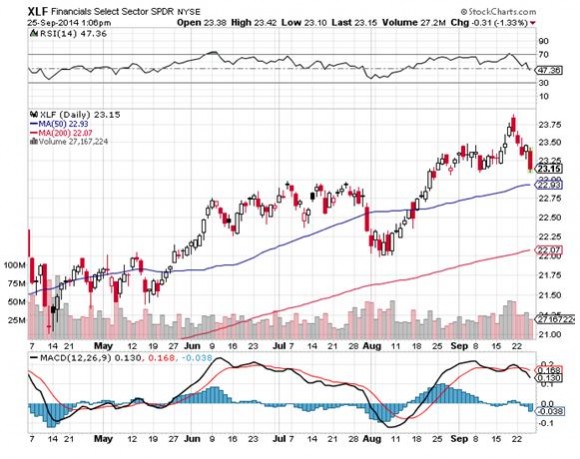
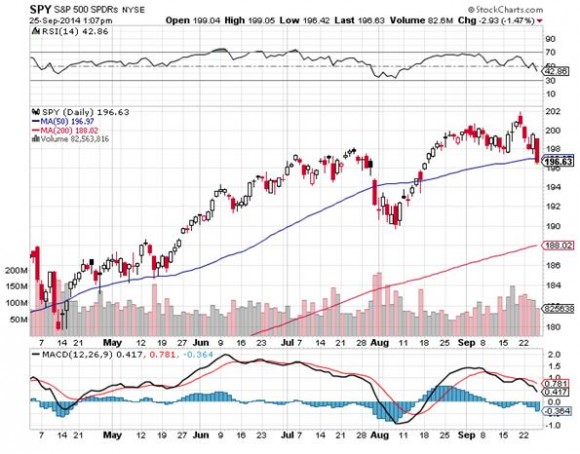
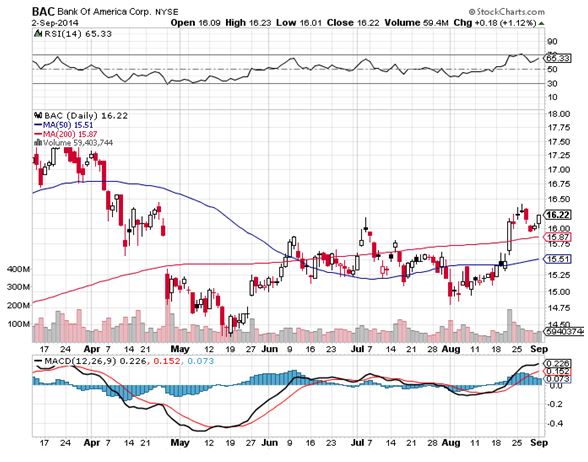
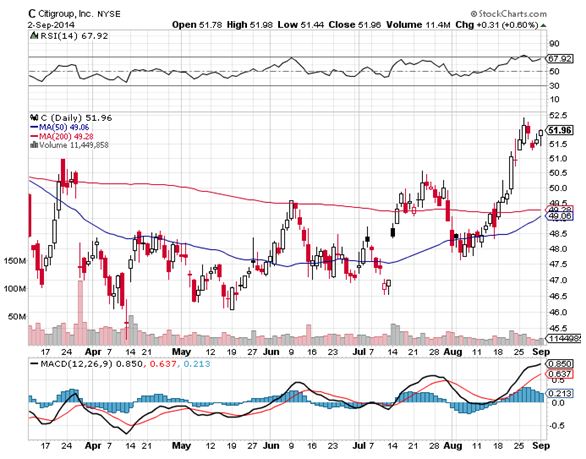
Stocks (SPY) didn?t see any big moves, and simply failed to give up their recent humongous gains once again. A major exception was the financials (XLF), egged on by diving bond prices. My long in Bank of America (BAC) saw another new high for the year.
All in all, it was another good day for followers of the Mad Hedge Fund Trader.
To understand how overwhelmingly positive the report was, you have to dive into the weeds. Average hourly earnings were up the most in 17 months. The September payroll report was revised upward from 256,000 to 271,000, while October was boosted from 214,000 to 243,000.
Professional and business services led the pack, up a whopping 86,000. There are serious, non minimum wage jobs. Job gains have averaged an impressive 278,000 over the last three months.
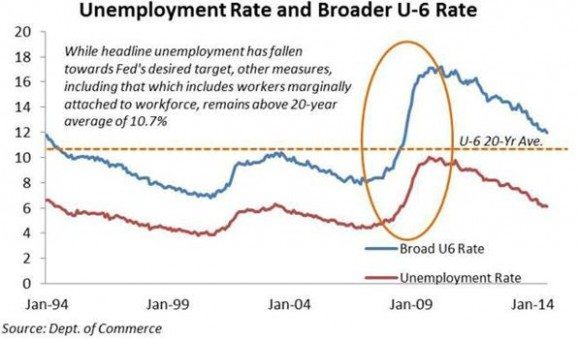
The broader U-6 unemployment rate fell to 11.4%, down from 12.7% a year ago. Most importantly, wage growth is accelerating, and hours worked are at a new cyclical high.
In view of these impressive numbers, it is unlikely that we will see any substantial pullback in share prices for the rest of 2014. For that, we will have to wait until 2015.