Mad Day Trader Jim Parker is expecting the first quarter of 2015 to offer plenty of volatility and loads of great trading opportunities. He thinks the scariest moves may already be behind us.
After a ferocious week of decidedly ?RISK OFF? markets, the sweet spots going forward will be of the ?RISK ON? variety. Sector leadership could change daily, with a brutal rotation, depending on whether the price of oil is up, down, or sideways.
The market is paying the price of having pulled forward too much performance from 2015 back into the final month of 2014, when we all watched the December melt up slack jawed.
Jim is a 40-year veteran of the financial markets and has long made a living as an independent trader in the pits at the Chicago Mercantile Exchange. He worked his way up from a junior floor runner to advisor to some of the world?s largest hedge funds. We are lucky to have him on our team and gain access to his experience, knowledge and expertise.
Jim uses a dozen proprietary short-term technical and momentum indicators to generate buy and sell signals. Below are his specific views for the new quarter according to each asset class.
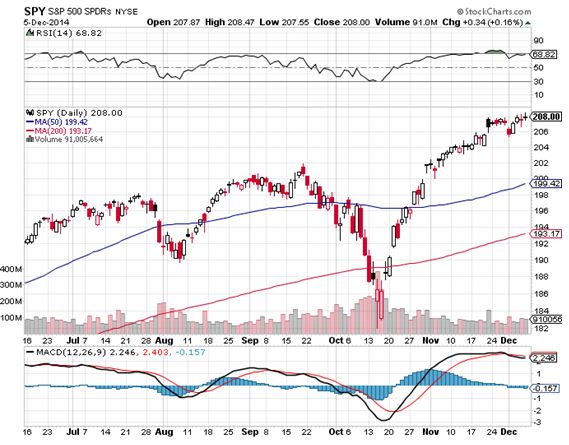
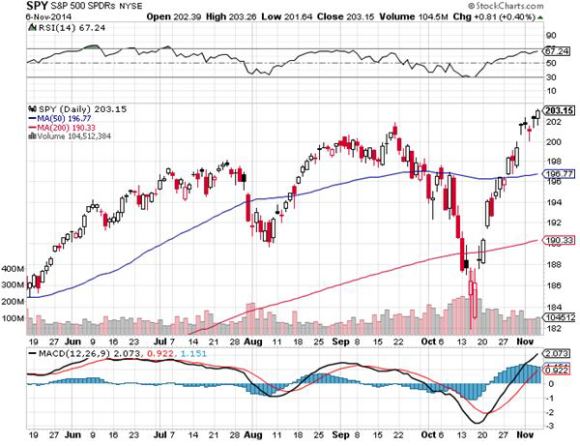
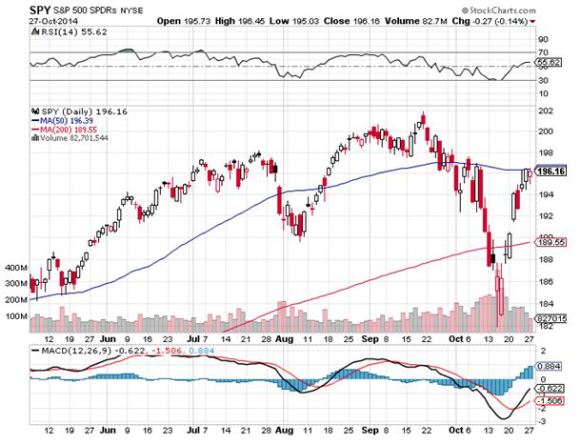
Stocks
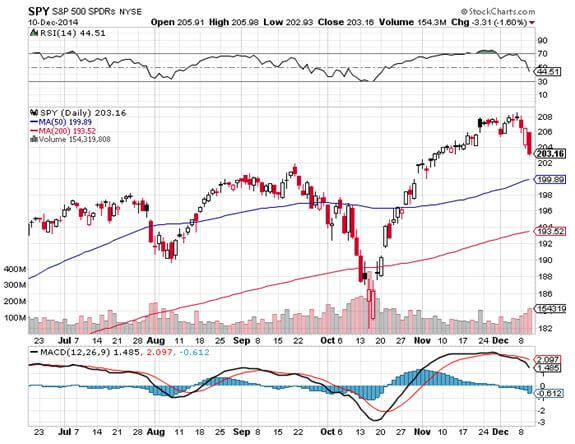
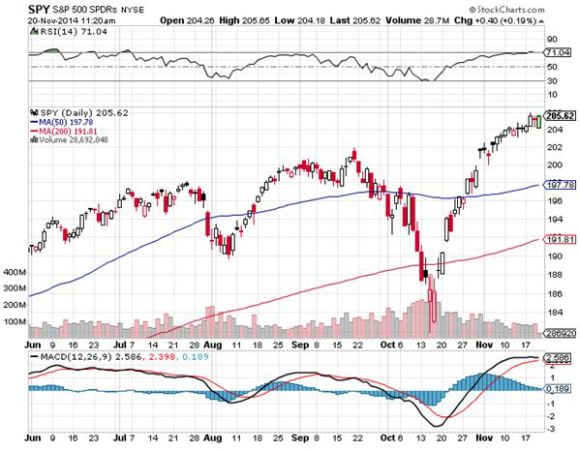
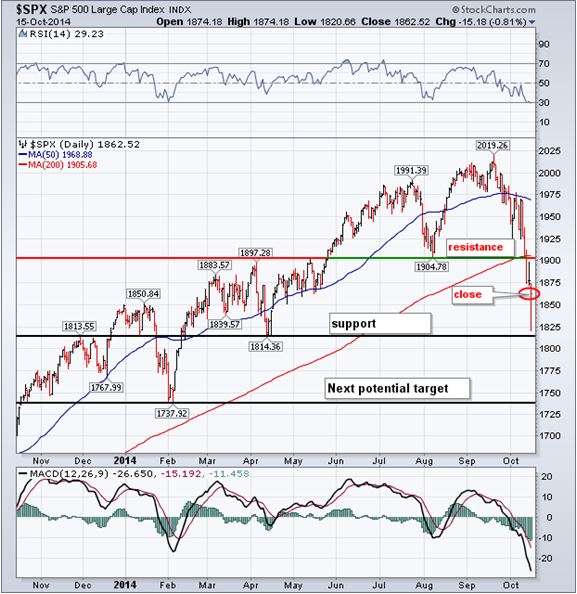
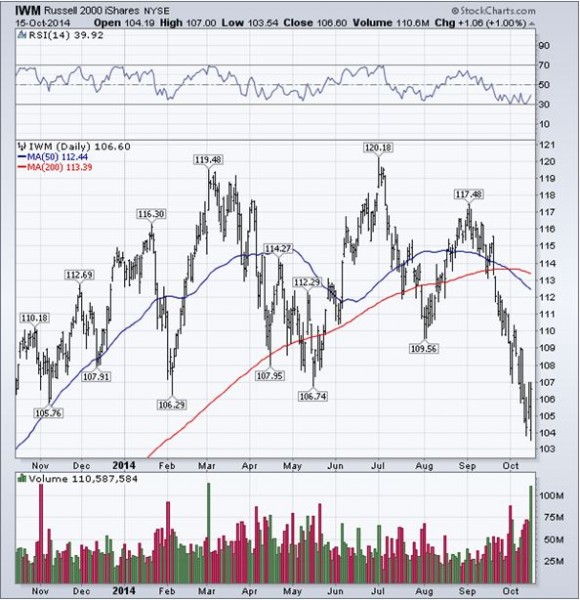
The S&P 500 (SPY) and NASDAQ have met all of Jim?s short-term downside targets, and a sustainable move up from here is in the cards. But if NASDAQ breaks 4,100 to the downside, all bets are off.
His favorite sector is health care (XLV), which seems immune to all troubles, and may have already seen its low for the year. Jim is also enamored with technology stocks (XLK).
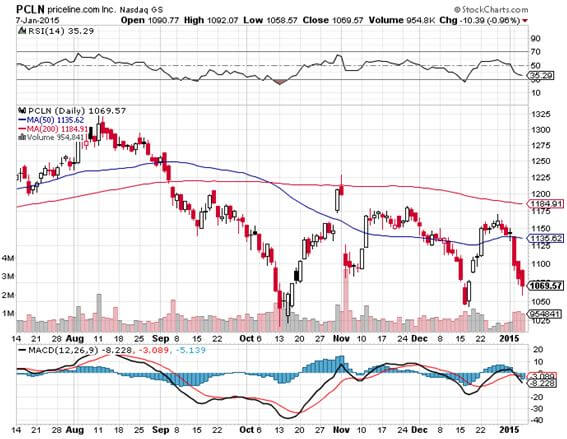
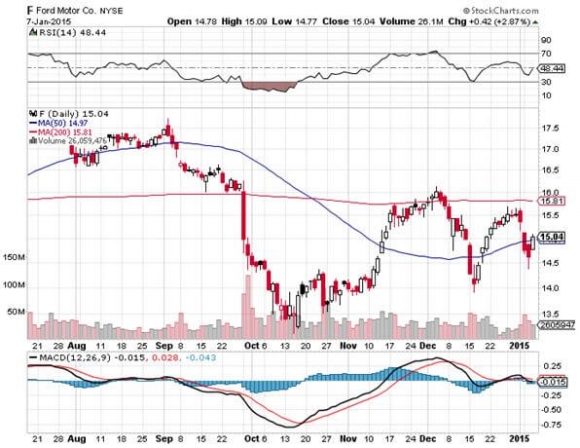
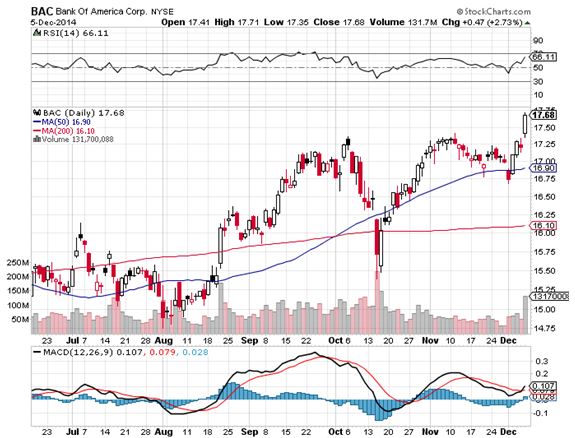
The coming year will be a great one for single stock pickers. Priceline (PCLN) is a great short, dragged down by the weak Euro, where they get much of their business. Ford Motors (F) probably bottomed yesterday, and is a good offsetting long.
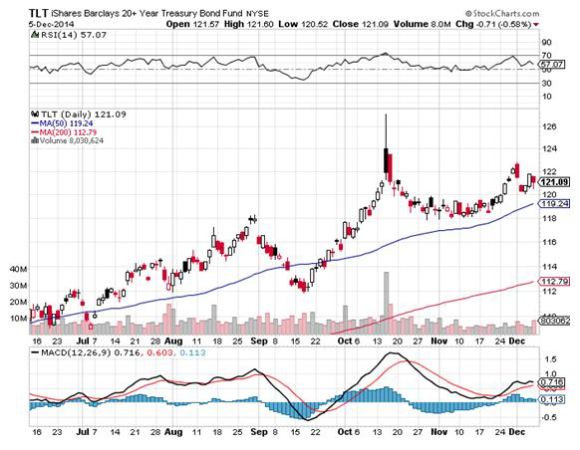
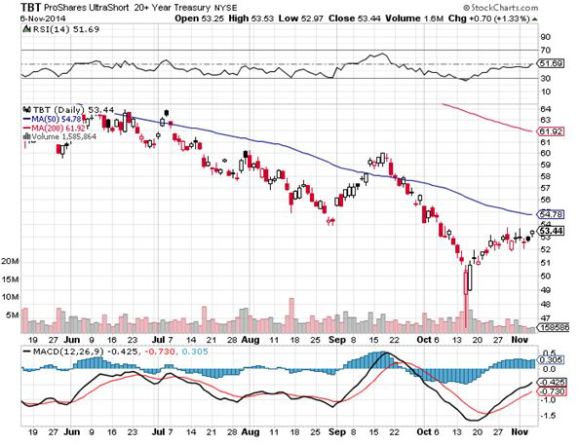
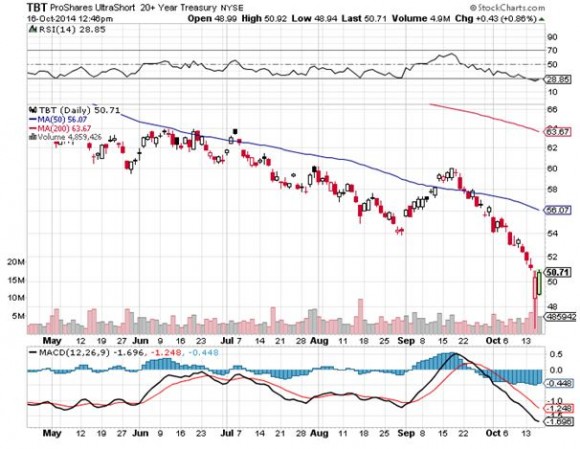
Bonds
Jim is not inclined to stand in front of a moving train, so he likes the Treasury bond market (TLT), (TBT). He thinks the 30-year yield could reach an eye popping 2.25%. A break there is worth another 10 basis points. Bonds are getting a strong push from a flight to safety, huge US capital inflows, and an endlessly strong dollar.
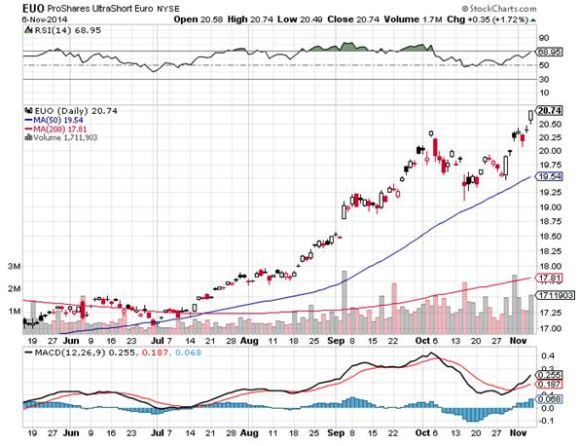
Foreign Currencies
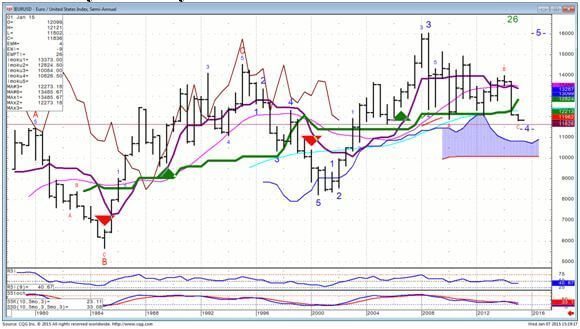
A short position in the Euro (FXE), (EUO) is the no brainer here. The problem is one of good new entry points. Real traders always have trouble selling into a free fall. But you might see profit taking as we approach $1.16 in the cash market.
The Aussie (FXA) is being dragged down by the commodity collapse and an indifferent government. The British pound (FXB) is has yet to recover from the erosion of confidence ignited by the Scotland independence vote and has further mud splattered upon it by the weak Euro.
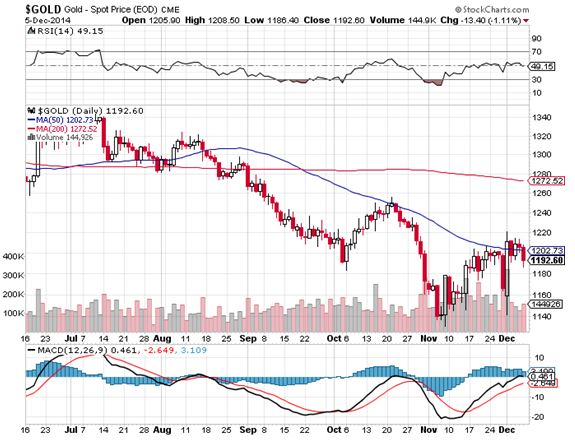
Precious Metals
GOLD (GLD) could be in a good range pivoting off of the recent $1,140 bottom. The gold miners (GDX) present the best opportunity at catching some volatility. The barbarous relic is pulling up the price of silver (SLV) as well. Buy the hard breaks, and then take quick profits. In a deflationary world, there is no long-term trade here. It is a real field of broken dreams.
Energy
Jim is not willing to catch a falling knife in the oil space (USO). He has too few fingers as it is. It has become too difficult to trade, as the algorithms are now in charge, and a lot of gap moves take place in the overnight markets. Don?t bother with fundamentals as they are irrelevant. No one really knows where the bottom in oil is.
Agriculturals
Jim is friendly to the ags (CORN), (SOYB), (DBA), but only on sudden pullbacks. However, there are no new immediate signals here. So he is just going to wait. The next directional guidance will come with the big USDA report at the end of January. The ags are further clouded by a murky international picture, with the collapse of the Russian ruble allowing the rogue nation to undercut prices on the international market.
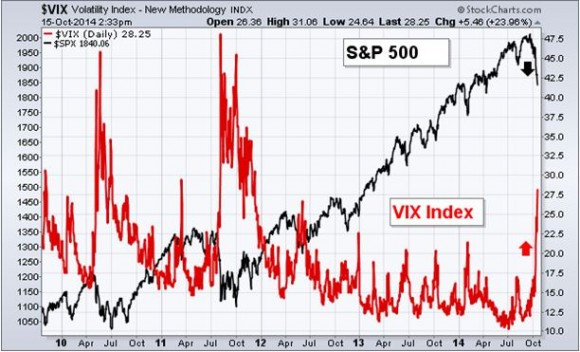
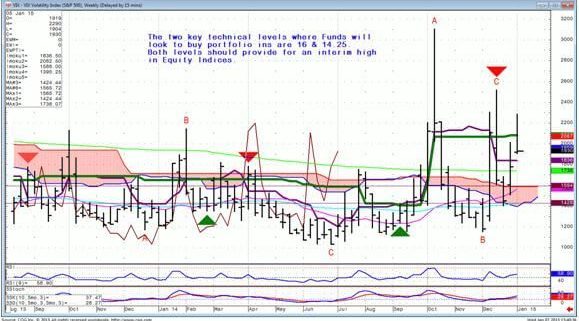
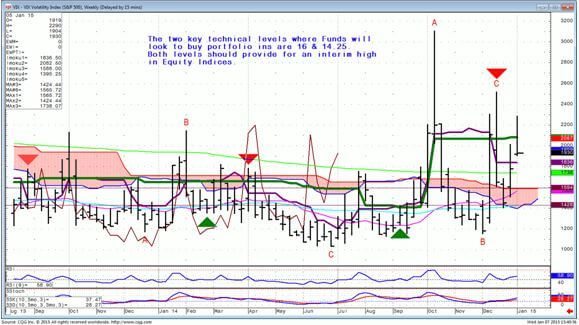
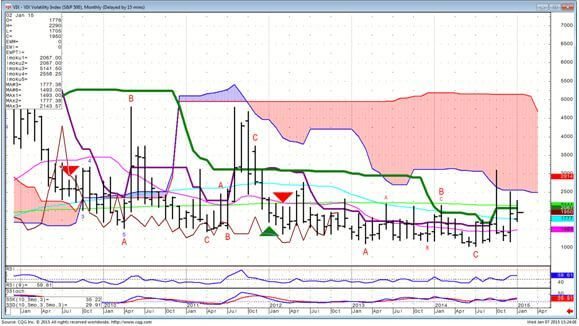
Volatility
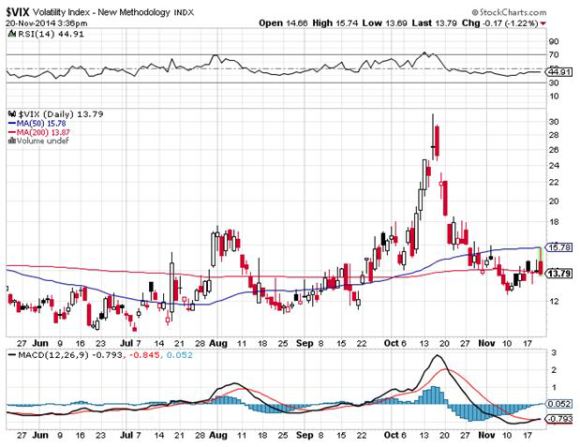
Volatility (VIX), (VXX) is probably going to peak out her soon in the $23-$25 range. The next week or so will tell for sure. A lot hangs on Friday?s December nonfarm payroll report. Every trader out there remembers that the last three visits to this level were all great shorts. However, the next bottom will be higher, probably around the $16 handle.
If you are not already getting Jim?s dynamite Mad Day Trader service, please get yourself the unfair advantage you deserve. Just email Nancy in customer support at support@madhedgefundtrader.com and ask for the $1,500 a year upgrade to your existing Global Trading Dispatch service.
![Volatility Weekly]() Volatility Weekly
Volatility Weekly
![Volatility Monthly (2)]() Volatility Monthly
Volatility Monthly
![Euro to the Dollar]() Euro to the Dollar
Euro to the Dollar