Below please find subscribers' Q&A for the Mad Hedge Fund Trader April Global Strategy Webinar with my guest co-host Bill Davis of the Mad Day Trader.
As usual, every asset class long and short was covered. You are certainly an inquisitive lot, and keep those questions coming!
Q: Many of your April positions are now profitable. Is there any reason to close out before expiration?
A: No one ever got fired for taking a profit. If you feel like you have enough in hand - like 50% of the maximum potential profit in the position, which we do have in more than half of our current positions - go ahead and take it.
I'll probably run all of our April expirations into expiration day because they are very deep in the money. Also, because of the higher volatility and because of higher implied volatility on individual stock options, you're being paid a lot more to run these into expiration than you ever have been before, so that is another benefit.
Of course, one good reason to take profits now is to roll into another position, and when we find them, that may be exactly what we do.
Q: What do you think will be the impact of the US hitting Syria with missiles?
A: Initially, probably a 3-, 4-, or 500-point drop, and then a very rapid recovery. While the Russians have threatened to shoot down our missiles, in actual fact they can't hit the broad side of a barn. When Russians fired their cruise missiles at Syrian targets, half of them landed in Iran.
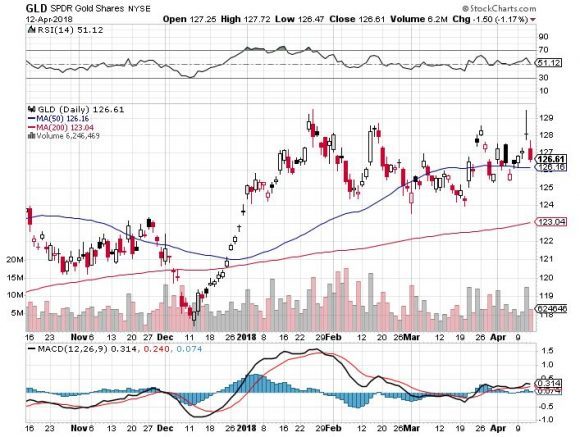
At the end of the day, it doesn't really impact the US economy, but you will see a big move in gold, which we're already starting to see, and which is why we're long in gold - as a hedge against all our other positions against this kind of geopolitical event.
Q: Will 2018 be a bull market or a bear market?
A: We are still in a bull market, but we may see only half the returns of last year - in other words we'll get a 10% profit in stocks this year instead of a 20% profit, which means it has to rise 12% from here to hit that 10% up by year-end.
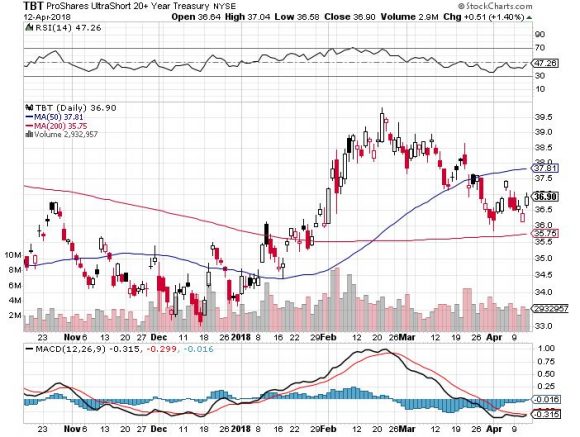
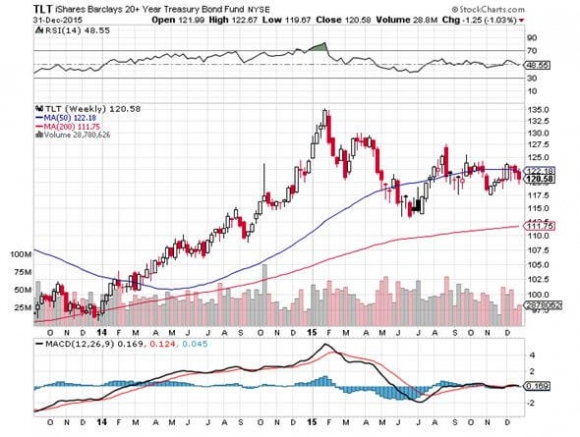
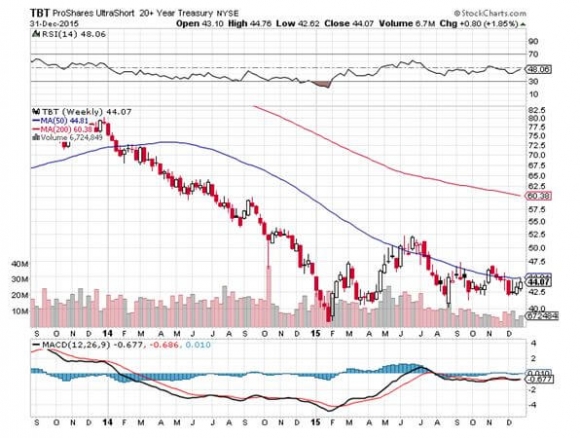
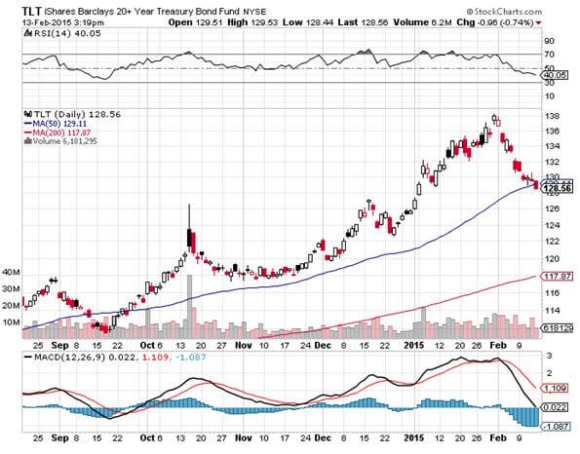
Q: What is your take on the ProShares Ultra Short 20+ Year Treasury Bond Fund (TBT)?
A: I am a big buyer here. I think that interest rates (TLT) are going to move down sharply for the rest of the year. The (TBT) here, in the mid $30s, is a great entry point - I would be buying it right now.
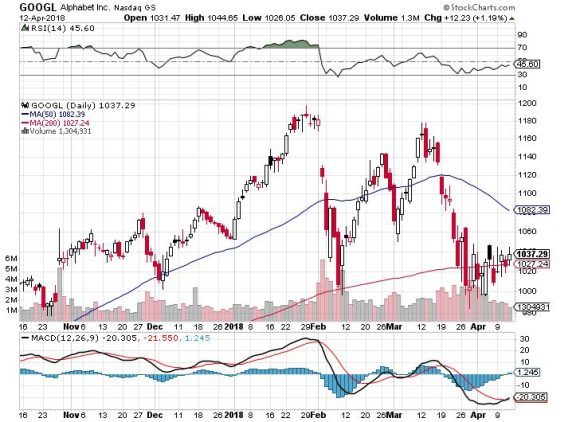
Q: How do you expect Google (GOOGL) to trade when the spread is so wide?
A: It will go up. Google is probably the best-quality technology company in the market, after Facebook (FB). We'll get some money moving out of Facebook into Google for exactly that reason; Google is Facebook without the political risk, the regulatory risk, and the security risks.
Q: Are any positions still a buy now?
A: All of them are buys now. But, do not chase the market on any conditions whatsoever. The market has an endless supply of sudden shocks coming out of Washington, which will give you that down-400-points-day. That is the day you jump in and buy. When you're buying on a 400-down-day, the risk reward is much better than buying on a 400-point up day.
Q: What is "sell in May and go away?"
A: It means take profits in all your positions in May when markets start to face historical headwinds for six months and either A) Wait for another major crash in the market (at the very least we'll get another test of the bottom of the recent range), or B) Just stay away completely; go spend all the money you made in the first half of 2018.
Q: Paul Ryan (the Republican Speaker of the House) resigned today; is he setting up for a presidential run against Trump in 2020?
A: I would say yes. Paul Ryan has been on the short list of presidential candidates for a long time. And Ryan may also be looking to leave Washington before the new Robert Mueller situation gets really unpleasant.
Q: What reaction do you expect if Trump resigns or is impeached?
A: I have Watergate to look back to; the stock market sold off 45% going into the Nixon resignation. It's a different world now, and there were a lot more things going wrong with the US economy in 1975 than there are now, like oil shocks, Vietnam, race riots, and recessions.
I would expect to get a decline, much less than that - maybe only a couple 1,000 points (or 10% or so), and then a strong Snapback Rally after that. We, in effect, have been discounting a Trump impeachment ever since he got in office. Thus far, the market has ignored it; now it's ignoring it a lot less.
Q: Thoughts on Micron Technology (MU), Lam Research (LRCX), and Nvidia (NVDA)?
A: It's all the same story: a UBS analyst who had never covered the chip sector before initiated coverage and issued a negative report on Micron Technology, which triggered a 10% sell-off in Micron, and 5% drops in every other chip company.
He took down maybe 20 different stocks based on the argument that the historically volatile chip cycle is ending now, and prices will fall through the end of the year. I think UBS is completely wrong, that the chip cycle has another 6 to 12 months to go before prices weaken.
All the research we've done through the Mad Hedge Technology Letter shows that UBS is entirely off base and that prices still remain quite strong. The chip shortage still lives! That makes the entire chip sector a buy here.
Q: Can Trump bring an antitrust action against Amazon?
A: No, no chance whatsoever. It is all political bluff. If you look at any definition of antitrust, is the consumer being harmed by Amazon (AMZN)?
Absolutely not - if they're getting the lowest prices and they're getting products delivered to their door for free, the consumer is not being harmed by lower prices.
Second is market share; normally, antitrust cases are brought when market shares get up to 70 or 80%. That's what we had with Microsoft (MSFT) in the 1990s and IBM (IBM) in the 1980s. The largest share Amazon has in any single market is 4%, so no there is basis whatsoever.
By the way, no president has ever attacked a private company on a daily basis for personal reasons like this one. Thank the president for giving us a great entry point for a stock that has basically gone up every day for two years. It's a rare opportunity.
Q: How will the trade war end?
A: I think the model for the China trade war is the US steel tariffs, where we announced tariffs against the entire world, and then exempted 75% of the world, declaring victory. That's exactly what's going to happen with China: We'll announce massive tariffs, do nothing for a while, and then negotiate modest token tariffs within a few areas. The US will declare victory, and the stock market rallies 2,000 points. That's why I have been adding risk almost every day for the last two weeks.
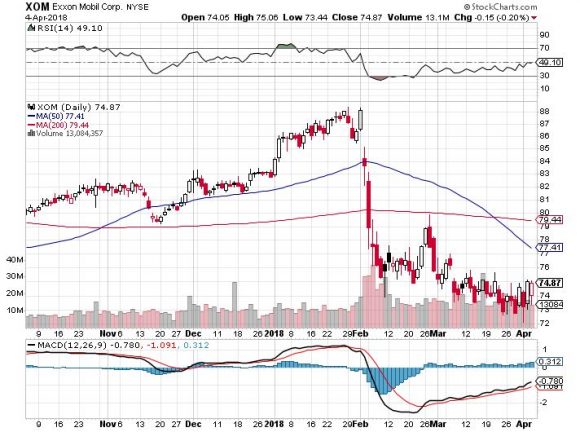
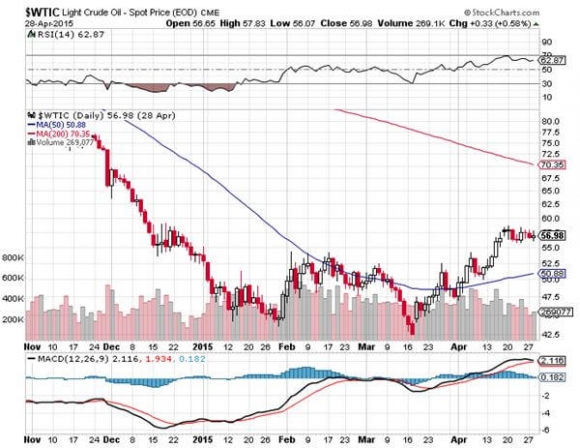
Q: Would you be buying ExonMobil (XOM) here, hoping for an oil breakout?
A: No, I think it's much more likely that oil is peaking out here, especially given the slowing economic data and a huge onslaught in supply from US fracking. We're getting big increases now in fracking numbers - that is very bad for prices a couple of months out. The only reason oil is this high is because Iran-sponsored Houthi rebels have been firing missiles at Saudi Arabia, which are completely harmless. In the old days, this would have caused oil to spike $50.
Q: Would you be selling stock into the rally (SPY), (QQQ)?
A: Not yet. I think the market has more to go on the upside, but you can still expect a lot of inter-day volatility depending on what comes out of Washington.
Q: Do you ever use stops on your option spreads?
A: I use mental stops. They don't take stop losses on call spreads and put spreads, and if they did they would absolutely take you to the cleaners. These are positions you never want to execute on market orders, which is what stop losses do. You always want to be working the middle of the spread. So, I use my mental stop. And when we do send out stop loss trade alerts, that's exactly where they're coming from.
Q: Will the Middle East uncertainty raise the price of oil?
A: Yes, if the Cold War with Iran turns hot, you could expect oil to go up $10 or $20 dollars higher, fairly quickly, regardless of what the fundamentals are. It's tough to be blowing up oil supplies as a great push on oil prices. But that's a big "if."
Hello from the Italian Riviera!
https://www.madhedgefundtrader.com/wp-content/uploads/2018/04/John-Italian-Riviera-story-2-image-4-e1523567901524.jpg225300MHFTRhttps://madhedgefundtrader.com/wp-content/uploads/2019/05/cropped-mad-hedge-logo-transparent-192x192_f9578834168ba24df3eb53916a12c882.pngMHFTR2018-04-13 01:06:552018-04-13 01:06:55April 11 Global Strategy Webinar Q&A
If true, the implications for your stock portfolio could be momentous. So why is the stock market REALLY going down?
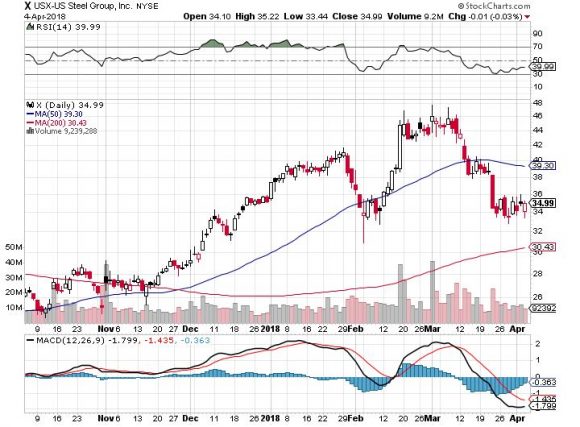
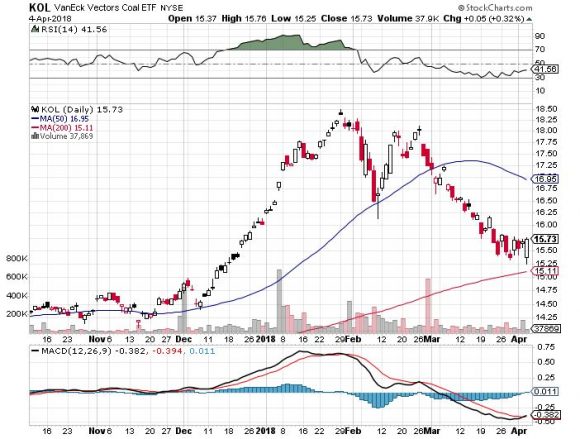
The oil industry would far and away be the worst affected. That explains why big companies such as Exxon Mobile (XOM) are hitting new one-year lows, even though the price of Texas tea has risen by an impressive 50% since the summer.
Also taken out to the woodshed for a spanking have been steel and coal. It is fascinating to note that the shares of the supposed beneficiaries of the trade war, coal (KOL) and steel (X), have on average dropped twice as much as the victims, such as technology, since the correction began in February.
China buys some 70% of all US coal exports, which is why the principal US rail routes have shifted from going from North-South to East-West.
Tape readers believe it is a direct outcome of the tit-for-tat trade war with China. But given the small numbers out so far I believe this is being vastly overexaggerated by the media.
The $100 billion out of $1 trillion in two-way trade, generating a total of $25 billion in new tariffs between the two countries, is too small to even affect the GDP numbers.
Academics and Fed watchers argue that the infinitesimal rate of interest rate hikes by our central banks, six in three years, is finally starting to bite. It's just a matter of time before the frog realizes that it has been boiled.
Technology is the lead sector in the market, and it doesn't borrow AT ALL, accounting for 25% of market capitalization, funding growth entirely through cash flow.
In Washington there is a different view.
Plunging share indexes, bringing the biggest intraday swings seen in a decade, can only mean one thing. The Democrats may be about to retake Congress.
The Democrats only need to seize 24 seats in the House and two seats in the Senate to achieve a simple majority.
So far, some 38 House Republicans have announced they are not running for reelection. It's not because they are tired of exercising power. It's because they don't believe they can survive either a Democratic onslaught, or a primary challenge from the far right wing of their own party.
They also are facing the lowest presidential popularity ratings ever seen for a midterm election. Until a few weeks ago, Trump was scraping the basement with a 36% approval, also it has ticked up recently.
So if the Dems take control, what are the investment implications?
A president from one party and a congress from the other is a fairly common occurrence. That was the state of affairs during the past six years of the Obama administration, and the past two years of George Bush's.
In other words, it's a survivable situation.
It has long been said that markets love gridlocked government. At the end of the day, they wish Washington would go away so everyone can get on with the important business of making money.
For a start, a Democratic win would assure that no important legislation would be passed into law for two years.
But it goes beyond that. Majority control means that the Democrats would get control of the chairmanships of every committee. That means that the investigation of Trump's various actions would escalate from a slow burn to a full-fledged flash fire.
While this may occupy the headlines of newspapers, it will have minimal impact on the markets or the economy. Only the hard cases will even notice.
And now for a quickie civics lesson, which I understand they don't teach in high school anymore.
A Democratic win in the Senate would almost certainly bring an impeachment trial, where only a simple major majority of 51 is required. That would stall markets for about three months.
And no matter how rosy the prospects are for Democratic gains, they are unlikely to reach the two-thirds majority needed for an actual conviction.
For that the Dems would have to win 94 seats, a near impossibility in this heavily gerrymandered country. Just to get a simple majority in the House, the Democrats have to win 58% of the popular vote. But they could reach a tipping point.
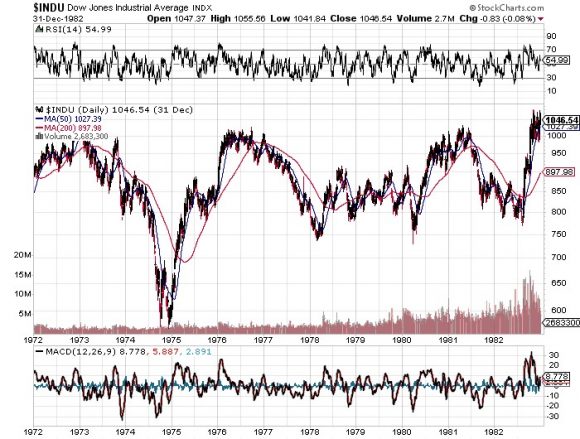
In short, it's all looking like 1975 all over again. What happened after 1975? After collapsing 45%, then rallying from a Nixon resignation low of a Dow Average of 550 to 1,000, it then took EIGHT YEARS for stocks to rally another 1,000 points.
Wall Street shrank dramatically, and many brokers become taxi drivers. It's not a pleasant prospect, except that today they would become Uber drivers.
I remember it like it was yesterday.
The endless bear market was a major reason why I started my career as a financial journalist for The Economist magazine in London rather than heading straight for Wall Street.
Once the new bull market started in 1983, I was inside Morgan Stanley (MS) within a year, while it was still private.
And thanks to Bob Baldwin for the job, a Navy man and Ivy Leaguer who lived to 95!
If the election was held tomorrow, the Democrats would almost certainly get control. But the election is not tomorrow, it is in seven months, and in politics that could be seven lifetimes.
Polls could improve for Trump. But then they could get a whole lot worse, too. And then there is Robert Mueller constantly lurking at the periphery.
In the end, markets might not do much of anything in a gridlocked government.
Much of the prosperity of America has occurred independent of the goings on in the nation's capital. It has taken place in spite of, not because of government policies.
Technology companies, now 25% of the economy (it was 26% two weeks ago) will continue to push the envelope forward at a hyperaccelerating rate, creating trillions of dollars in new shareholder value.
Thank goodness for that!
However, the volatility to get to nothing could be extreme, as we now are witnessing.
Dow Average 1972-83
https://www.madhedgefundtrader.com/wp-content/uploads/2018/04/435-story-2-image-5-e1522883337663.jpg200350MHFTRhttps://madhedgefundtrader.com/wp-content/uploads/2019/05/cropped-mad-hedge-logo-transparent-192x192_f9578834168ba24df3eb53916a12c882.pngMHFTR2018-04-05 01:07:212018-04-05 01:07:21Is the Stock Market Calling a Democratic Win in November?
Suddenly, the consolidation turned into a correction and maybe even a bear market.
A crucial part of trading a crash is knowing what to do at the bottom. Don?t worry. You?ll receive a flurry of text alerts from me right when that happens.
Many individual investors simply run to the bathroom and lock the door, hoping nobody knocks on the door for a couple of days.
Worse, they dump every stock they have. That?s what makes market bottoms.
Trades that once seemed impossible can now get done, provided you use limit orders.
Let me get this right. Stocks are crashing because:
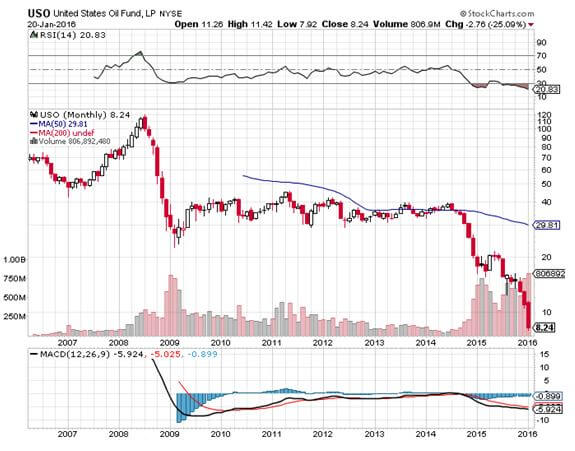
1) The Federal Reserve isn?t going to raise interest rates anymore. 2) The price of oil has dropped 84% in five years. 3) Commodities have reached multi-decade lows. 4) The US dollar has suddenly stabilized. 5) Investors are yanking money from abroad and pouring it into the US on a flight to safety trade because it is the only place they can obtain a positive return, especially in stocks.
May I point out the screamingly obvious right here?
These are all reasons for 90% of US companies that borrow money and consume energy and commodities to increase earnings and to boost their share prices.
Only the 10% that derive revenues from ripping oil and commodities out of the ground should get hurt here.
Of course the market doesn?t know that. It is anything but rational when we hit big triple digit declines. There was only one direction on, and that was OUT.
And that is where you make your money
Margin clerks rule supreme, squeezing every bit of leverage out of their clients they can find.
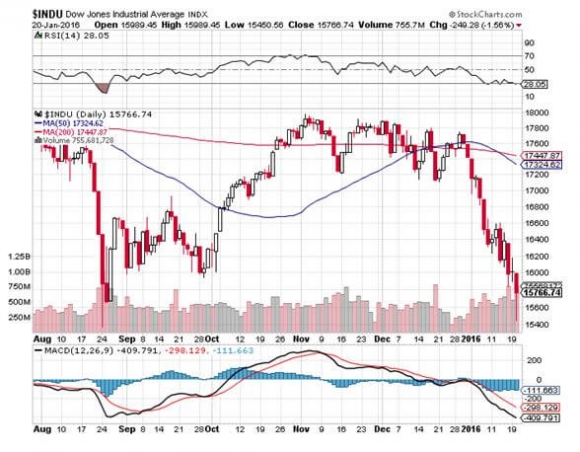
The Dow and (SPY) are already posting large negative numbers for 2016.
Of course, I saw all of this coming a mile off.
I have been banging drums, pulling fire alarms, shooting off flare guns, and otherwise warning readers that the technical situation for the market was terrible ever since I went 100% into cash in December.
When the breakdown appeared imminent, I shot out Trade Alerts to sell short the S&P 500 (SPY) in size as fast as I could write them. And I started buying outright (SPY) puts for the first time in ages.
As a result of these sudden tactical moves, my model-trading portfolio has been keeping its head above water all month, up 2%. The Dow Average is off by a nausea inducing -10.7% at today?s low.
Yes, yes! All the hard work and research is paying off!
Ignore my musings at your peril!
What is even more stunning is that these declines are occurring in the face of US macro economic numbers that are going from strength to strength. The blockbuster December nonfarm payroll report of 292,000 is the real writing on the wall.
Housing, which accounts for about one third of the US economy, has been on fire. I?m sorry, but if you can?t find a parking space at Target, there is no recession.
Another crucial leg of the US economy, auto manufacturing, has been in overdrive. Auto sales are at a record 18 million annual rate, and some summer production shut downs have been cancelled.
That is, everywhere except Volkswagen.
With two of the most important legs firing on all cylinders, it?s clearly not about the economy, stupid!
There certainly hasn?t been a geopolitical event to justify moves of this magnitude.
As far as I can tell, Hitler has not invaded Poland, nor have the Japanese attacked Pearl Harbor.
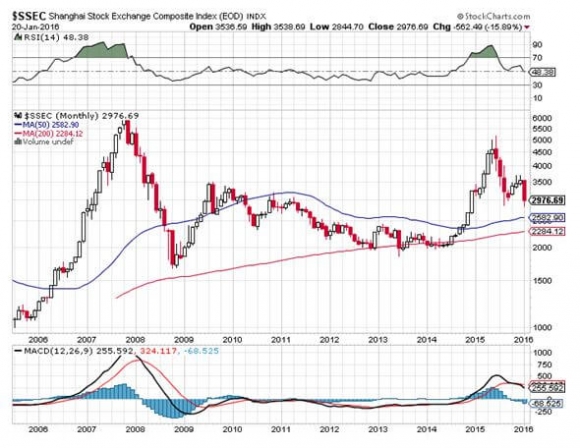
Sure, there is whining about China, which has the Shanghai Index approaching the 2,900 level once again, down 40% from the top.?
Which leads me to believe that all of this is nothing more than a temporary hiccup. A BIG Hofbrauhouse kind of hiccup, but a hiccup nonetheless.
In a zero interest rate world, stocks only have to fall back from a price earnings multiple of 18 to 15 to flush out a ton of buying, and they will have done just that when the (SPY) hits $174.
THAT IS MY LINE IN THE SAND.
If nothing else, corporate buybacks should reaccelerate here, which could reach $1 trillion in 2016. Some 75% companies exit their quiet period by February 5 and can resume buying.
That could signal an interim market bottom.
The great thing about this selloff is that the best quality companies have fallen the most. This has been a function of the heavy sovereign wealth fund selling the bridge oil deficits.
After all, when share prices are in free fall, you have to sell what you can, not what you want to. It is only human to realize profits rather than incur losses, so quality has been trashed.
I am therefore going to give you a list of ten of my favorite stocks to buy at the bottom, highlighting the sectors that will lead us into a yearend rally.
The themes here are home builders, consumer discretionary, autos, solar, old technology, and international. I?m sorry, but the entire interest sensitive sector is on hold for the rest of the year, thanks to likely Fed inaction.
Watch out, because when I sense that the market has burned itself out on the downside, the Trade Alerts are going to be coming hot and heavy.
You have been forewarned!
Read ?em and weep with joy!
10 Stocks to Buy at the Bottom
Lennar Homes (LEN) Home Depot (HD) Microsoft (MSFT) General Electric (GE) Tesla (TSLA) Apple (AAPL) First Solar (FSLR) Palo Alto Networks (PANW) Wisdom Tree Japan Hedged Equity (DXJ) Wisdom Tree Europe Hedged Equity (HEDJ)
Finally, All the Hard Work is Paying Off
https://www.madhedgefundtrader.com/wp-content/uploads/2015/07/John-Thomas5-e1437678792272.jpg299400Mad Hedge Fund Traderhttps://madhedgefundtrader.com/wp-content/uploads/2019/05/cropped-mad-hedge-logo-transparent-192x192_f9578834168ba24df3eb53916a12c882.pngMad Hedge Fund Trader2016-01-21 01:06:152016-01-21 01:06:15Ten Stocks to Buy at the Bottom
I am once again writing this report from a first class sleeping cabin on Amtrak?s California Zephyr.
By day, I have two comfortable seats facing each other next to a panoramic window. At night, they fold into bunk beds, a single and a double. There is a shower, but only Houdini could get in and out of it.
I am not Houdini, so I go downstairs to use the larger public showers.
We are now pulling away from Chicago?s Union Station, leaving its hurried commuters, buskers, panhandlers, and majestic great halls behind. I love this building as a monument to American accomplishment.
I am headed for Emeryville, California, just across the bay from San Francisco. That gives me only 56 hours to complete this report.
I tip my porter, Raymond, $100 in advance to make sure everything goes well during the long adventure, and to keep me up to date with the onboard gossip.
The rolling and pitching of the car is causing my fingers to dance all over the keyboard. Spellchecker can catch most of the mistakes, but not all of them.
Thank goodness for small algorithms.
As both broadband and cell phone coverage are unavailable along most of the route, I have to rely on frenzied searches during stops at major stations along the way to chase down data points.
You know those cool maps in the Verizon stores that show the vast coverage of their cell phone networks? They are complete BS.
Who knew that 95% of America is off the grid? That explains a lot about our country today. I have posted many of my better photos from the trip below, although there is only so much you can do from a moving train and an iPhone 6.
After making the rounds with strategists, portfolio managers, and hedge fund traders, I can confirm that 2015 was one of the toughest to trade for careers lasting 30, 40, or 50 years. Even the stay-at-home index players had their heads handed to them.
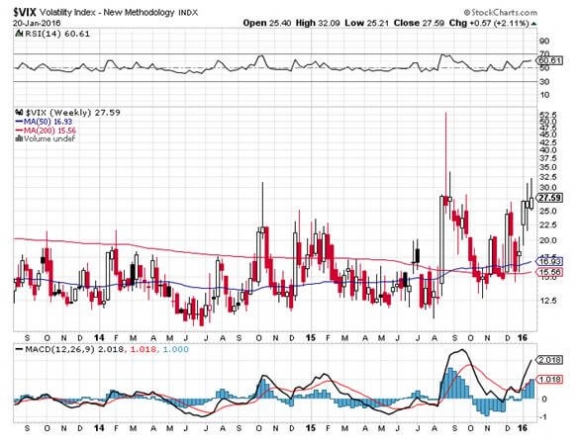
With the Dow gaining 3.1% in 2015, and S&P 500 almost dead unchanged, this was a year of endless frustration. Volatility fell to the floor, staying at a monotonous 12% for eight boring consecutive months before spiking repeatedly many times to as high as 52%. Most hedge funds lagged the index by miles.
My Trade Alert Service, hauled in an astounding 38.8% profit, at the high was up 48.7%, and has become the talk of the hedge fund industry.
If you think I spend too much time absorbing conspiracy theories from the Internet, let me give you a list of the challenges I see financial markets facing in the coming year:
The Four Key Variables for 2016
1) Will the Fed raise interest rates more or not?
2) Will China?s emerging economy see a hard or soft landing?
3) Will Japanese and European quantitative easing increase, or remain the same?
4) Will oil bottom and stay low, or bounce hard?
Here are your answers to the above: no, soft, more later, bounce hard later.
There you go! That?s all the research you have to do for the coming year. Everything else is a piece of cake.
The Ten Highlights of 2015
1) Stocks will finish higher in 2016, almost certainly more than the previous year, somewhere in the 5% range and 7% with dividends. Cheap energy, a recovering global economy, and 2-3% GDP growth, will be the drivers. However, this year we have a headwind of rising interest rates and falling multiples.
2) Expect stocks to take a 15% dive. That gives us a -15% to +5% trading range for the year. Volatility will remain permanently higher, with several large spikes up. That means you are going to have to pedal harder to earn your crust of bread in 2016.
3) The Treasury bond market will modestly grind down, anticipating the next 25 basis point rate rise from the Federal Reserve, and then the next one after that.
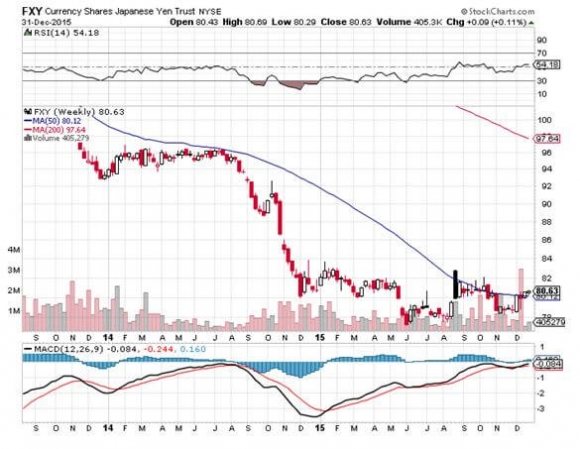
4) The yen will lose another 5% against the dollar.
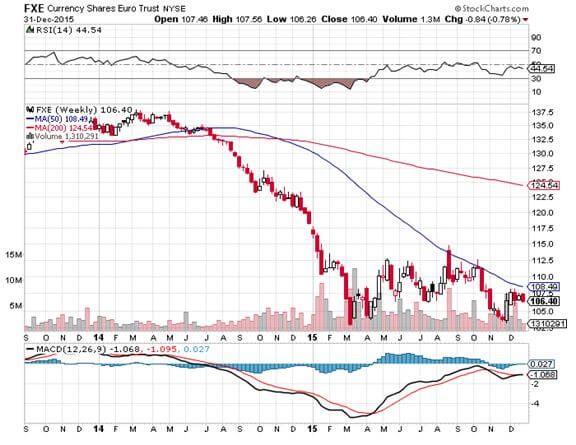
5) The Euro will fall another 5%, doing its best to hit parity with the greenback, with the assistance of beleaguered continental governments.
6) Oil stays in a $30-$60 range, showering the economy with hundreds of billions of dollars worth of de facto tax cuts.
7) Gold finally bottoms at $1,000 after one more final flush, then rallies $250. (My jeweler was right, again).
8) Commodities finally bottom out, thanks to new found strength in the global economy, and begin a modest recovery.
9) Residential real estate has made its big recovery, and will grind up slowly from here for years.
10) The 2016 presidential election will eat up immense amounts of media and research time, but will have absolutely no impact on financial markets. Give your money to charity instead.
The Thumbnail Portfolio
Equities - Long. A rising but high volatility year takes the S&P 500 up to 2,200. Technology, biotech, energy, solar, consumer discretionary, and financials lead. Energy should find its bottom, but later than sooner.
Bonds - Short. Down for the entire year, but not by much, with long periods of stagnation.
Foreign Currencies - Short. The US dollar maintains its bull trend, especially against the Yen and the Euro, but won't gain nearly as much as in 2015.
Commodities - Long. A China recovery takes them up eventually.
Precious Metals - Buy as close to $1,000 as you can. We are overdue for a trading rally.
Agriculture - Long. El Nino in the north and droughts in Latin American should add up to higher prices.
Real estate - Long. Multifamily up, commercial up, single family homes up small.
1) The Economy - Fortress America
I think real US economic growth will come in at the 2.5%-3% range.
With a generational demographic drag continuing for five more years, don?t expect more than that. Big spenders, those in the 46-50 age group, don?t return in larger numbers until 2022.
But this negative will be offset by a plethora of positives, like hyper-accelerating technology, global expansion, and the lingering effects of the Fed?s massive five year quantitative easing.
US corporate profits will keep pushing to new all time highs. But this year we won?t be held back by the collapsing economies of Europe, China, and Japan, which subtracted about 0.5% from American economic growth, nor weak energy.
US Corporate earnings will probably come in at $130 a share for the S&P 500, a gain of 10% over the previous year. During the last six years, we have seen the most dramatic increase in earnings in history, taking them to all-time highs.
Technology and dramatically lower energy costs are the principal sources of profit increases, which will continue their inexorable improvements. Think of more machines and software replacing people.
You know all of those hundreds of billions raised from technology IPO?s in 2015? Most of that is getting plowed right back into new start ups, increasing the rate of technology improvements even further, and the productivity gains that come with it.
We no longer have the free lunch of zero interest rates. But the cost of money will rise so slowly that it will barely impact profits. Deflation is here to stay. Watch the headline jobless rate fall below 5% to a full employment economy.
Keep close tabs on the weekly jobless claims that come out at 8:30 AM Eastern every Thursday for a good read as to whether the financial markets will head in a ?RISK ON? or ?RISK OFF? direction.
For the first time in seven years, earnings multiples are going to fall, but not by much. That is the only possible outcome in a world with rising interest rates, however modestly.
If multiples fall by 5%, from the current 18X to 17.1X, profits increase by 10%, and you throw in a 2% dividend, you should net out a 7% return by the end of the year.
S&P 500 earnings fell by 6% in 2015, but take out oil and they grew by 5.6%. In 2016, energy will be a lesser drag, or not at all. That makes my 10% target doable.
That is not much of a return with which to take on a lot of risk. But remember, in a near zero interest rate world, there is nothing else to buy.
This is not an outrageous expectation, given the 10-22 earnings multiple range that we have enjoyed during the last 30 years.
The market currently trades around fair value, and no market in history ever peaked out here. An overshoot to the upside, often a big one, is mandatory. Yet, that is years off.
After all, my friend, Janet Yellen, is paying you to buy stock with cheap money, so why not? Borrowing money at close to zero and investing in 2% dividend paying stocks has become the world?s largest carry trade.
Rising interest rates will have one additional worrying impact on stock prices. They will pare back mergers and acquisitions and corporate buy backs in 2016.
Together these were the sources of all new net buying of stocks in 2015, some $5.5 trillion worth. Call it financial engineering, but the market loves it.
Although energy looks terrible now, it could well be the top-performing sector by the end of the year, to be followed by commodities.
Certainly, every hedge fund and activist investor out there is undergoing a crash course on oil fundamentals. After a 13-year expansion of leverage in the industry, it is ripe for a cleanout.
Solar stocks will continue on a tear, now that the 30% federal investment tax subsidy has been extended by five more years. Look at Solar City (SCTY), First Solar (FSLR), and the solar basket ETF (TAN). Revenues are rocketing and costs are falling.
After spending a year in the penalty box, look for small cap stocks to outperform. These are the biggest beneficiaries of cheap energy and low interest rates.
Share prices will deliver anything but a straight-line move. Expect a couple more 10% plus corrections in 2015, and for the Volatility Index (VIX) to revisit $30 multiple times. The higher prices rise, the more common these will become.
Amtrak needs to fill every seat in the dining car, so you never know who you will get paired with for breakfast, lunch, and dinner.
There was the Vietnam vet Phantom jet pilot who now refused to fly because he was treated so badly at airports. A young couple desperate to get out of Omaha could only afford seats as far as Salt Lake City, sitting up all night. I paid for their breakfast.
A retired British couple was circumnavigating the entire US in a month on a ?See America Pass.? Mennonites returning home by train because their religion forbade airplanes.
I have to confess that I am leaning towards the ?one and done? school of thought with regards to the Fed?s interest rate policy. We may see a second 25 basis point rise in June, but only if the economy takes off like a rocket and international concerns disappear, an unlikely probability.
If you told me that US GDP growth was 2.5%, unemployment was at a ten year low at 5.0%, and energy prices had just plunged by 68%, I would have pegged the ten-year Treasury bond yield at 6.0%. Yet here we are at 2.25%.
We clearly are seeing a brave new world.
Global QE added to a US profit glut has created more money than the fixed income markets can absorb.
Virtually every hedge fund manager and institutional investor got bonds wrong last year, expecting rates to rise. I was among them, but that is no excuse.
Fixed income turned out to be a winner for me in 2015, as I sold short every bond price spike from the summer onward. It worked like a charm.
You might as well take your traditional economic books and throw them in the trash. Apologies to John Maynard Keynes, John Kenneth Galbraith, and Paul Samuelson.
The reasons for the debacle are myriad, but global deflation is the big one. With ten year German bunds yielding a paltry 62 basis points, and Japanese bonds paying a paltry 26 basis points, US Treasuries are looking like a steal.
To this, you can add the greater institutional bond holding requirements of Dodd-Frank, a balancing US budget deficit, a virile US dollar, the commodity price collapse, and an enormous embedded preference for investors to keep buying whatever worked yesterday.
For more depth on the perennial strength of bonds, please click here for ?Ten Reasons Why I?m Wrong on Bonds?.
Bond investors today get an unbelievable bad deal. If they hang on to the longer maturities, they will get back only 80 cents worth of purchasing power at maturity for every dollar they invest a decade down the road.
But institutions and individuals will grudgingly lock in these appalling returns because they believe that the potential losses in any other asset class will be worse.
The problem is that driving eighty miles per hour while only looking in the rear view mirror can be hazardous to your financial health.
While much of the current political debate centers around excessive government borrowing, the markets are telling us the exact opposite.
A 2% handle on the ten-year yield is proof to me that there is a Treasury bond shortage, and that the government is not borrowing too much money, but not enough.
There is another factor supporting bonds that no one is looking at. The concentration of wealth with the 1% has a side effect of pouring money into bonds and keeping it there. Their goal is asset protection and nothing else.
These people never sell for tax reasons, so the money stays there for generations. It is not recycled into the rest of the economy, as conservative economists insist. As this class controls the bulk of investable assets, this forestalls any real bond market crash, at lest for the near term.
So what will 2016 bring us? I think that the erroneous forecast of higher yields I made last year will finally occur this year, and we will start to chip away at the bond market bubble?s granite edifice.
I am not looking for a free fall in price and a spike up in rates, just a move to a new higher trading range.
We could ratchet back up to a 3% yield, but not much higher than that. This would enable the inverse Treasury bond bear ETF (TBT) to reverse its dismal 2015 performance, taking it from $46 back up to $60.
You might have to wait for your grandchildren to start trading before we see a return of 12% Treasuries, last seen in the early eighties. I probably won?t live that long.
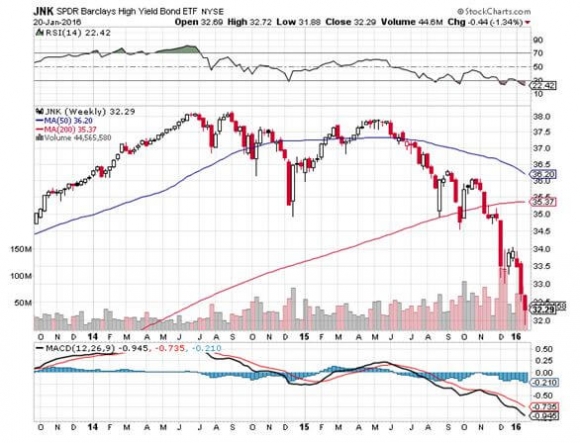
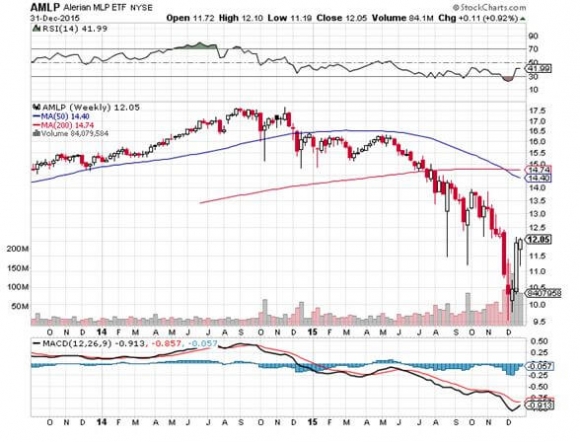
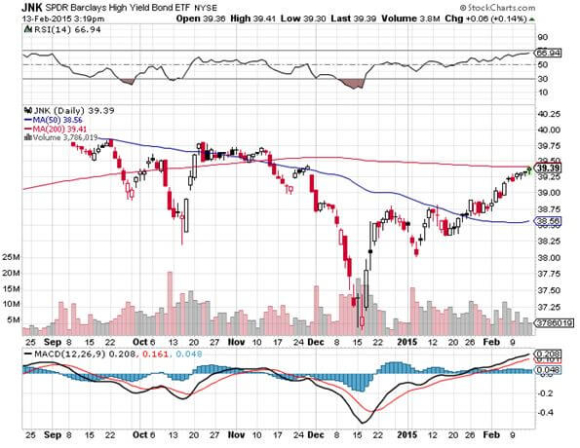
Reaching for yield suddenly went out of fashion for many investors, which is typical at market tops. As a result, junk bonds (JNK) and (HYG), REITS (HCP), and master limited partnerships (AMLP) are showing their first value in five years.
There is also emerging market sovereign debt to consider (PCY). If oil and commodities finally bottom, these high yielding bonds should take off on a tear.
This asset class was hammered last year, so we are now facing a rare entry point.
There is a good case for sticking with munis. No matter what anyone says, taxes are going up, and when they do, this will increase tax-free muni values.
The collapse of the junk bond market suddenly made credit quality a big deal last year. What is better than lending to the government, unless you happen to live in Puerto Rico or Illinois.
So if you hate paying taxes, go ahead and buy this exempt paper, but only with the expectation of holding it to maturity. Liquidity could get pretty thin along the way, and mark to markets could be shocking.
Be sure to consult with a local financial advisor to max out the state, county, and city tax benefits.
One question I always get asked at lunches, conferences, and lectures is what is going to happen to the budget deficit?
The short answer is that it disappears in 2018 with no change in current law, thanks to steady growth in tax revenues and no big new wars.
And Social Security? It will be fully funded by 2030, thanks to a huge demographic tailwind provided by the addition of 86 million Millennials to the tax rolls.
A bump up in US GDP growth from 2% to 4% during the 2020?s will also be a huge help, again, provided we don?t start any more wars.
It looks like I am going to be able to collect after all.
Without much movement in interest rates in 2016, you can expect the same for foreign currencies.
Last year, we saw never ending expectations of aggressive quantitative easing by foreign central banks, which never really showed. What we did get, was always disappointing.
The decade long bull market in the greenback continues, but not by much. You can forget about those dramatic double digit gains the dollar made against the Euro at the beginning of last year, which we absolutely nailed.
The fundamental play for the Japanese yen is still from the short side. But don?t expect movement until we see another new leg of quantitative easing from the Bank of Japan. It could be a long wait.
The problems in the Land of the Rising Sun are almost too numerous to count: the world?s highest debt to GDP ratio, a horrific demographic problem, flagging export competitiveness against neighboring China and South Korea, and the world?s lowest developed country economic growth rate.
The dramatic sell off we saw in the Japanese currency since December, 2012 is the beginning of what I believe will be a multi decade, move down. Look for ?130 to the dollar sometime in 2016, and ?150 further down the road.
I have many friends in Japan looking for an overshoot to ?200. Take every 3% pullback in the greenback as a gift to sell again.
With the US having the world?s strongest major economy, its central bank is, therefore, most likely to continue raising rates the fastest.
That translates into a strong dollar, as interest rate differentials are far and away the biggest decider of the direction in currencies. So the dollar will remain strong against the Australian and Canadian dollars as well.
For a sleeper, use the next plunge in emerging markets to buy the Chinese Yuan ETF (CYB) for your back book. Now that the Yuan is an IMF reserve currency, it has attained new respectability.
But don?t expect more than single digit returns. The Middle Kingdom will move heaven and earth in order to keep its appreciation modest to maintain their crucial export competitiveness.
There isn?t a strategist out there not giving thanks for not loading up on commodities in 2015, the preeminent investment disaster of the year. Those who did are now looking for jobs on Craig?s List.
It was another year of overwhelming supply meeting flagging demand, both in Europe and Asia. Blame China, the one big swing factor in the global commodity.
The Middle Kingdom is currently changing drivers of its economy, from foreign exports to domestic consumption. This will be a multi decade process, and they have $3.5 trillion in reserves to finance it.
It will still demand prodigious amounts of imported commodities, especially, oil, copper, iron ore, and coal, all of which we sell. But not as much as in the past. This trend ran head on into a decade long expansion of capacity by the industry.
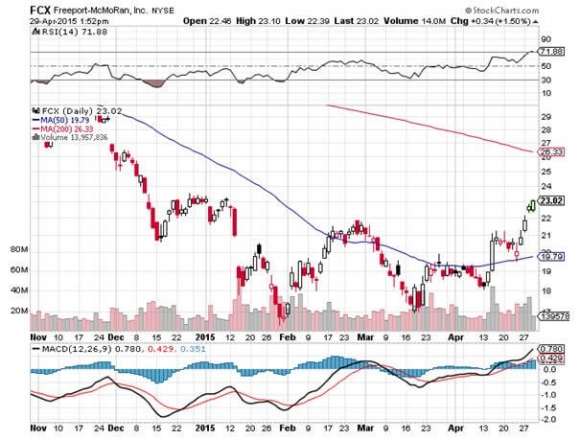
The derivative equity plays here, Freeport McMoRan (FCX) and Companhia Vale do Rio Doce (VALE), have all taken an absolute pasting.
The food commodities were certainly the asset class to forget about in 2015, as perfect weather conditions and over planting produced record crops for the second year in a row, demolishing prices. The associated equity plays took the swan dive with them.
Not even the arrival of one of the biggest El Nino events in history could bail them out.
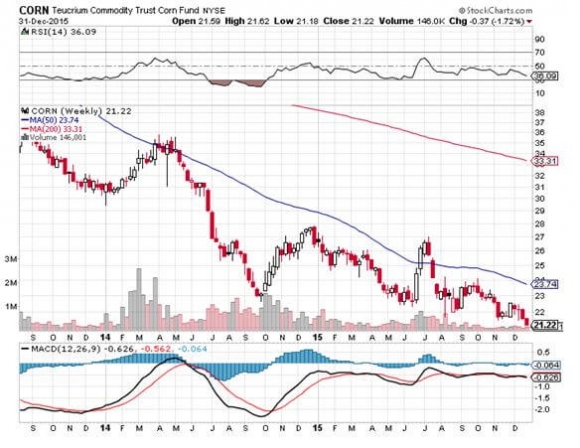
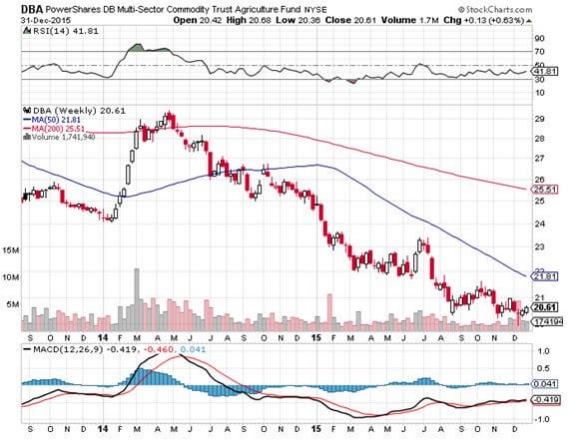
However, the ags are still a tremendous long term Malthusian play. The harsh reality here is that the world is making people faster than the food to feed them, the global population jumping from 7 billion to 9 billion by 2050.
Half of that increase comes in countries unable to feed themselves today, largely in the Middle East. The idea here is to use any substantial weakness, as we are seeing now, to build long positions that will double again if global warming returns in the summer, or if the Chinese get hungry.
The easy entry points here are with the corn (CORN), wheat (WEAT), and soybean (SOYB) ETF?s. You can also play through (MOO) and (DBA), and the stocks Mosaic (MOS), Monsanto (MON), Potash (POT), and Agrium (AGU).
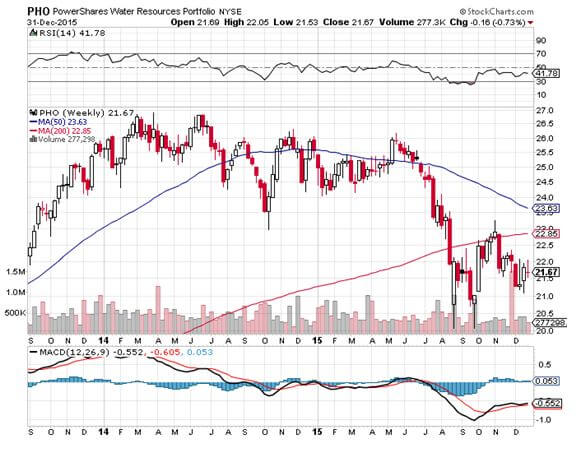
The grain ETF (JJG) is another handy fund. Though an unconventional commodity play, the impending shortage of water will make the energy crisis look like a cakewalk. You can participate in this most liquid of assets with the ETF?s (PHO) and (FIW).
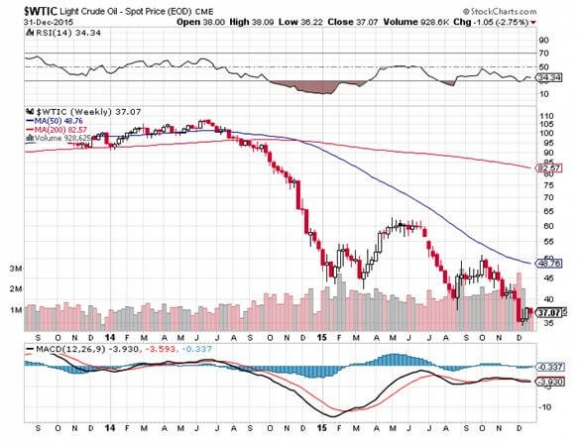
You are now an oil trader, even if you didn?t realize it. Yikes!
The short-term direction of the price of Texas tea will be the principal driver for the prices of all asset classes, as it was for the 2015.
The smartest thing I did in 2015 was to ignore the professional traders, who called the bottom in oil monthly, based on key technical levels.
Instead, I hung on every word uttered by my old drilling buddies in the Barnett Shale, who only saw endless supply.
Guess whom I?ll be paying attention to this year?
I expect oil to bottom in 2016, and then launch a ferocious short covering rally. But when and where is anyone?s guess.
If energy legends John Hamm, John Arnold, and T. Boone Pickens have no idea where the absolute low will be, who am I to second-guess them?
When that happens, a trillion dollars will pour out of the sidelines into this troubled sector. Energy shares should be top-performers in 2016.
That makes energy Master Limited Partnerships, now yielding 10%-15%, especially interesting in this low yield world. Since no one in the industry knows which issuers are going bankrupt, you have to take a basket approach and buy all of them.
The Alerian MLP ETF (AMLP) does this for you in an ETF format (click here for details). At its low this fund was down by 41% this year. The last printed annualized yield I saw was 10%. That kind of return will cover up a lot of sins. Our train has moved over to a siding to permit a freight train to pass, as it has priority on the Amtrak system. Three Burlington Northern engines are heaving to pull over 100 black, brand new tank cars, each carrying 30,000 gallons of oil from the fracking fields in North Dakota.
There is another tank car train right behind it. No wonder Warren Buffet tap dances to work every day, as he owns the railroad.
Who knew that a new, younger Saudi king would ramp up production to once unimaginable levels and crush prices, turning the energy world upside down?
They aren?t targeting American frackers, who at 1 million barrels a day in a 92 million barrel a day demand world barely move the needle. Their goal is to destroy the economies of enemies Iran, Yemen, Russia, and of course ISIS, which need high prices to stay in business.
So far, so good.
Cheaper energy will bestow new found competitiveness on US companies that will enable them to claw back millions of jobs from China in dozens of industries.
At current prices, the energy savings works out to an eye popping $550 per American driver per year!
This will end our structural unemployment faster than demographic realities would otherwise permit.
We have a major new factor this year in considering the price of energy. The nuclear deal with Iran promises to add 500,000 to 1 million barrels a day to an already glutted global market. Iraq is ramping up production as well.
We are also seeing relentless improvements on the energy conservation front with more electric vehicles, high mileage conventional cars, and newly efficient building. Anyone of these inputs is miniscule on its own. But add them all together and you have a game changer.
Enjoy cheap oil while it lasts because it won?t last forever. American rig counts are already falling off a cliff and will eventually engineer a price recovery.
As is always the case, the cure for low prices is low prices. But we may never see $100/barrel crude again.
Add to your long term portfolio (DIG), Exxon Mobil (XOM), Cheniere Energy (LNG), the energy sector ETF (XLE), Conoco Phillips (COP), and Occidental Petroleum (OXY).
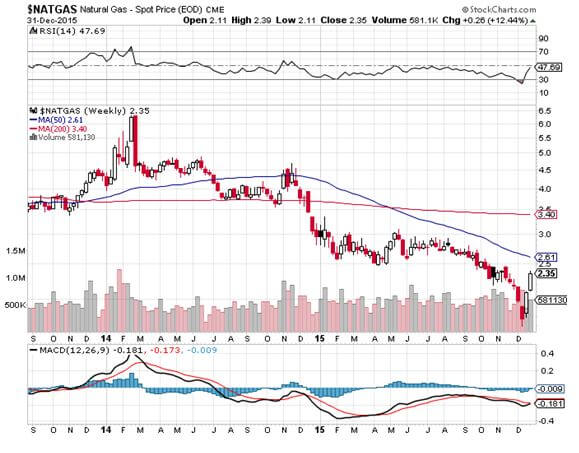
Skip natural gas (UNG) price plays and only go after volume plays, because the discovery of a new 100-year supply from ?fracking? and horizontal drilling in shale formations is going to overhang this subsector for a very long time.
It is a basic law of economics that cheaper prices bring greater demand and growing volumes, which have to be transported. However, major reforms are required in Washington before use of this molecule goes mainstream.
These could be your big trades of 2016, but expect to endure some pain first, nor to get much sleep at night.
The train has added extra engines at Denver, so now we may begin the long laboring climb up the Eastern slope of the Rocky Mountains.
On a steep curve, we pass along an antiquated freight train of hopper cars filled with large boulders. The porter tells me this train is welded to the tracks to create a windbreak. Once, a gust howled out of the pass so swiftly that it blew a train over on to its side.
In the snow filled canyons we sight a family of three moose, a huge herd of elk, and another group of wild mustangs. The engineer informs us that a rare bald eagle is flying along the left side of the train. It?s a good omen for the coming year.
We also see countless abandoned 19th century gold mines and the broken down wooden trestles leading to them, relics of previous precious metals busts. So it is timely here to speak about precious metals.
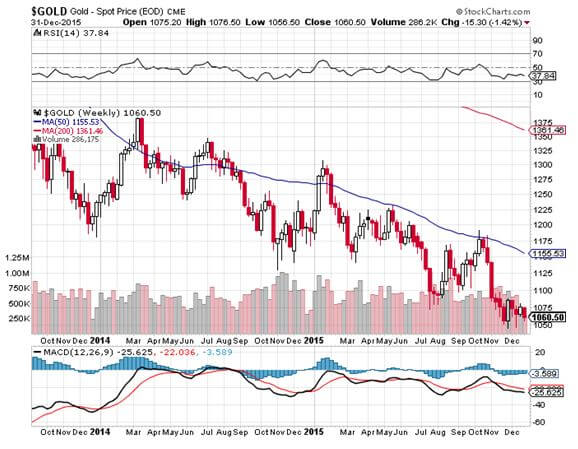
As long as the world is clamoring for paper assets like stocks and bonds, gold is just another shiny rock. After all, who needs an insurance policy if you are going to live forever?
We have already broken $1,040 once, and a test of $1,000 seems in the cards before a turnaround ensues. There are more hedge fund redemptions and stop losses to go. The bear case has the barbarous relic plunging all the way down to $700.
But the long-term bull case is still there. Gold is not dead; it is just resting.
If you forgot to buy gold at $35, $300, or $800, another entry point is setting up for those who, so far, have missed the gravy train. The precious metals have to work off a severely, decade old overbought condition before we make substantial new highs.
Remember, this is the asset class that takes the escalator up and the elevator down, and sometimes the window.
If the institutional world devotes just 5% of their assets to a weighting in gold, and an emerging market central bank bidding war for gold reserves continues, it has to fly to at least $2,300, the inflation adjusted all-time high, or more.
This is why emerging market central banks step in as large buyers every time we probe lower prices. China and India emerged as major buyers of gold in the final quarter of 2015.
They were joined by Russia, which was looking for non-dollar investments to dodge US economic and banking sanctions.
For me, that pegs the range for 2016 at $1,000-$1,250. ETF players can look at the 1X (GLD) or the 2X leveraged gold (DGP).
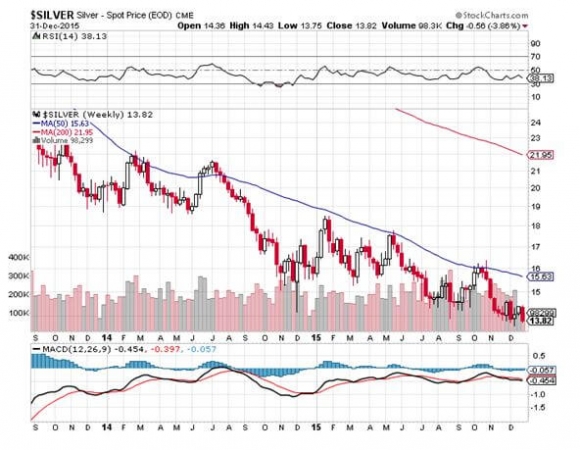
I would also be using the next bout of weakness to pick up the high beta, more volatile precious metal, silver (SLV), which I think could hit $50 once more, and eventually $100.
What will be the metals to own in 2015? Palladium (PALL) and platinum (PPLT), which have their own auto related long term fundamentals working on their behalf, would be something to consider on a dip.
With US auto production at 18 million units a year and climbing, up from a 9 million low in 2009, any inventory problems will easily get sorted out.
Would You Believe This is a Blue State?
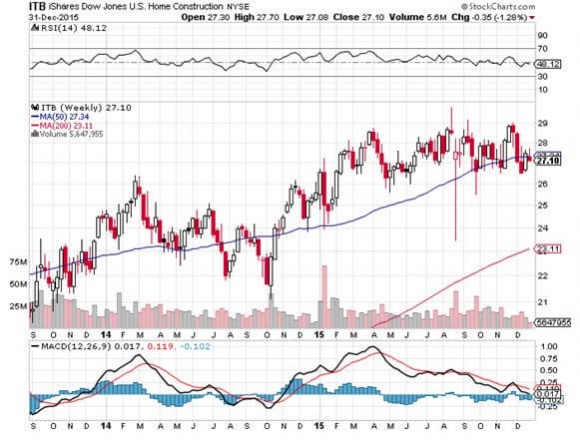
8) Real Estate (ITB)
The majestic snow covered Rocky Mountains are behind me. There is now a paucity of scenery, with the endless ocean of sagebrush and salt flats of Northern Nevada outside my window, so there is nothing else to do but write.
My apologies to readers in Wells, Elko, Battle Mountain, and Winnemucca, Nevada.
It is a route long traversed by roving banks of Indians, itinerant fur traders, the Pony Express, my own immigrant forebears in wagon trains, the transcontinental railroad, the Lincoln Highway, and finally US Interstate 80.
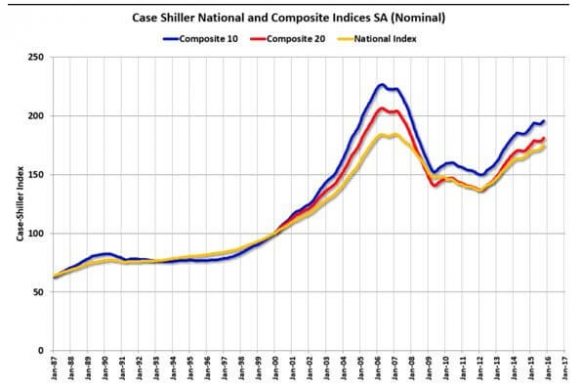
There is no doubt that there is a long-term recovery in real estate underway. We are probably 5 years into a 17-year run at the next peak in 2028.
But the big money has been made here over the past two years, with some red hot markets, like San Francisco, soaring. If you live within commuting distance of Apple (AAPL), Google (GOOG), or Facebook (FB) headquarters in California, you are looking at multiple offers, bidding wars, and prices at all time highs.
While the sales figures have recently been weak, it is a shortage of supply that is the cause. You can?t sell what you don?t have, at least in the real estate business.
From here on, I expect a slow grind up well into the 2020?s. If you live in the rest of the country, we are talking about small, single digit gains. The consequence of pernicious deflation is that home prices appreciate at a glacial pace.
At least, it has stopped going down, which has been great news for the financial industry.
There are only three numbers you need to know in the housing market for the next 20 years: there are 80 million baby boomers, 65 million Generation Xer?s who follow them, and 86 million in the generation after that, the Millennials.
The boomers have been unloading dwellings to the Gen Xer?s since prices peaked in 2007. But there are not enough of the latter, and three decades of falling real incomes mean that they only earn a fraction of what their parents made. That's what caused the financial crisis.
If they have prospered, banks won?t lend to them. Brokers used to say that their market was all about ?location, location, location?. Now it is ?financing, financing, financing?.
Banks have gone back to the old standard of only lending money to people who don?t need it. But expect to put up your first-born child as collateral, and bring in your entire extended family in as cosigners if you want to get a bank loan.?
There is a happy ending to this story. Millennials, now aged 21-37 are already starting to kick in as the dominant buyers in the market. They are just starting to transition from 30% to 70% of all new buyers in this market. The Great Millennial Migration to the suburbs has begun.
As a result, the price of single family homes should rocket tenfold during the 2020?s, as they did during the 1970?s and the 1990?s, when similar demographic influences were at play.
This will happen in the context of a coming labor shortfall and rising standards of living. Inflation returns.
Rising rents are accelerating this trend. Renters now pay 35% of the gross income, compared to only 18% for owners, and less when multiple deductions and tax subsidies are taken into account.
Remember too, that by then, the US will not have built any new houses in large numbers in 10 years. We are still operating at only a quarter of the peak rate. Thanks to the Great Recession, the construction of five million new homes has gone missing in action.
That makes a home purchase now particularly attractive for the long term, to live in, and not to speculate with.
You will boast to your grandchildren how little you paid for your house, as my grandparents once did to me ($18,000 for a four bedroom brownstone in Brooklyn in 1922).
Quite honestly, of all the asset classes mentioned in this report, purchasing your abode is probably the single best investment you can make now.
If you borrow at a 3% 5/1 ARM rate, and the long-term inflation rate is 3%, then over time you will get your house for free.
How hard is that to figure out?
Crossing the Bridge to Home Sweet Home
9) Postscript
We have pulled into the station at Truckee in the midst of a howling blizzard.
My loyal staff have made the 20 mile trek from my beachfront estate at Incline Village to welcome me to California with a couple of hot breakfast burritos and a chilled bottle of Dom Perignon Champagne, which has been resting in a nearby snowbank. I am thankfully spared from taking my last meal with Amtrak.
After that, it was over legendary Donner Pass, and then all downhill from the Sierras, across the Central Valley, and into the Sacramento River Delta.
Well, that?s all for now. We?ve just passed the Pacific mothball fleet moored in the Sacramento River Delta and we?re crossing the Benicia Bridge. The pressure increase caused by an 8,200 foot descent from Donner Pass has crushed my water bottle.
The Golden Gate Bridge and the soaring spire of the Transamerica Building are just around the next bend across San Francisco Bay.
A storm has blown through, leaving the air crystal clear and the bay as flat as glass. It is time for me to unplug my Macbook Pro and iPhone 6, pick up my various adapters, and pack up.
We arrive in Emeryville 45 minutes early. With any luck, I can squeeze in a ten mile night hike up Grizzly Peak and still get home in time to watch the opener for Downton Abbey's final season.
I reach the ridge just in time to catch a spectacular pastel sunset over the Pacific Ocean. The omens are there. It is going to be another good year.
I?ll shoot you a Trade Alert whenever I see a window open on any of the trades above.
Good trading in 2016!
John Thomas
The Mad Hedge Fund Trader
The Omens Are Good for 2016!
https://www.madhedgefundtrader.com/wp-content/uploads/2013/01/JT-at-work.jpg478635Mad Hedge Fund Traderhttps://madhedgefundtrader.com/wp-content/uploads/2019/05/cropped-mad-hedge-logo-transparent-192x192_f9578834168ba24df3eb53916a12c882.pngMad Hedge Fund Trader2016-01-05 01:05:382016-01-05 01:05:382016 Annual Asset Class Review
I think I have figured out the course of the global financial markets over the next few months.
We are currently transitioning from an economic data flow from Q1 that was very weak, to the second quarter, which will almost certainly deliver us a robust set of numbers. This is on the heels of a white hot Q1, 2014.
Hot, cold, hot; this is a trader?s dream come true, as it gives us the volatility we need to make a fortune, as we skillfully weave in and out of these gyrations.
That is, if you read the Diary of a Mad Hedge Fund Trader.
This is not a new thing. A weak Q1 has been a recurring event over the last 30 years. The anomaly has been so reliable that not a few traders have been able to earn a living from it. :) Heaven help us if the government ever tries to fix it.
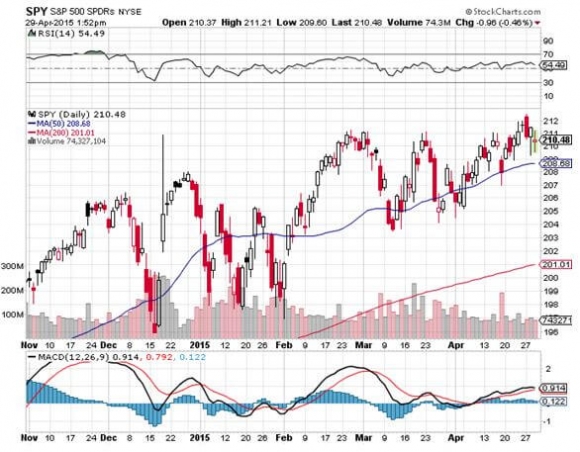
To further complicate matters, some markets see this, while others have yet to open their eyes.
The stock market (SPY), (QQQ), (IWM) agree with my view, probing new all time highs, while companies announce diabolical Q1 earnings (Twitter (TWTR)? Yikes!). So do commodities, like oil (USO) and copper (FCX), whose recent strength suggests we are on the doorstep of a great economic Golden Age.
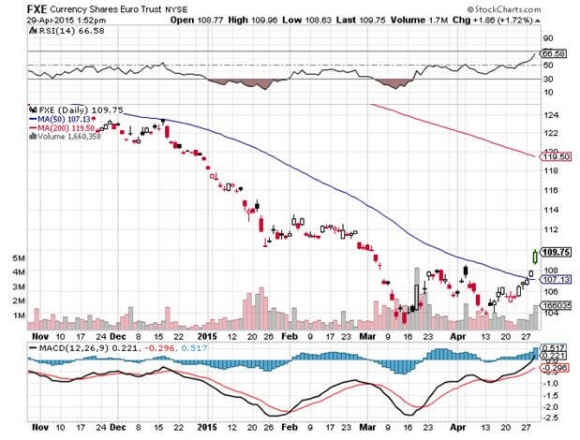
However, the foreign exchange market (FXE), (FXY) doesn?t see it this way. They can only comprehend the last data point that just crossed the tape.
If it is weak, they assume the Federal Reserve won?t even think about raising interest rates until well into 2016. If it is healthy, they bet the Fed will jack up rates tomorrow.
You might assume this is ridiculous, and you?d be right. However, forex traders live in a world where interest rate differentials are the principal, and to many the only driver of foreign exchange rates.
One market is right, and one is wrong. Did I mention that this is also a license for we nimble traders to print money?
Of course, you can play both side of the fence, as I do. That?s how I was able to coin it with a long position in the euro (a weak economy trade) the same day my long US equity portfolio (a strong economy trade) was going through the roof.
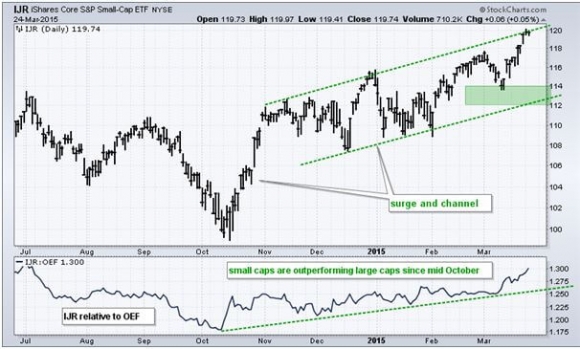
Let me give you another iteration of these scenarios. Inside the dollar correction we are seeing a pronounced sector rotation among US stocks.
Traders are moving out of small caps (IWM) that sheltered then from a strong dollar into large caps (SPY). They are also taking profits in biotech and rolling it into financials (GS), cyber security (PANW) and solar (TAN).
Goldman Sachs (GS) gave us more rocket fuel for the bull case for of American stocks this morning. The sage investment bank, in which my Trade Alert Service currently maintains a profitable long position, says that corporations will return a mind blowing $1 trillion to investors in 2015.
Share buy back from companies should rise by 18%, while dividends should pop by 7%. It is all a continuation of a six-year trend.
Apple (AAPL) certainly kicked off this quarter?s cavalcade of higher payouts on Monday, when it added $50 billion to its own stock repurchase program and jacked up its dividend by 11%.
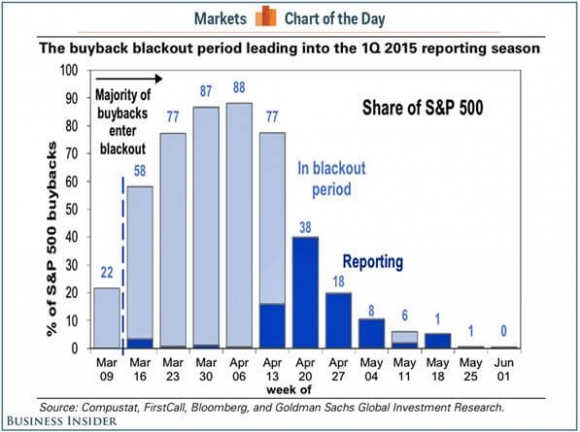
Markets could get even more interesting after next week, when some 80% of S&P 500 companies will have existed the ?black out? period when they are not allowed by SEC regulations to buy their own stock.
I say ?tally ho,? and ?tally ho? again.
It?s Tally Ho for the Stock Market
https://www.madhedgefundtrader.com/wp-content/uploads/2015/04/Fox-Hunt-e1430337987633.jpg256400Mad Hedge Fund Traderhttps://madhedgefundtrader.com/wp-content/uploads/2019/05/cropped-mad-hedge-logo-transparent-192x192_f9578834168ba24df3eb53916a12c882.pngMad Hedge Fund Trader2015-04-30 01:05:092015-04-30 01:05:09How the Markets Will Play Out This Quarter
I?ll let you in on my top secret investment strategy that has brought me blockbuster results over the past six years.
Listen to the Wharton Business School?s professor, Jeremy Siegel.
The good doctor has been unremittingly bullish year in and year out, nearly pegging the stock index performance annually.
So, when he says that the Dow Average is going to rise to 20,000 by the end of 2015, that?s good enough for me. In fact Siegel thinks that at current price earnings multiple of 17 times, the bull market has years to run.
It would not be until we hit nosebleed levels of 25X or 30X earnings that he would get worried. And the current ultra low level of interest might even make these high multiple numbers justifiable.
So for the foreseeable future, we are going to see long periods of tedious range trading, followed by frenetic rounds of buying, once the market decides that it is time to discount the next rise in corporate earnings.
We happen to be in one of those range-trading periods right now, which my partner, Mad Day Trader Jim Parker, thinks could last all the way until September.
Actually, it is a little more complicated than that.
There is good reason for the stock market to go to sleep over the next two weeks.
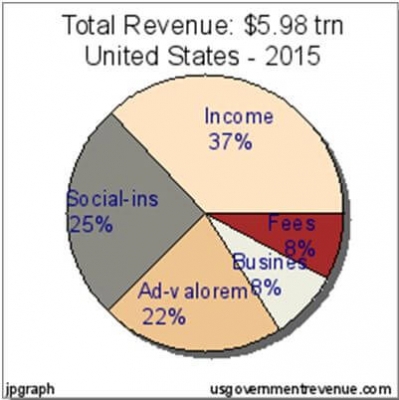
Do you hear that great sucking sound? That is the noise of 170 million tax payers writing checks to the US Internal Revenue Service.
Foreign readers may not realize this, but tax payments are due in the United States on April 15 every year. I would ask for your sympathy, but I know all of you pay far more in taxes than we do. I know, because I used to pay them myself when I lived abroad for 23 years.
Of the $6 trillion in revenues from all sources due to Uncle Sam in 2015, 37%, or $2.2 trillion will come in the form of individual income taxes. That is a big hit for the financial system. That means for the next two weeks there won?t be any extra money lying around to put into the stock market.
There is another reason why the stock indexes are stagnating here. The Q1, 2015 corporate earnings reporting season kicks off when Alcoa (AA) reports on April 8, or in six trading days. Until then, we are in the quiet period, and companies are not allowed the buy back their own stock.
This is a big deal, since companies buying back their own shares have provided major support for the stock market for many years. Possibly a quarter of all the net cash flow pouring into stocks since 2009 has come from this source.
Take it away, even for a short period, and the most bullish thing the market can do is move sideways, which is exactly what it has been doing for the past two months.
What happens when the tax payment deadline passes and the quiet period ends? Stocks take off like a bat out of hell. That will take us to the spring interim peak.
This is why I strapped on three new ?RISK ON? positions last Friday, longs in the Russell 2000 (IWM) and Goldman Sachs (GS) and a short in the euro (FXE).
https://www.madhedgefundtrader.com/wp-content/uploads/2015/03/Shhhh-e1427748076919.jpg300400Mad Hedge Fund Traderhttps://madhedgefundtrader.com/wp-content/uploads/2019/05/cropped-mad-hedge-logo-transparent-192x192_f9578834168ba24df3eb53916a12c882.pngMad Hedge Fund Trader2015-03-31 01:04:342015-03-31 01:04:34Entering the Quiet Time
We have several options positions that expire on Friday, and I just want to explain to the newbies how to best maximize their profits.
These include:
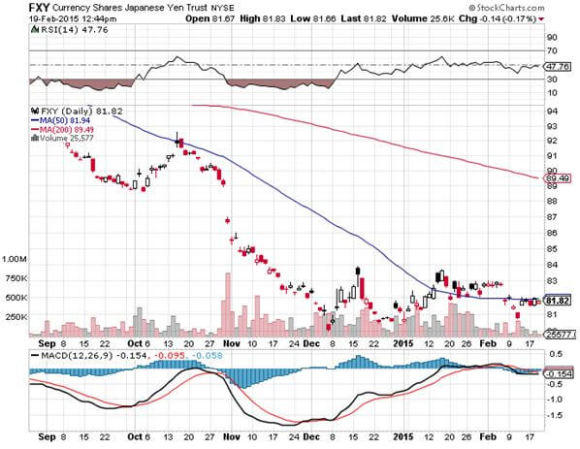
The Currency Shares Japanese Yen Trust (FXY) February $84-$87 vertical bear put spread
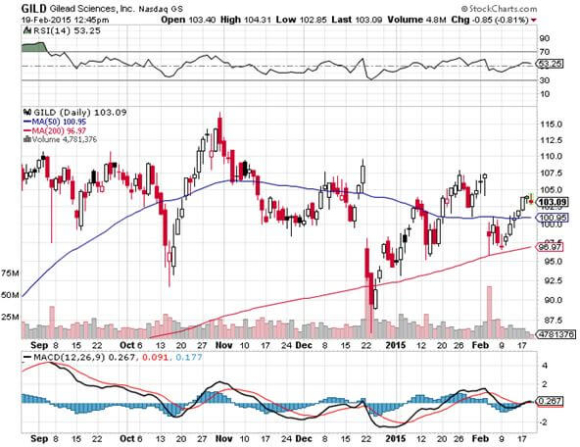
The Gilead Sciences (GILD) February $87.50-$92.50 vertical bull call spread
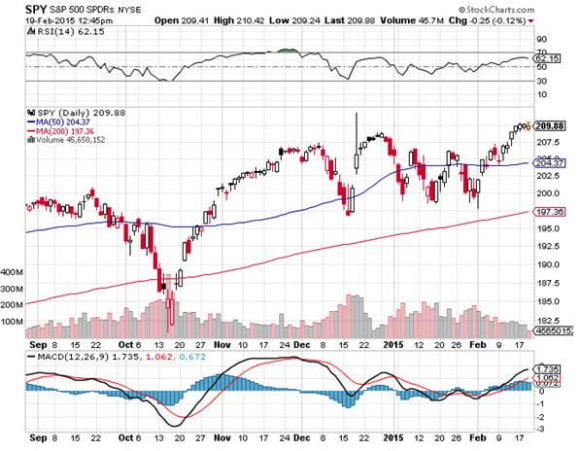
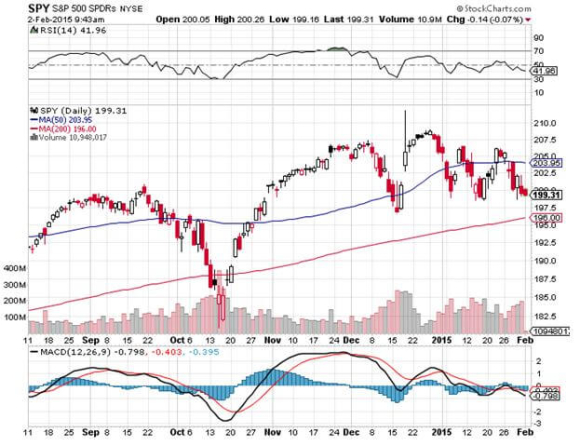
The S&P 500 (SPY) February $199-$202 vertical bull call spread
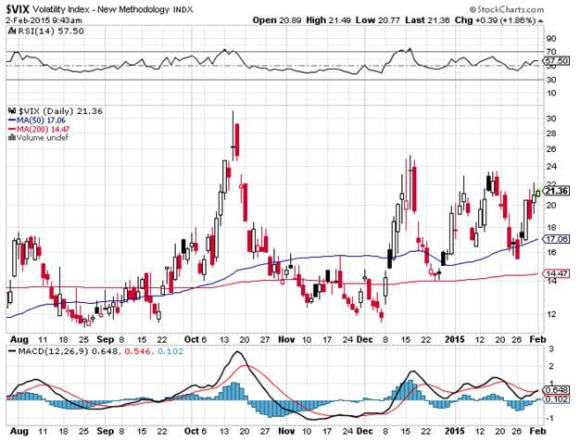
My bets that (GILD) and the (SPY) would rise, and that the (FXY) would fall during January and February proved dead on accurate. We got a further kicker with the two stock positions in that we captured a dramatic plunge in volatility (VIX).
Provided that some 9/11 type event doesn?t occur today, all three positions should expire at their maximum profit point. In that case, your profits on these positions will amount to 13% for the (FXY), 19% for (GILD) and 20% for the (SPY).
This will bring us a fabulous 5.58% profit so far for February, and a market beating 6.11% for year-to-date 2015.
Many of you have already emailed me asking what to do with these winning positions. The answer is very simple. You take your left hand, grab your right wrist, pull it behind your neck and pat yourself on the back for a job well done. You don?t have to do anything.
Your broker (are they still called that?) will automatically use your long put position to cover the short put position, cancelling out the total holding. Ditto for the call spreads. The profit will be credited to your account on Monday morning, and he margin freed up.
If you don?t see the cash show up in you account on Monday, get on the blower immediately. Although the expiration process is now supposed to be fully automated, occasionally mistakes do occur. Better to sort out any confusion before losses ensue.
I don?t usually run positions into expiration like this, preferring to take profits two weeks ahead of time, as the risk reward is no longer that favorable.
But we have a ton of cash right now, and I don?t see any other great entry points for the moment. Better to keep the cash working and duck the double commissions. This time being a pig paid off handsomely.
If you want to wimp out and close the position before the expiration, it may be expensive to do so. Keep in mind that the liquidity in the options market disappears, and the spreads substantially widen, when a security has only hours, or minutes until expiration. This is known in the trade as the ?expiration risk.?
One way or the other, I?m sure you?ll do OK, as long as I am looking over your shoulder, as I will be.
This expiration will leave me with a very rare 100% cash position. I am going to hang back and wait for good entry points before jumping back in. It?s all about getting that ?buy low, sell high? thing going again.
There are already interesting trades setting up in bonds (TLT), the (SPY), the Russell 2000 (IWM), NASDAQ (QQQ), solar stocks (SCTY), oil (USO), and gold (GLD).
The currencies seem to have gone dead for the time being, so I?ll stay away.
Well done, and on to the next trade.
Pat Yourself on the Back
https://www.madhedgefundtrader.com/wp-content/uploads/2015/02/Pat-on-the-back-e1424375419249.jpg259400Mad Hedge Fund Traderhttps://madhedgefundtrader.com/wp-content/uploads/2019/05/cropped-mad-hedge-logo-transparent-192x192_f9578834168ba24df3eb53916a12c882.pngMad Hedge Fund Trader2015-02-20 01:04:322015-02-20 01:04:32A Note on the Friday Options Expiration
Investors around the world have been confused, befuddled and surprised by the persistent, ultra low level of long term interest rates in the United States.
At today?s close, the 30 year Treasury bond yielded a parsimonious 2.01%, the ten year, 2.62%, and the five year only 1.51%. The ten-year was threatening its all time low yield of 1.37% only two weeks ago, a return as rare as a dodo bird, last seen in August, 2012.
What?s more, yields across the entire fixed income spectrum have been plumbing new lows. Corporate bonds (LQD) have been fetching only 3.29%, tax-free municipal bonds (MUB) 2.89%, and junk (JNK) a pittance at 5.96%.
Spreads over Treasuries are approaching new all time lows. The spread for junk over of ten year Treasuries is now below an amazing 3.00%, a heady number not seen since the 2007 bubble top. ?Covenant light? in borrower terms is making a big comeback.
Are investors being rewarded for taking on the debt of companies that are on the edge of bankruptcy, a tiny 3.3% premium? I think not.
It is a global trend.
German bunds are now paying holders 0.35%, and JGB?s are at an eye popping 0.30%. The worst quality southern European paper has delivered the biggest rallies this year. Portuguese government paper is paying only 2.40%, and is rapidly closing in on US government yields.
Yikes!
These numbers indicate that there is a massive global capital glut. There is too much money chasing too few low risk investments everywhere. Has the world suddenly become risk averse? Is inflation gone forever? Will deflation become a permanent aspect of our investing lives? Does the reach for yield know no bounds?
It wasn?t supposed to be like this.
Almost to a man, hedge fund managers everywhere were unloading debt instruments in January. They were looking for a year of rising interest rates (TLT), accelerating stock prices (QQQ), falling commodities (DBA), and dying emerging markets (EEM). Surging capital inflows were supposed to prompt the dollar (UUP) to take off like a rocket.
It all ended up being almost a perfect mirror image portfolio of what actually transpired since then. As a result, almost all mutual funds are down so far in 2014. Many hedge fund managers are tearing their hair out, suffering their worst year in recent memory.
What is wrong with this picture?
Interest rates like these are hinting that the global economy is about to endure a serious nose dive, possibly even re-entering recession territory?or it isn?t.
To understand why not, we have to delve into deep structural issues, which are changing the nature of the debt markets beyond all recognition. This is not your father?s bond market.
I?ll start with what I call the ?1% effect.?
Rich people are different than you and I. Once they finally make their billions, they quickly evolve from being risk takers into wealth preservers. They don?t invest in start-ups, take fliers on stock tips, invest in the flavor of the day, or create jobs. In fact, many abandon shares completely, retreating to the safety of coupon clipping.
The problem for the rest of us is that this capital stagnates. It goes into the bond market where it stays forever. These people never sell, thus avoiding capital gains taxes and capturing a future step up in the cost basis whenever a spouse dies. Only the interest payments are taxable and that at a lowly 20% rate.
This is the lesson I learned from servicing generations of Rothschild?s, Du Ponts, Rockefellers, and Getty. Extremely wealthy families stay that way by becoming extremely conservative investors. Those that don?t, you?ve never heard of, because they all eventually went broke.
This didn?t used to mean much before 1980, back when the wealthy only owned 10% of the bond market, except to financial historians and private wealth specialists, of which I am one. Now they own a whopping 23%, and their behavior affects everyone.
Who has bee the largest buyer of Treasury bonds for the last 30 years? Foreign central banks and other governmental entities, which count them among their country?s foreign exchange reserves. They own 36% of our national debt, with China in the lead at 8% (the Bush tax cut that was borrowed), and Japan close behind with 7% (the Reagan tax cut that was borrowed). These days they purchase about 50% of every Treasury auction.
They never sell either, unless there is some kind of foreign exchange or balance of payments crisis, which is rare. If anything, these holdings are still growing.
Who else has been soaking up bonds, deaf to repeated cries that prices are about to plunge? The Federal Reserve, which thanks to QE1, 2, and 3, now owns 22% of our $17 trillion debt. Both the former Federal Reserve governor Ben Bernanke, and the present one, Janet Yellen, have made clear they have no plans to sell these bonds. They will run them to maturity instead, minimizing the market impact.
An assortment of other government entities possess a further 29% of US government bonds, first and foremost the Social Security Administration, with a 16% holding. And they ain?t selling either, baby.
So what you have here is the overwhelming majority of Treasury bond owners with no intention to sell. Only hedge funds have been selling this year, and they have already done so, in spades.
Which sets up a frightening possibility for them, now that we are at the very bottom of the past year?s range in yields. What happens if bond yields fall further? It will set off the mother of all short covering squeezes and could take ten-year yield down to match the 2012, 2.38% low.
Fasten your seat belts, batten the hatches, and down the Dramamine!
There are a few other reasons why rates will stay at subterranean levels for some time. If hyper accelerating technology keeps cutting costs for the rest of the century, deflation basically never goes away (click here?for ?Peeking into the Future with Ray Kurzweil?).
Hyper accelerating corporate profits will also create a global cash glut, further levitating bond prices. Companies are becoming so profitable they are throwing off more cash then they can reasonably use or pay out.
This is why these gigantic corporate cash hoards are piling up in Europe in tax free jurisdictions, now over $2 trillion. Is the US heading for Japanese style yields, or 0.39% for 10 year Treasuries?
If so, bonds are a steal here at 2.55%. If we really do enter a period of long term -2% a year deflation, that means the purchasing power of a dollar increases by 35% every decade in real terms.
The threat of a second Cold War is keeping the flight to safety bid alive, and keeping the bull market for bonds percolating. This could put a floor under bond prices for another decade, and Vladimir Putin?s current presidential run could last all the way under 2014.
All of this is why I?m out of the bond market for now, and will remain so for a while.
Why Are They So Low?
https://www.madhedgefundtrader.com/wp-content/uploads/2014/05/Orangutan.jpg346382Mad Hedge Fund Traderhttps://madhedgefundtrader.com/wp-content/uploads/2019/05/cropped-mad-hedge-logo-transparent-192x192_f9578834168ba24df3eb53916a12c882.pngMad Hedge Fund Trader2015-02-16 01:05:282015-02-16 01:05:28Why Are Bond Yields So Low?
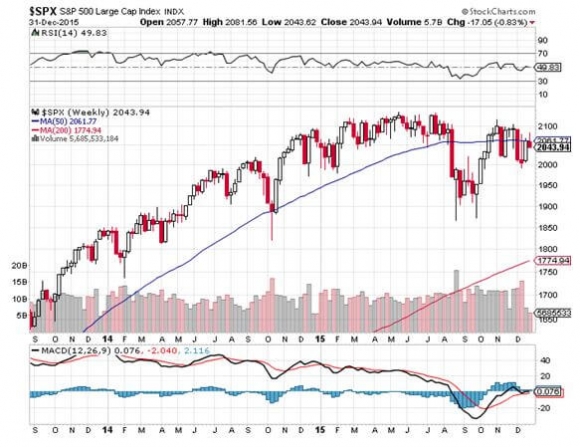
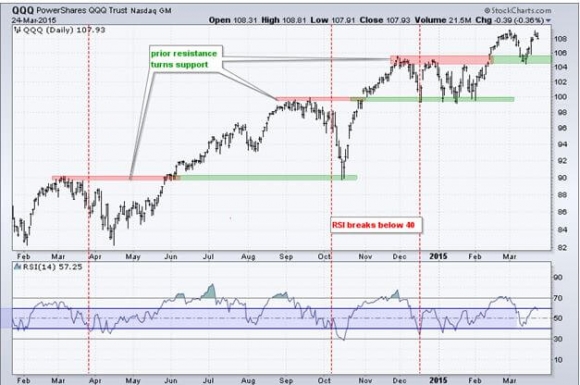
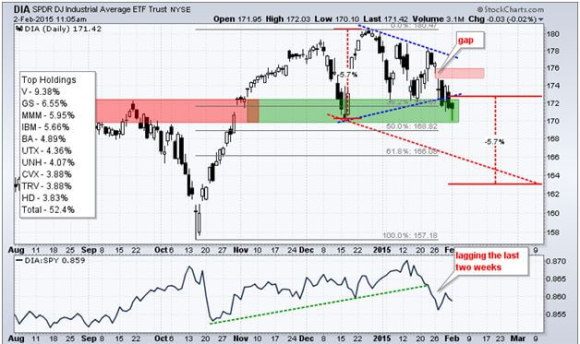
At yesterday morning?s opening bell, we were greeted with the unmistakable evidence the stock market is technically breaking down.
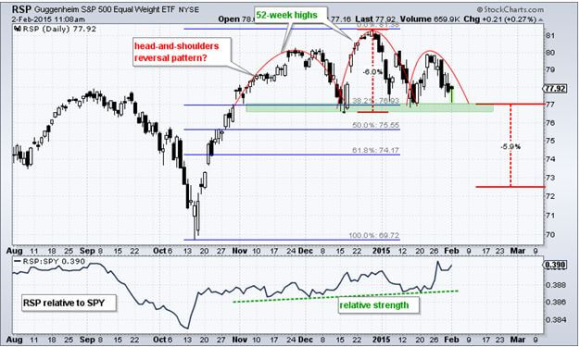
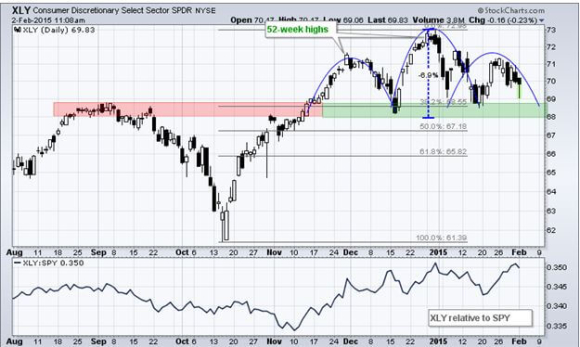
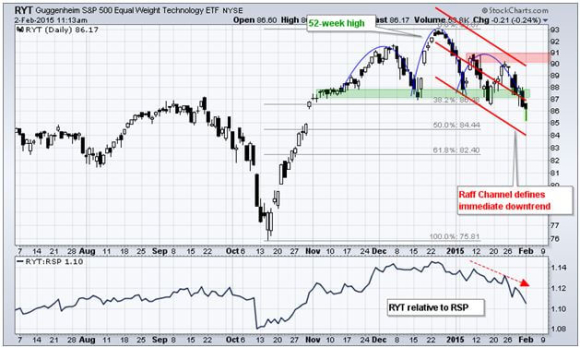
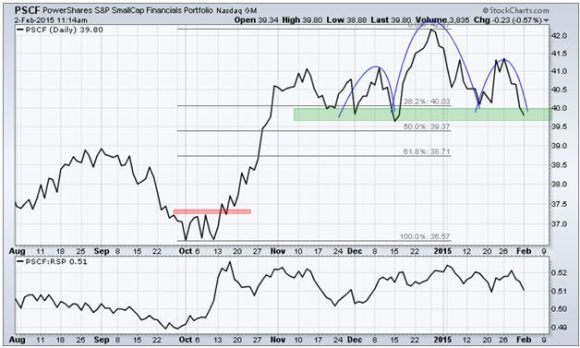
The Dow Average has broken its three-year upward sloping trend line. Market leading sectors, like Consumer Discretionary and Financials have all put in eminently convincing ?Head and Shoulders? tops (click here). More distressingly, the head and shoulders for lead sector Technology has already broken down. Check out all the charts below.
I quickly ran my expiration P&L this morning. I figured out that if I sold all my longs for small profits (SPY), (IWM), and kept all my short positions (FXY), (T), (AA), I would be up 4.43% year to date by mid February, which in this environment is nothing less than heroic. The exception to the analysis is my sale of Linn Energy (LINE), which will be the subject of my next piece.
For more detail on why this is happening, read today?s letter, ?The Great American Rot is Ending? by clicking here).
Time to Bail
https://www.madhedgefundtrader.com/wp-content/uploads/2015/02/Skydiver-e1422906198890.jpg253400Mad Hedge Fund Traderhttps://madhedgefundtrader.com/wp-content/uploads/2019/05/cropped-mad-hedge-logo-transparent-192x192_f9578834168ba24df3eb53916a12c882.pngMad Hedge Fund Trader2015-02-03 01:04:522015-02-03 01:04:52The Market?s Technical Outlook is Terrible
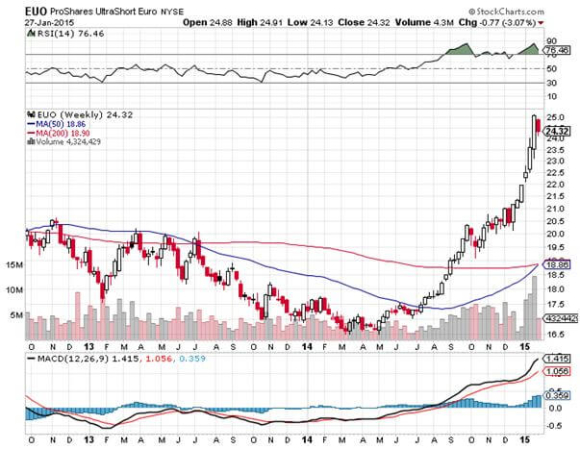
For those of you who heeded my expert advice to buy the ProShares Ultra Short Euro ETF (EUO) last July, well done!
You are up a massive 48%! This is on a move in the underlying European currency of only 18.5%.
My browsing of the Galleria in Milan, the strolls through Spanish shopping malls, and my dickering with an assortment of dubious Greek merchants, all paid off big time. It turns out that everything I predicted for this beleaguered currency came true.
The European economy did collapse. Cantankerous governments made the problem worse by squabbling, delaying and obfuscating, as usual.
The European Central Bank finally threw in the towel and did everything they could to collapse the value of the Euro and reinvigorate their comatose economies. This they did by imitating America?s wildly successful quantitative easing, which they announced with local variations last Thursday.
And now for the good news: The best is yet to come!
Europe is now six days into a strategy of aggressive monetary easing which may take as long as five years until it delivers tangible, sustainable results. That?s how long it took for the Federal Reserve?s QE to restore satisfactory levels of confidence in the US economy.
The net net is that we have almost certainly only seen the first act of a weakening of the Euro which may last for years. A short Euro could be the trade that keeps on giving.
The ECB?s own target now is obviously parity against the greenback, which you will find predicted in my own 2015 Annual Asset Class Review released at the beginning of January (click here).
Once they hit that target, 87 cents to the Euro will become the new goal, and that could be achieved sooner than later.
However, you will not find me short the Euro up the wazoo this minute. I think we have just stumbled into a classic ?Buy the Rumor, Sell the News? situation with the Euro.
The next act will involve the ECB sitting on its hands for a year, realizing that their first pass at QE was inadequate, superficial, and flaccid, and that it is time to pull the bazooka out of their pockets once again.
This is a problem when the entire investment world is short the Euro. That paves the way for countless, rip your face off short covering rallies in the months ahead. Any smidgeon or blip of positive European economic data could spark one of these.
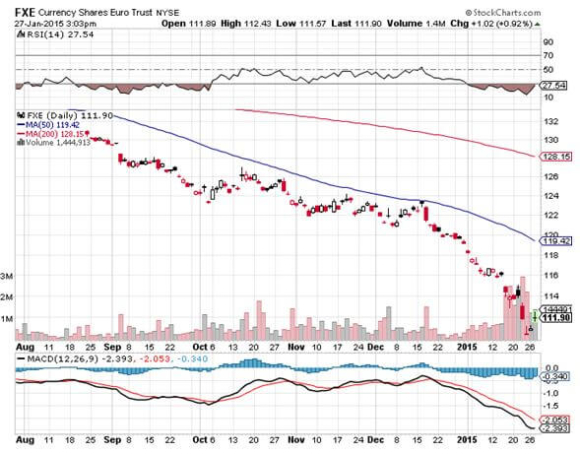
Trading the Euro for the past eight months has been like falling off a log. It is about to get dull, mean and brutish. So for the moment, my currency play has morphed into selling short the Japanese yen, which has its own unique set of problems.
As for the unintended consequences of the Euro crash, the Q4 earnings reports announced so far by corporate America tells the whole story.
Companies with a heavy dependence on foreign (read Euro and yen) denominated earnings are almost universally coming up short. On this list you can include Caterpillar (CAT), Procter and Gamble (PG), and Microsoft (MSFT).
Who are the winners in the strong dollar, weak Euro contest? US companies that see a high proportion of their costs denominated in flagging foreign currencies, but see their incomes arrive totally in the form of robust, virile dollars.
You may not realize it, but you are playing the global currency arbitrage game every time you go shopping. The standout names here are US retailers, which manufacture abroad virtually all of the junk they sell you here, especially in low waged China.
The stars here are Macy?s (M), Family Dollar Stores (FDO), Costco (COST), Target (TGT), and Wal-Mart (WMT).
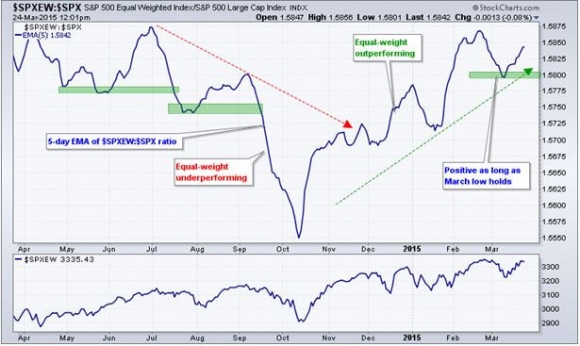
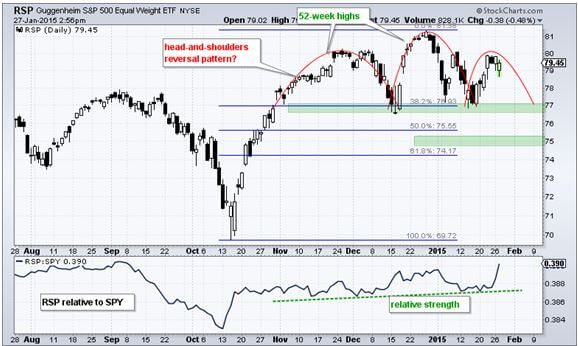
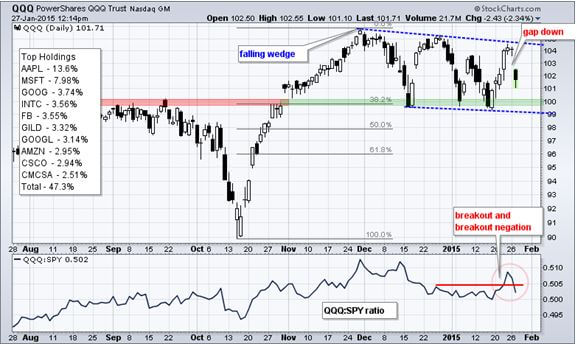
You can see this divergence crystal clear in examining the behavior of the major stock indexes. The chart for the Guggenheim S&P 500 Equal Weight ETF (RSP), which has the greatest share of currency sensitive multinationals, looks positively dire, and may be about to put in a fatal ?Head and Shoulders? top (see the following story).
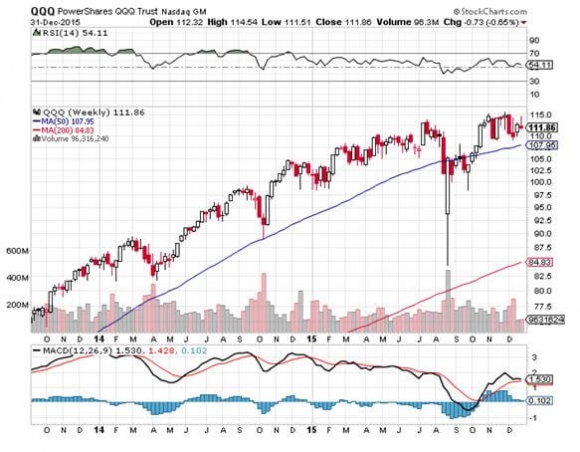
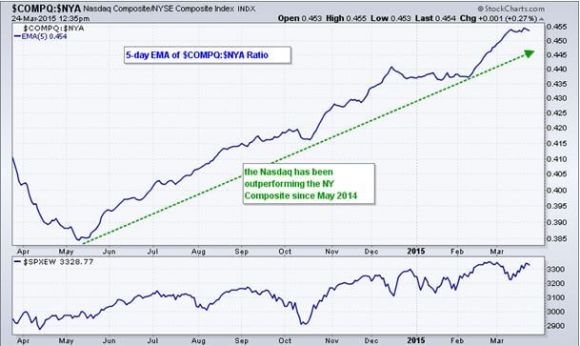
The chart for the NASDAQ (QQQ), where constituent companies have less, but still a substantial foreign currency exposure, appears to be putting in a sideways pennant formation before eventually breaking out to new highs once again.
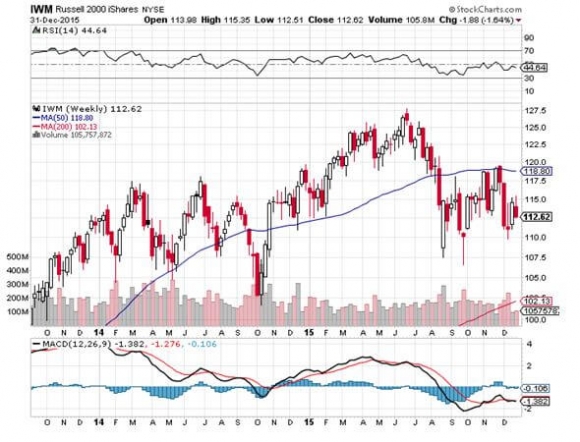
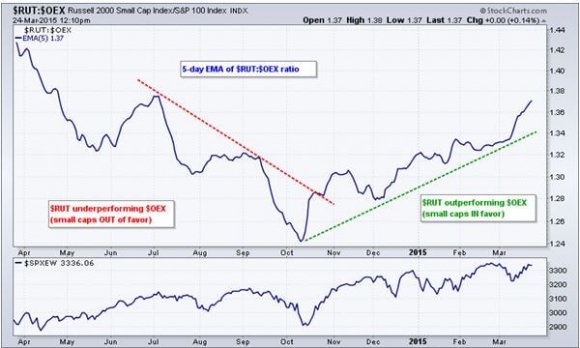
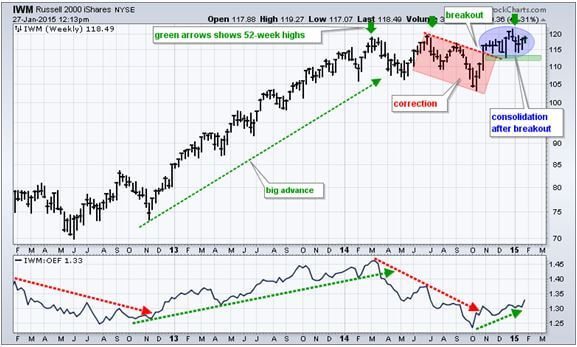
The small cap Russell 2000, which is composed of almost entirely domestic, dollar based, ?Made in America? type companies, is by far the strongest index of the trio, and looks like it is just biding time before it blasts through to new highs.
If you are a follower of my Trade Alert Service, then you already know that I have a long position in the (IWM), which has already chipped in 2.12% to my 2015 performance.
You see, there is a method to my Madness.
Never Underestimate the Value of Research
https://www.madhedgefundtrader.com/wp-content/uploads/2015/01/John-Thomas1-e1422462857973.jpg302400Mad Hedge Fund Traderhttps://madhedgefundtrader.com/wp-content/uploads/2019/05/cropped-mad-hedge-logo-transparent-192x192_f9578834168ba24df3eb53916a12c882.pngMad Hedge Fund Trader2015-01-28 11:35:022015-01-28 11:35:02The Unintended Consequences of the Euro Crash
Legal Disclaimer
There is a very high degree of risk involved in trading. Past results are not indicative of future returns. MadHedgeFundTrader.com and all individuals affiliated with this site assume no responsibilities for your trading and investment results. The indicators, strategies, columns, articles and all other features are for educational purposes only and should not be construed as investment advice. Information for futures trading observations are obtained from sources believed to be reliable, but we do not warrant its completeness or accuracy, or warrant any results from the use of the information. Your use of the trading observations is entirely at your own risk and it is your sole responsibility to evaluate the accuracy, completeness and usefulness of the information. You must assess the risk of any trade with your broker and make your own independent decisions regarding any securities mentioned herein. Affiliates of MadHedgeFundTrader.com may have a position or effect transactions in the securities described herein (or options thereon) and/or otherwise employ trading strategies that may be consistent or inconsistent with the provided strategies.