Below please find subscribers' Q&A for the Mad Hedge Fund Trader April Global Strategy Webinar with my guest co-host Bill Davis of the Mad Day Trader.
As usual, every asset class long and short was covered. You are certainly an inquisitive lot, and keep those questions coming!
Q: Many of your April positions are now profitable. Is there any reason to close out before expiration?
A: No one ever got fired for taking a profit. If you feel like you have enough in hand - like 50% of the maximum potential profit in the position, which we do have in more than half of our current positions - go ahead and take it.
I'll probably run all of our April expirations into expiration day because they are very deep in the money. Also, because of the higher volatility and because of higher implied volatility on individual stock options, you're being paid a lot more to run these into expiration than you ever have been before, so that is another benefit.
Of course, one good reason to take profits now is to roll into another position, and when we find them, that may be exactly what we do.
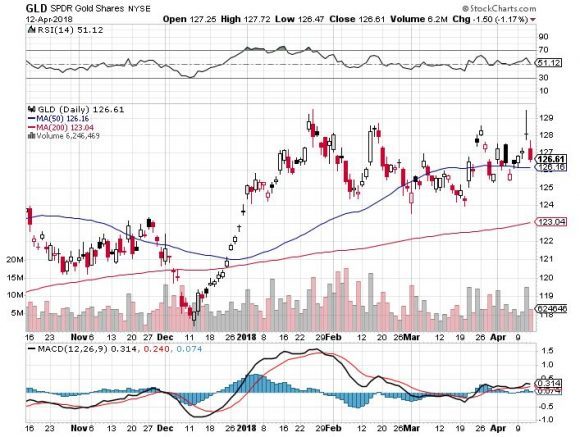
Q: What do you think will be the impact of the US hitting Syria with missiles?
A: Initially, probably a 3-, 4-, or 500-point drop, and then a very rapid recovery. While the Russians have threatened to shoot down our missiles, in actual fact they can't hit the broad side of a barn. When Russians fired their cruise missiles at Syrian targets, half of them landed in Iran.
At the end of the day, it doesn't really impact the US economy, but you will see a big move in gold, which we're already starting to see, and which is why we're long in gold - as a hedge against all our other positions against this kind of geopolitical event.
Q: Will 2018 be a bull market or a bear market?
A: We are still in a bull market, but we may see only half the returns of last year - in other words we'll get a 10% profit in stocks this year instead of a 20% profit, which means it has to rise 12% from here to hit that 10% up by year-end.
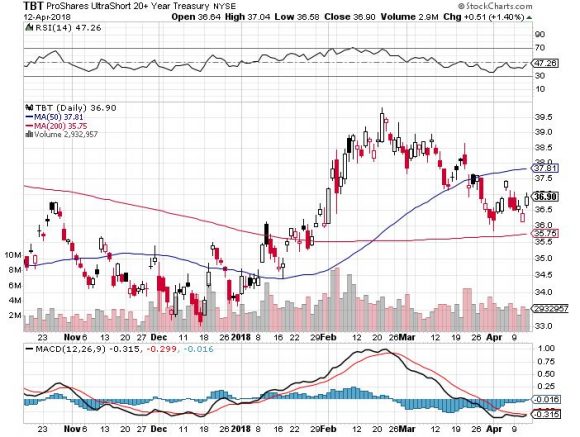
Q: What is your take on the ProShares Ultra Short 20+ Year Treasury Bond Fund (TBT)?
A: I am a big buyer here. I think that interest rates (TLT) are going to move down sharply for the rest of the year. The (TBT) here, in the mid $30s, is a great entry point - I would be buying it right now.
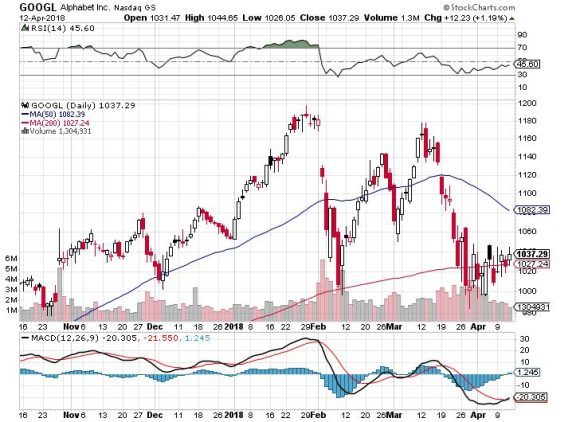
Q: How do you expect Google (GOOGL) to trade when the spread is so wide?
A: It will go up. Google is probably the best-quality technology company in the market, after Facebook (FB). We'll get some money moving out of Facebook into Google for exactly that reason; Google is Facebook without the political risk, the regulatory risk, and the security risks.
Q: Are any positions still a buy now?
A: All of them are buys now. But, do not chase the market on any conditions whatsoever. The market has an endless supply of sudden shocks coming out of Washington, which will give you that down-400-points-day. That is the day you jump in and buy. When you're buying on a 400-down-day, the risk reward is much better than buying on a 400-point up day.
Q: What is "sell in May and go away?"
A: It means take profits in all your positions in May when markets start to face historical headwinds for six months and either A) Wait for another major crash in the market (at the very least we'll get another test of the bottom of the recent range), or B) Just stay away completely; go spend all the money you made in the first half of 2018.
Q: Paul Ryan (the Republican Speaker of the House) resigned today; is he setting up for a presidential run against Trump in 2020?
A: I would say yes. Paul Ryan has been on the short list of presidential candidates for a long time. And Ryan may also be looking to leave Washington before the new Robert Mueller situation gets really unpleasant.
Q: What reaction do you expect if Trump resigns or is impeached?
A: I have Watergate to look back to; the stock market sold off 45% going into the Nixon resignation. It's a different world now, and there were a lot more things going wrong with the US economy in 1975 than there are now, like oil shocks, Vietnam, race riots, and recessions.
I would expect to get a decline, much less than that - maybe only a couple 1,000 points (or 10% or so), and then a strong Snapback Rally after that. We, in effect, have been discounting a Trump impeachment ever since he got in office. Thus far, the market has ignored it; now it's ignoring it a lot less.
Q: Thoughts on Micron Technology (MU), Lam Research (LRCX), and Nvidia (NVDA)?
A: It's all the same story: a UBS analyst who had never covered the chip sector before initiated coverage and issued a negative report on Micron Technology, which triggered a 10% sell-off in Micron, and 5% drops in every other chip company.
He took down maybe 20 different stocks based on the argument that the historically volatile chip cycle is ending now, and prices will fall through the end of the year. I think UBS is completely wrong, that the chip cycle has another 6 to 12 months to go before prices weaken.
All the research we've done through the Mad Hedge Technology Letter shows that UBS is entirely off base and that prices still remain quite strong. The chip shortage still lives! That makes the entire chip sector a buy here.
Q: Can Trump bring an antitrust action against Amazon?
A: No, no chance whatsoever. It is all political bluff. If you look at any definition of antitrust, is the consumer being harmed by Amazon (AMZN)?
Absolutely not - if they're getting the lowest prices and they're getting products delivered to their door for free, the consumer is not being harmed by lower prices.
Second is market share; normally, antitrust cases are brought when market shares get up to 70 or 80%. That's what we had with Microsoft (MSFT) in the 1990s and IBM (IBM) in the 1980s. The largest share Amazon has in any single market is 4%, so no there is basis whatsoever.
By the way, no president has ever attacked a private company on a daily basis for personal reasons like this one. Thank the president for giving us a great entry point for a stock that has basically gone up every day for two years. It's a rare opportunity.
Q: How will the trade war end?
A: I think the model for the China trade war is the US steel tariffs, where we announced tariffs against the entire world, and then exempted 75% of the world, declaring victory. That's exactly what's going to happen with China: We'll announce massive tariffs, do nothing for a while, and then negotiate modest token tariffs within a few areas. The US will declare victory, and the stock market rallies 2,000 points. That's why I have been adding risk almost every day for the last two weeks.
Q: Would you be buying ExonMobil (XOM) here, hoping for an oil breakout?
A: No, I think it's much more likely that oil is peaking out here, especially given the slowing economic data and a huge onslaught in supply from US fracking. We're getting big increases now in fracking numbers - that is very bad for prices a couple of months out. The only reason oil is this high is because Iran-sponsored Houthi rebels have been firing missiles at Saudi Arabia, which are completely harmless. In the old days, this would have caused oil to spike $50.
Q: Would you be selling stock into the rally (SPY), (QQQ)?
A: Not yet. I think the market has more to go on the upside, but you can still expect a lot of inter-day volatility depending on what comes out of Washington.
Q: Do you ever use stops on your option spreads?
A: I use mental stops. They don't take stop losses on call spreads and put spreads, and if they did they would absolutely take you to the cleaners. These are positions you never want to execute on market orders, which is what stop losses do. You always want to be working the middle of the spread. So, I use my mental stop. And when we do send out stop loss trade alerts, that's exactly where they're coming from.
Q: Will the Middle East uncertainty raise the price of oil?
A: Yes, if the Cold War with Iran turns hot, you could expect oil to go up $10 or $20 dollars higher, fairly quickly, regardless of what the fundamentals are. It's tough to be blowing up oil supplies as a great push on oil prices. But that's a big "if."
Hello from the Italian Riviera!
https://www.madhedgefundtrader.com/wp-content/uploads/2018/04/John-Italian-Riviera-story-2-image-4-e1523567901524.jpg225300MHFTRhttps://madhedgefundtrader.com/wp-content/uploads/2019/05/cropped-mad-hedge-logo-transparent-192x192_f9578834168ba24df3eb53916a12c882.pngMHFTR2018-04-13 01:06:552018-04-13 01:06:55April 11 Global Strategy Webinar Q&A
Featured Trade:
(MARKET OUTLOOK FOR THE WEEK AHEAD, or GOODBYE THE QUARTER FROM HELL),
(SPY), (INTC), (AMZN), (CSCO),
(MONDAY, JUNE 11, FORT WORTH, TEXAS, GLOBAL STRATEGY LUNCHEON),
(THE HARD/SOFT DATA CONUNDRUM)
Well, that was some quarter! Call it the quarter from hell.
For as long as most traders and investors can remember, they are losing money so far this year. And they promised us such a rose garden!
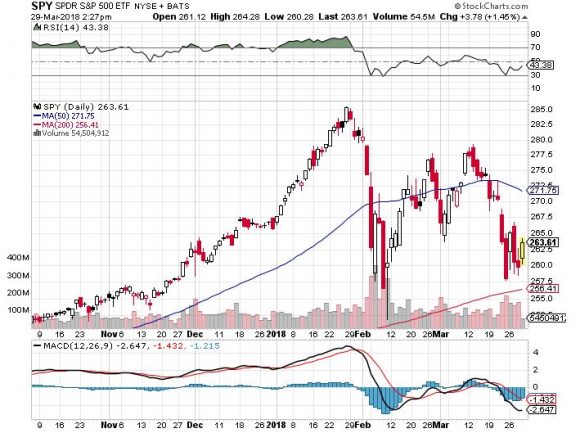
The S&P 500 made a valiant, and so far successful effort to hold at the 200-day moving average at $256. We saw an unprecedented four consecutive days of 2% moves.
Yet, with all that tearing of hair, banging of heads against walls, and ulcers multiplying like rabbits, the (SPY) dropped only 5 points since January, off 1.8%, a mere pittance. It's been a whole lot of work and stress for nothing.
So far, the (SPY) has been bracketed by the 50-day moving average on the upside at $272, and the 200-day moving average on the downside. It could continue like this for six more months, forming a very long triangle formation with a year-end upside breakout.
Is the market going to sleep pending the outcome of the November midterm congressional elections?
But here's the catch. We now live in the world of false breakouts and breakdowns, thanks to algorithms. It happened twice in February and March to the upside.
What follows false upside breakouts? How about false downside breakdowns, which may be on the menu for us in April.
My bet is that we'll see one of these soon, taking the (SPY) down as low as $246. Then we'll rocket back up to the middle of the range in another one of those up 100-point days.
What will cause such a catharsis? An escalation of the trade war would certainly do it. Or maybe just a random presidential tweet about anything.
That's why I have been holding fire so far on my volatility shorts and more aggressive longs in stocks.
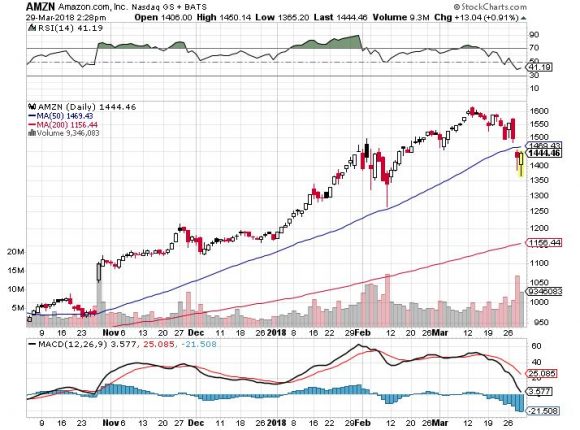
What will I be buying? Amazon (AMZN), which has essentially an unlimited future. Thank the president for creating a rare 16% selloff and unique buying opportunity with his nonsensical talk about antitrust action.
On what exactly does Amazon have a monopoly? Brilliance?
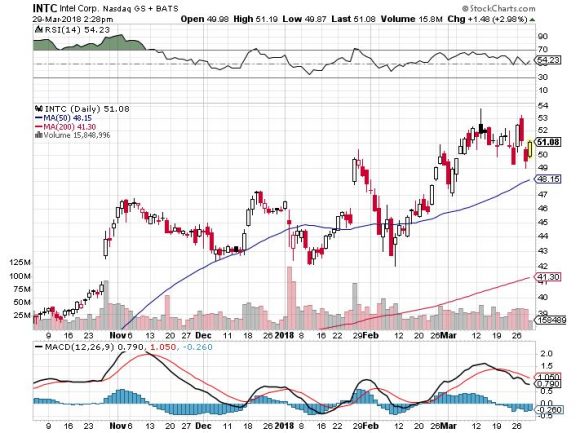
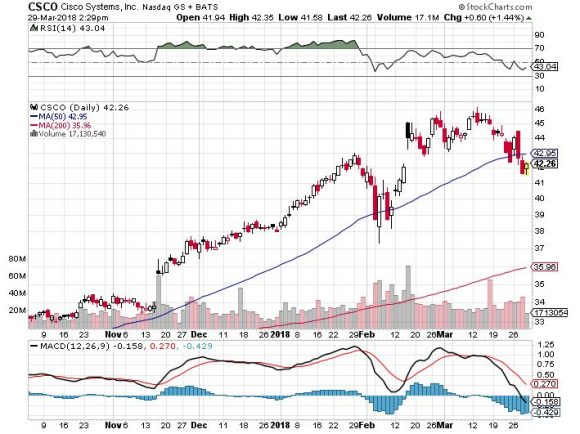
I also will be taking a look at laggard legacy old tech companies such as Intel (INTC) and Cisco Systems (CSCO). And how can you not like Microsoft here (MSFT)?
Of course, the mystery of the week was the strength in bonds (TLT) taking yields for the 10-year Treasury down to 2.75%. This is in the face of a Treasury auction on Wednesday that went over like a lead balloon.
I think it's all about quarter end positioning more than anything. Some hedge funds have big losses in stocks and volatility trading to cover, and what better way to do it than take profits on bond shorts through buying.
I already have started selling into the rally.
The scary thing about the bond action is that it has accelerated the flattening of the yield curve, with the two-year/10-year spread now only 50 basis points.
It also brings forward the inversion of the yield curve. And we all know what follows that with total certainty: a bear market in stocks and a recession.
The data flow for the coming week is all about jobs, jobs, jobs.
On Monday, April 2, at 9:45 AM, we get the March PMI Manufacturing Index.
On Tuesday morning, we receive March Motor Vehicle Sales, which have recently been weak at 17.1 million units.
On Wednesday, April 4, at 8:15 AM EST, the first of the trifecta of jobs reports comes out with the ADP Employment Report, a read on private sector high.
Thursday, April 5, leads with the Weekly Jobless Claims at 8:30 AM EST, which hit a new 49-year low last week at an amazing 210,000.
At 7:30 AM we get the March Challenger Job Cut Report.
On Friday, April 6, at 8:30 AM EST, we get the Big Kahuna with the March Nonfarm Payroll Report. Last month brought shockingly weak figures.
The week ends as usual with the Baker Hughes Rig Count at 1:00 PM EST. Last week brought a drop of 2.
As for me, I am headed up to Lake Tahoe, Nev., today for spring break to catch the last of the heavy snow. After a record 18 feet in March, Squaw Valley, Calif., has announced that it is keeping the ski lifts open until the end of May.
Good Luck and Good Trading.
https://www.madhedgefundtrader.com/wp-content/uploads/2018/04/john-story-1-image-6-e1522354823454.jpg225300MHFTRhttps://madhedgefundtrader.com/wp-content/uploads/2019/05/cropped-mad-hedge-logo-transparent-192x192_f9578834168ba24df3eb53916a12c882.pngMHFTR2018-04-02 01:08:242018-04-02 01:08:24Market Outlook for the Week Ahead, or Goodbye the Quarter from Hell
Featured Trade:
(DON'T MISS THE MARCH 28 GLOBAL STRATEGY WEBINAR),
(TEN MORE UGLY MESSAGES FROM THE BOND MARKET),
(TLT), (TBT), (USO), (GLD), (GS), (SPY)
(FRIENDS WHO WILL EXECUTE MY TRADE ALERTS FOR YOU)
The market has been chattering quite a lot about the massive downside bets on the S&P 500 being placed by some of the industry?s best known players.
That is something I would expect from my long time client and mentor George Soros.
But Warren Buffett as well? He is one of the greatest long term, pro America bulls out there.
It is the sort of news that gives investors that queasy, seasick feeling in the pit of their stomachs. You know, like when a new Tesla owner shows off his warp speed ?ludicrous mode??
That is unless you are running heavy short positions in stocks, as I am.
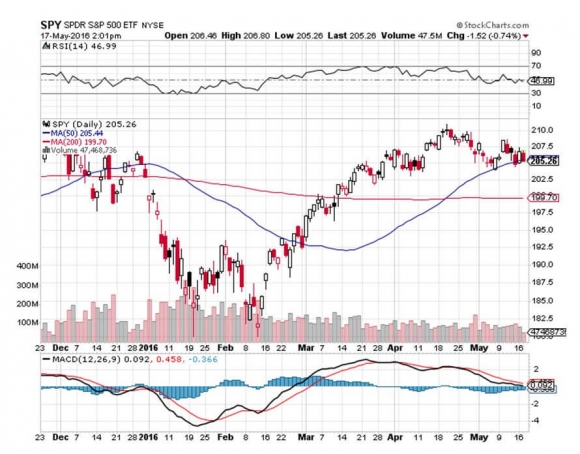
Every technical analyst in the world is pouring over their charts and coming to the same conclusion. A ?Head and Shoulders? pattern is setting up for the major indexes, especially for the S&P 500 (SPY).
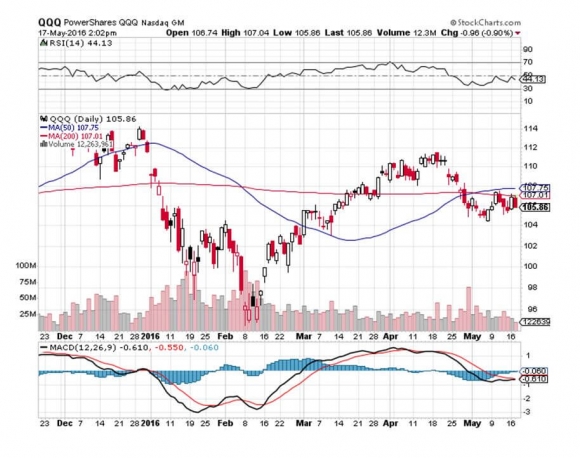
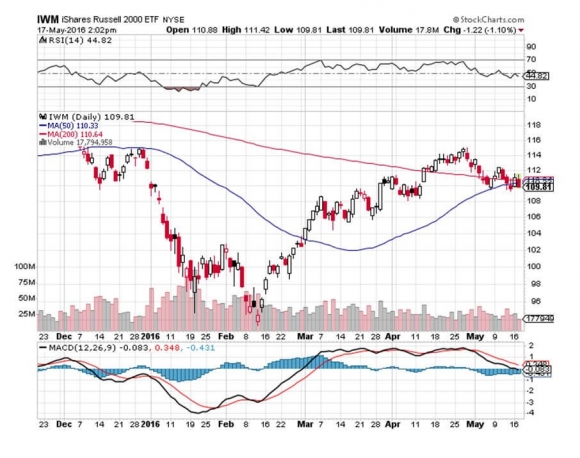
And if you think the (SPY) chart is bad, those for the NASDAQ (QQQ), and the Russell 2000 (IWM), look much worse.
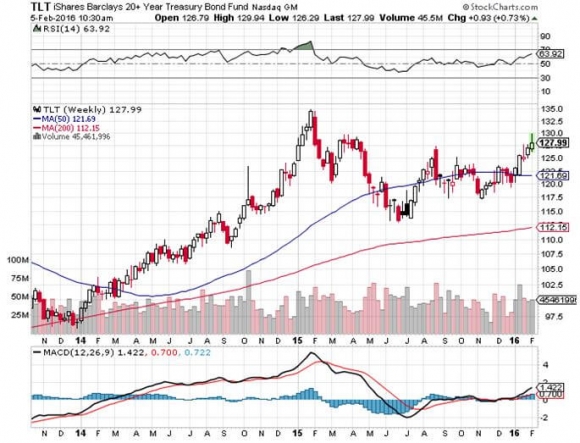
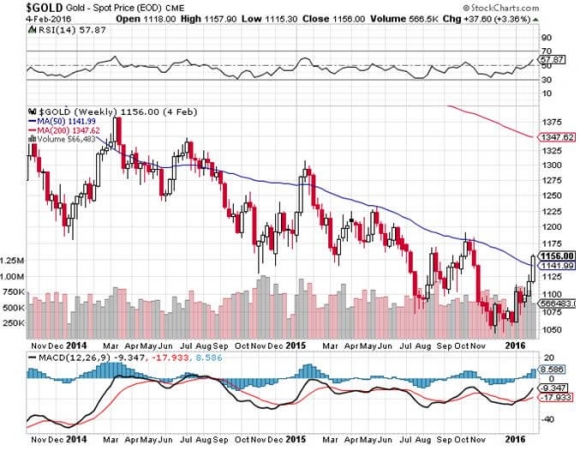
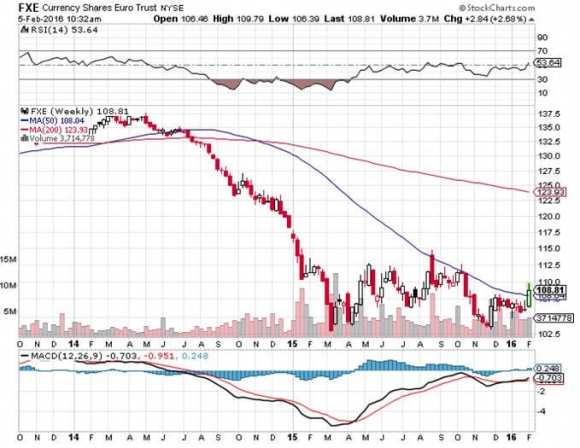
This is terrible news for stock investors, as well as owners of other risk assets like commodities, oil and real estate. It is wonderful news for those long of Treasury bonds (TLT), the Euro (FXE), gold (GLD), and silver (SLV).
A head and shoulders pattern is one of the most negative textbook indicators out there for financial markets. It means that there is only enough cash coming in to take prices up to the left shoulder, but no higher.
There is not even enough to challenge the old high, taking a double top decidedly off the table.
The bottom line: the market has run out of buyers. Be very careful of markets where everyone is bullish long term, but no one is doing any buying.
When the hot, fast money players see momentum rapidly fading, they pick up their marbles and go home. Some of the most aggressive, like me, even flip to the short side and make money in the falling market.
If we make it down to the ?neckline? and it doesn?t hold, then the sushi really hits the fan. Right now, that neckline is at $204.60 in the S&P 500 (SPY). Break that, and it?s hasta la vista baby. See you later.
Stop losses get triggered, the machines takeover, and shares move to the downside with a turbocharger. Distress margin calls on the most levered players (usually the youngest ones) add further fuel to the fire. We might even get a flash crash
This is when the really big money is made on the short side.
There is a new wrinkle this year that could make this sell off particularly vicious. To see a formation like this setting up during May is particularly ominous. It means that ?Sell in May? is going to work one more time
?It?s not like we have any shortage of bearish headlines to prompt a stampede by the bears.
The turmoil in Europe, one of the largest buyers of American exports, could cause the US to catch a cold. This is what the latest round of earnings disappointments has been hinting at.
Margin debt to own stocks has recently exploded to an all time high.
It could well be that the market action is just the dress rehearsal for a deeper correction in the summer, when markets are supposed to go down.
If markets do breakdown, it won?t be bombs away. The (SPY) might make it down to $181, $177, or in an extreme case $174. But to get sustainably below that, we really need to see an actual recession, not just a growth scare.
Remember that earnings are still growing year on year, once you take out the oil industry. That is not a formula for any kind of recession.
It is a formula for a 10% sell off in an aged bull market. That?s where you load the boat with the best quality stocks (MSFT), (FB), (GOOG), (CELG), etc., which should be down 25-35%, and then clock your +25% year in your equity trading portfolio.
If you are NOT a trader, but a long-term investor monitoring you retirement funds, just go take a round-the-world cruise and wake me up on December 31. You should be up 5% or more, with dividends, and skip the volatility.
Ignore It at Your Peril
Volatility? What Volatility?
https://www.madhedgefundtrader.com/wp-content/uploads/2014/04/Head-Shoulders-Shampoo.jpg363189Mad Hedge Fund Traderhttps://madhedgefundtrader.com/wp-content/uploads/2019/05/cropped-mad-hedge-logo-transparent-192x192_f9578834168ba24df3eb53916a12c882.pngMad Hedge Fund Trader2016-05-18 01:08:012016-05-18 01:08:01Watch Out for the Head and Shoulders
I have been to Greece many times over the past 45 years, and I?ll tell you that I just love the place. The beaches are perfect, the Ouzo wine enticing, and I?ll never say ?No? to a good moussaka.
However, I don?t let Greece dictate my investment strategy.
Greece, in fact, accounts for less than 2% of Europe?s GDP. It is not a storm in a teacup that is going on there, but a storm in a thimble. Greece is really just a full employment contract for financial journalists, who like to throw around big words like bankruptcy, default and contagion.
I have other things to worry about.
In fact, I am starting to come around to the belief that Europe is looking pretty good right here. Cisco (CSCO) CEO, John Chambers, announced that he was seeing the early signs of a turnaround.
Fiat CEO, Sergio Marchionne, the brilliant personal savior of Chrysler during the crash, thinks the beleaguered continent is about to recover from ?hell? to only ?purgatory.?
Only a devout Catholic could come up with such a characterization. But I love Sergio nevertheless because he generously helps me with my Italian pronunciation when we speak (aspirapolvere for vacuum cleaner, really?).
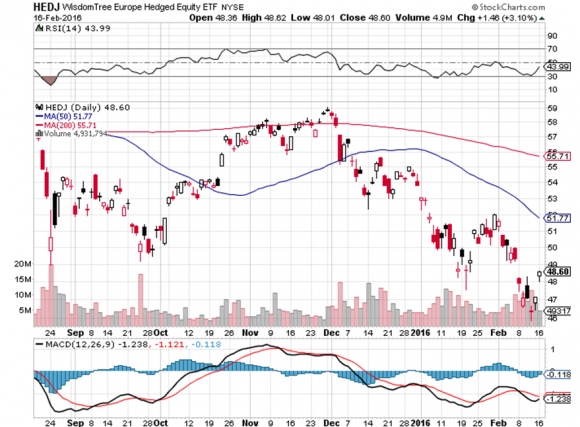
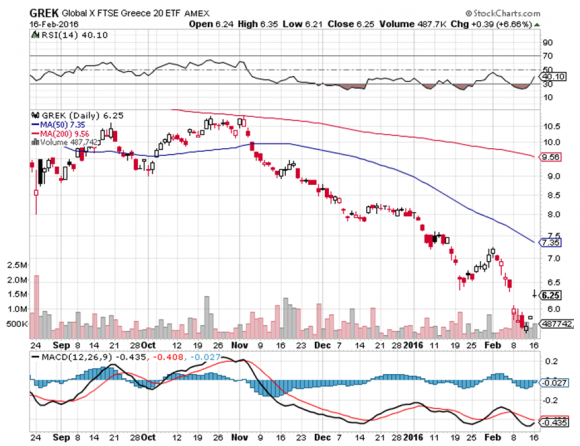
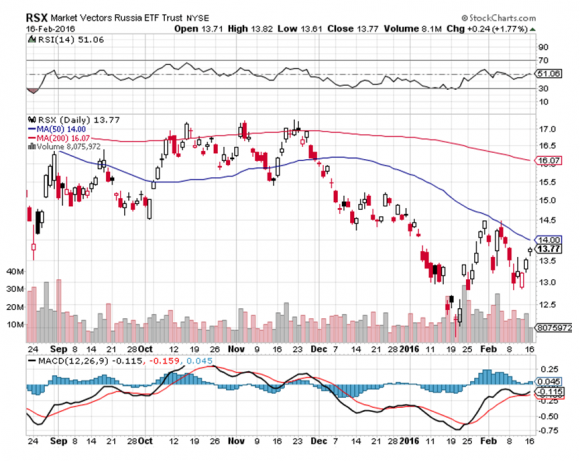
What are the two best performing stock markets since the big ?RISK ON? move started last Thursday? Greece (GREK) (+5%) and Russia (RSX) (+7.5%)!
And here is where I come in with my own 30,000 foot view.
The undisputed lesson of the past five years is that you always want to own stock markets that are about to receive an overdose of quantitative easing.
Since the US Federal Reserve launched their aggressive monetary policy, the S&P 500 (SPY) nearly tripled off the bottom.? Look how well US markets have performed since American QE ended 18 months ago.
Europe has only just barely started QE, and it could run for five more years. Corporations across the pond are about to be force-fed mountains of cash at negative interest rates, much like a goose being fattened for a fine dish of foie gras (only decriminalized in California last year).
Mind you, it could be another year before we get another dose of Euro QE, which is why I just bought the Euro (FXE) for a short-term trade.
A cheaper currency automatically reduces the prices of continental exports, making them more competitive in the international markets, and boosting their economies. Needless to say, this is all great new for stock markets.
Get Europe off the mat, and you can also add 10% to US share prices as well, as the global economy revives. The Euro drag dies and goes to heaven.
Buy the Wisdom Tree International Hedged Equity Fund ETF (HEDJ) down here on dips, which is long a basket of European stocks and short the Euro (FXE). This could be the big performer this year.
Praise the Lord and pass the foie gras!
It?s all a Matter of Perspective in Greece
https://www.madhedgefundtrader.com/wp-content/uploads/2015/02/Foie-Gras-e1423777772497.jpg303400Mad Hedge Fund Traderhttps://madhedgefundtrader.com/wp-content/uploads/2019/05/cropped-mad-hedge-logo-transparent-192x192_f9578834168ba24df3eb53916a12c882.pngMad Hedge Fund Trader2016-02-17 01:07:062016-02-17 01:07:06The Case for Europe
Those of a certain age can?t help but remember that things for the US went to hell in a hand basket after 1963.
That?s when President John F. Kennedy was assassinated, heralding decades of turmoil. Race riots exploded everywhere. The Vietnam War ramped up out of control, taking 60,000 lives, and destroying the nation?s finances. Nixon took the US off the gold standard.
When people complain about our challenges now, I laugh to my self and think this is nothing compared to that unfortunate decade.
Two oil shocks and hyper inflation followed. We reached a low point when Revolutionary Guards seized American hostages in Tehran in 1979.
We received a respite after 1982 with the rollback of a century?s worth of regulation during the Reagan years. But a borrowing binge sent the national debt soaring, from $1 trillion to $18 trillion. An 18-year bull market in stocks ensued. The United States share of global GDP continued to fade.
Basking in the decisive victories of WWII, the Greatest Generation saw their country account for 50% of global GDP, the largest in history, except, perhaps, for the Roman Empire. After that, our share of global business activity began a long steady decline. Today, we are hovering around 22%.
Hitch hiking around Europe in 1968 and 1969 with a backpack and a dog-eared copy of Europe on $5 a Day, I traded in a dollar for five French francs, four Deutschmarks, three Swiss francs, and 0.40 British pounds.
When I first landed in Japan in 1974, there were Y305 yen to the dollar. Even after a strong year, the greenback is still down by 75% against these currencies, except for sterling. How things have changed.
We now live in a world where the US suddenly has the strongest economy, currency and stock market in the world. Are these leading indicators of better things to come?
Is the Great American Rot finally ending? Is everything that has gone wrong with the United States over the past half century reversing?
The national finances are hinting as much. Over the last four years, the federal budget deficit has been shrinking at the fastest rate in history, from $1.4 trillion to only $483 million.
If the economy continues to grow at its present modest 2.5% rate, we should be in balance by 2018. Then the national debt, which will peak at around $18 trillion, will start to shrink for the first time in 20 years.
And since chronic deflation has crashed borrowing costs precipitously, the cost of maintaining this debt has dramatically declined.
A country with high economic growth, no inflation, generationally low energy costs, a strong currency, overwhelming technology superiority, a strong military and political stability is always a fantastic investment opportunity.
It certainly is compared to the highly deflationary, weak currency, technologically lagging major economies abroad.
You spend a lifetime looking for these as a researcher, and only come up with a handful. Perhaps this is what financial markets have been trying to tell us all along.
It certainly is what foreign investors have been telling us for years, who have been moving capital into the US as fast as they can (click here for ?The New Offshore Center: America?).
It gets even better. These ideal conditions are only the lead up to my roaring twenties scenario (click here for ?Get Ready for the Coming Golden Age?), when over saving, under consuming baby boomers enter a mass extinction, and a gale force demographic headwind veers to a tailwind.
That opens the way for the country to return to a consistent 4% GDP growth, with modest inflation and higher interest rates.
Which leads us all to the great screaming question of the moment: Why is the US stock market trading so poorly this year? If the long term prospects for companies are so great, why have shares suddenly started performing feebly?
Not only has it gone nowhere for three months, market volatility has doubled, making life for all of us dull, mean and brutish.
There are a few short-term answers to this conundrum.
There is no doubt that the Euro and the yen have fallen so sharply against the greenback that it is hurting the earnings of multinationals when translated back to dollars.
This has cut S&P 500 earnings forecasts for the year. And these days, everyone is a multinational, including the Diary of a Mad Hedge Fund Trader, where one third of our subscribers live abroad.
Another short-term factor is the complete collapse of the price of oil. Again, it happened so fast, and was so unexpected, that it too is having a sudden deleterious influence of broader S&P earnings.
Go no further than oil giant Chevron, which just announced a big drop in earnings and a massive cut in its capital spending budget for 2016.
The final nail in the Q4 coffin has been bank earnings, which all took big hits in trading revenues. Virtually all were taken short by the huge, one-way rally in bond prices in recent months and the collapse of interest rates.
This happens when panicky customers come in and lift the banks? inventories, and trading desks have to spend the rest of the day, week and month trying to get them back at a loss.
I have seen this happen too many times. This is why the industry always trades at such low multiples.
With no leadership from the biggest sectors of the market, financials and energy, and with the horsemen of technology and biotech vastly overbought, it doesn?t leave the nimble stock picker with too many choices.
The end result is a stock market that goes nowhere, but with a lot of volatility. Sound familiar?
Fortunately, there is a happy ending to this story. Eventually, all of the short-term factors will disappear. Oil prices and bond yields will go back up. The dollar will moderate. Corporate earnings growth will return to the 10% neighborhood. And stocks will reach new highs.
But it could take a while to digest all of this. This is a lot of red meat to take in all at one time. If the market grinds sideways in a 15% range all year, and then breaks out to the upside once again for a 5% annual gain, most investors would consider this a win.
Once again, index investors will beat the pants off of hedge fund managers, as they have for the past seven years.
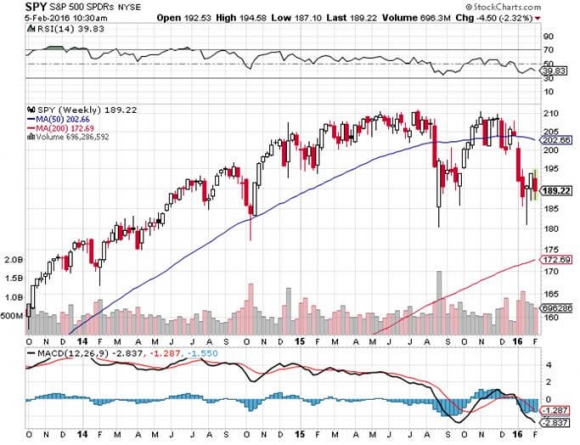
In the meantime, I doubt the stock indexes will drop more than 6% % from here, with the (SPY) at $189, and we have already seen a 6% hair cut from last year?s peak.?
Knock a tenth off a 16.5 X forward earnings multiple with zero inflation, cheap energy, ultra low interest rates and hyper accelerating technology, and all of a sudden, stocks look pretty cheap again.
As the super sleuth, Sherlock Homes used to say, ?When you have eliminated the impossible, whatever remains, however improbable, must be the truth?.
It?s All Elementary
https://www.madhedgefundtrader.com/wp-content/uploads/2015/02/Holmes-Watson.jpg308394Mad Hedge Fund Traderhttps://madhedgefundtrader.com/wp-content/uploads/2019/05/cropped-mad-hedge-logo-transparent-192x192_f9578834168ba24df3eb53916a12c882.pngMad Hedge Fund Trader2016-02-08 01:06:502016-02-08 01:06:50The Great American Rot is Ending
Suddenly, the consolidation turned into a correction and maybe even a bear market.
A crucial part of trading a crash is knowing what to do at the bottom. Don?t worry. You?ll receive a flurry of text alerts from me right when that happens.
Many individual investors simply run to the bathroom and lock the door, hoping nobody knocks on the door for a couple of days.
Worse, they dump every stock they have. That?s what makes market bottoms.
Trades that once seemed impossible can now get done, provided you use limit orders.
Let me get this right. Stocks are crashing because:
1) The Federal Reserve isn?t going to raise interest rates anymore. 2) The price of oil has dropped 84% in five years. 3) Commodities have reached multi-decade lows. 4) The US dollar has suddenly stabilized. 5) Investors are yanking money from abroad and pouring it into the US on a flight to safety trade because it is the only place they can obtain a positive return, especially in stocks.
May I point out the screamingly obvious right here?
These are all reasons for 90% of US companies that borrow money and consume energy and commodities to increase earnings and to boost their share prices.
Only the 10% that derive revenues from ripping oil and commodities out of the ground should get hurt here.
Of course the market doesn?t know that. It is anything but rational when we hit big triple digit declines. There was only one direction on, and that was OUT.
And that is where you make your money
Margin clerks rule supreme, squeezing every bit of leverage out of their clients they can find.
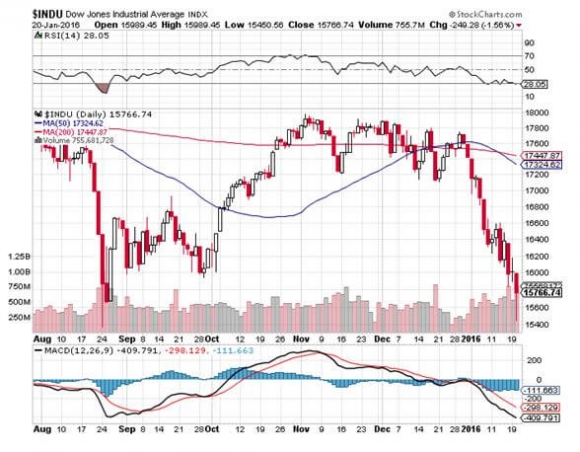
The Dow and (SPY) are already posting large negative numbers for 2016.
Of course, I saw all of this coming a mile off.
I have been banging drums, pulling fire alarms, shooting off flare guns, and otherwise warning readers that the technical situation for the market was terrible ever since I went 100% into cash in December.
When the breakdown appeared imminent, I shot out Trade Alerts to sell short the S&P 500 (SPY) in size as fast as I could write them. And I started buying outright (SPY) puts for the first time in ages.
As a result of these sudden tactical moves, my model-trading portfolio has been keeping its head above water all month, up 2%. The Dow Average is off by a nausea inducing -10.7% at today?s low.
Yes, yes! All the hard work and research is paying off!
Ignore my musings at your peril!
What is even more stunning is that these declines are occurring in the face of US macro economic numbers that are going from strength to strength. The blockbuster December nonfarm payroll report of 292,000 is the real writing on the wall.
Housing, which accounts for about one third of the US economy, has been on fire. I?m sorry, but if you can?t find a parking space at Target, there is no recession.
Another crucial leg of the US economy, auto manufacturing, has been in overdrive. Auto sales are at a record 18 million annual rate, and some summer production shut downs have been cancelled.
That is, everywhere except Volkswagen.
With two of the most important legs firing on all cylinders, it?s clearly not about the economy, stupid!
There certainly hasn?t been a geopolitical event to justify moves of this magnitude.
As far as I can tell, Hitler has not invaded Poland, nor have the Japanese attacked Pearl Harbor.
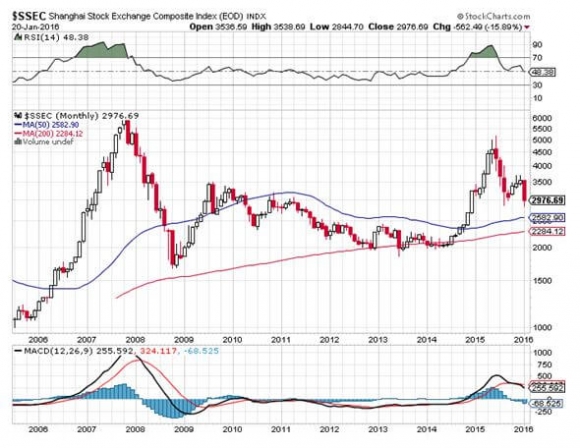
Sure, there is whining about China, which has the Shanghai Index approaching the 2,900 level once again, down 40% from the top.?
Which leads me to believe that all of this is nothing more than a temporary hiccup. A BIG Hofbrauhouse kind of hiccup, but a hiccup nonetheless.
In a zero interest rate world, stocks only have to fall back from a price earnings multiple of 18 to 15 to flush out a ton of buying, and they will have done just that when the (SPY) hits $174.
THAT IS MY LINE IN THE SAND.
If nothing else, corporate buybacks should reaccelerate here, which could reach $1 trillion in 2016. Some 75% companies exit their quiet period by February 5 and can resume buying.
That could signal an interim market bottom.
The great thing about this selloff is that the best quality companies have fallen the most. This has been a function of the heavy sovereign wealth fund selling the bridge oil deficits.
After all, when share prices are in free fall, you have to sell what you can, not what you want to. It is only human to realize profits rather than incur losses, so quality has been trashed.
I am therefore going to give you a list of ten of my favorite stocks to buy at the bottom, highlighting the sectors that will lead us into a yearend rally.
The themes here are home builders, consumer discretionary, autos, solar, old technology, and international. I?m sorry, but the entire interest sensitive sector is on hold for the rest of the year, thanks to likely Fed inaction.
Watch out, because when I sense that the market has burned itself out on the downside, the Trade Alerts are going to be coming hot and heavy.
You have been forewarned!
Read ?em and weep with joy!
10 Stocks to Buy at the Bottom
Lennar Homes (LEN) Home Depot (HD) Microsoft (MSFT) General Electric (GE) Tesla (TSLA) Apple (AAPL) First Solar (FSLR) Palo Alto Networks (PANW) Wisdom Tree Japan Hedged Equity (DXJ) Wisdom Tree Europe Hedged Equity (HEDJ)
Finally, All the Hard Work is Paying Off
https://www.madhedgefundtrader.com/wp-content/uploads/2015/07/John-Thomas5-e1437678792272.jpg299400Mad Hedge Fund Traderhttps://madhedgefundtrader.com/wp-content/uploads/2019/05/cropped-mad-hedge-logo-transparent-192x192_f9578834168ba24df3eb53916a12c882.pngMad Hedge Fund Trader2016-01-21 01:06:152016-01-21 01:06:15Ten Stocks to Buy at the Bottom
I did not buy the rally in stocks this week for two seconds.
Once the S&P 500 (SPY) bounced off of the $190 level the first time, it was only a question of how soon to sell again. When I said ?Sell every rally in stocks this year,? I wasn?t kidding.
As it turns out, I caught the absolutely top tick in the (SPY) at $195.
That?s where I quickly bought the (SPY) February $202-$207 vertical bear put debit spread. Within hours, the index cratered an awesome $70 handles, and I was already looking at 70% of the maximum potential profit.
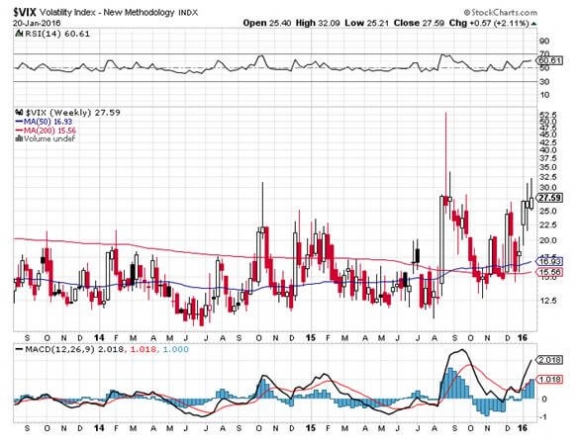
The great luxury of the S&P 500 SPDR?s (SPY) February, 2016 $202-$207 in-the-money vertical bear put spread is that it allows you to cash in on continued extremely elevated levels of the Volatility Index (VIX).
This is why the potential return is so high for a front month options spread already 7 handles, and now 12 handles in-the-money.
In the meantime, I continued to run big shorts in the (SPY) with my February 187 and $190 puts.
This was on the heels of cutting by half my (XIV) position at cost, and taking profits on my (SPY) January $182-$187 vertical bull call debit spread during the rally.
Since yesterday, I have cut the net exposure of my sizeable trading book from 40% to 0%. This is how you do it.
My lack of faith in this market can be measured by the bucket load.
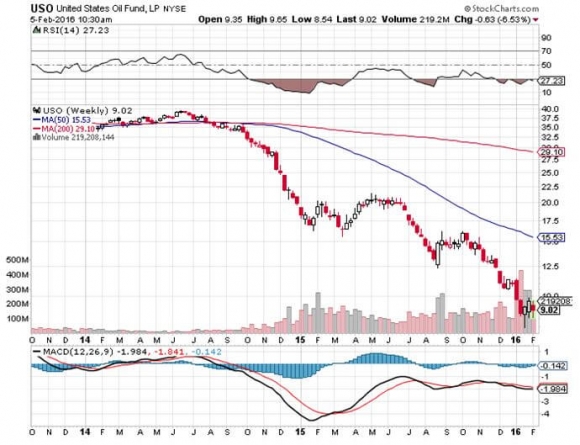
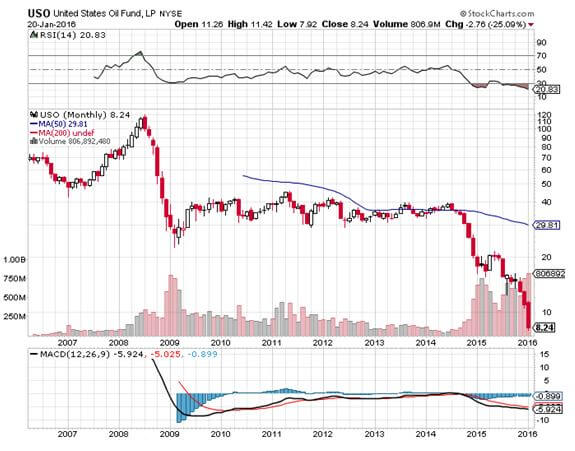
I believe that oil (USO) hasn?t bottomed yet.
All we are seeing here is a round of natural short covering you would expect as the price bounces off the big round number of $30, something which computer driven algorithms love to do.
There are many more visits to the $20 handle for oil to come. Brent is already there.
If you have some magical insight into the price of oil, better than the entire industry combined, and are convinced that Texas tea bottomed yesterday, then you shouldn?t touch the S&P 500 SPDR?s (SPY) February, 2016 $202-$207 in-the-money vertical bear put spread. In that unlikely scenario, stocks rocket from here.
Then there?s China (FXI), whose continued turmoil will bring further US stock losses. I assure you, not even the Chinese know what?s going on in China. They are more like the unfortunate deer that is frozen in the headlights.
If the stock markets of the Middle Kingdom were either up or down 10% tomorrow, I wouldn?t be surprised.
I?m quite happy with the performance of the Trade Alert service so far in 2016.
Here we are only 8 trading days into the New Year and many traders have already blown up, including quite a few trade mentoring newsletters. We should be hauling in some big numbers in January and February.
This is how you trade a crash. Watch and learn. The opportunities are legion.
https://www.madhedgefundtrader.com/wp-content/uploads/2013/07/John-Thomas-breakfast.jpg364490Mad Hedge Fund Traderhttps://madhedgefundtrader.com/wp-content/uploads/2019/05/cropped-mad-hedge-logo-transparent-192x192_f9578834168ba24df3eb53916a12c882.pngMad Hedge Fund Trader2016-01-14 01:07:352016-01-14 01:07:35Why I Doubled My Shorts Yesterday
Legal Disclaimer
There is a very high degree of risk involved in trading. Past results are not indicative of future returns. MadHedgeFundTrader.com and all individuals affiliated with this site assume no responsibilities for your trading and investment results. The indicators, strategies, columns, articles and all other features are for educational purposes only and should not be construed as investment advice. Information for futures trading observations are obtained from sources believed to be reliable, but we do not warrant its completeness or accuracy, or warrant any results from the use of the information. Your use of the trading observations is entirely at your own risk and it is your sole responsibility to evaluate the accuracy, completeness and usefulness of the information. You must assess the risk of any trade with your broker and make your own independent decisions regarding any securities mentioned herein. Affiliates of MadHedgeFundTrader.com may have a position or effect transactions in the securities described herein (or options thereon) and/or otherwise employ trading strategies that may be consistent or inconsistent with the provided strategies.


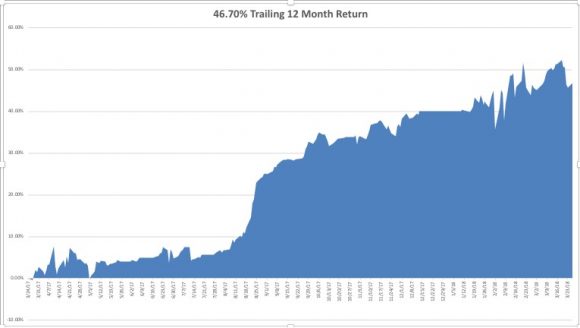


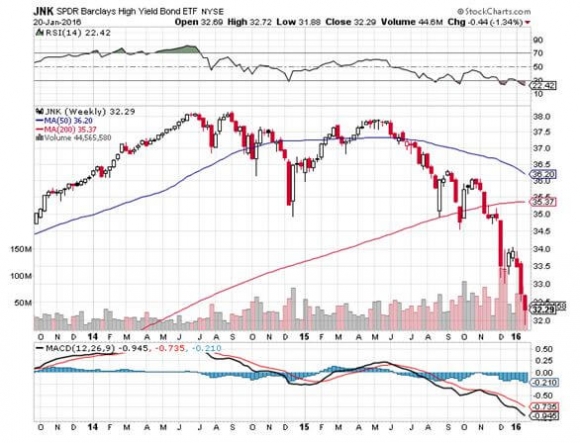
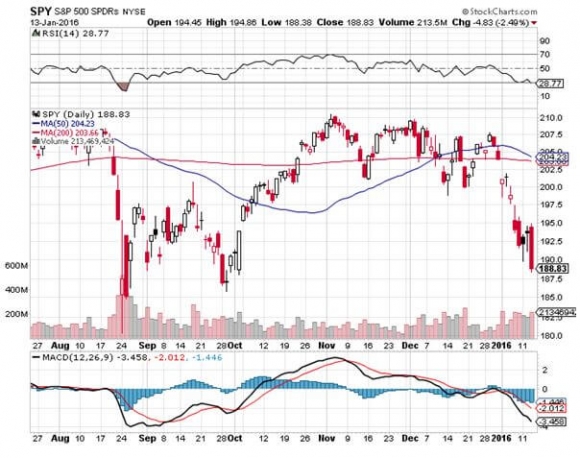
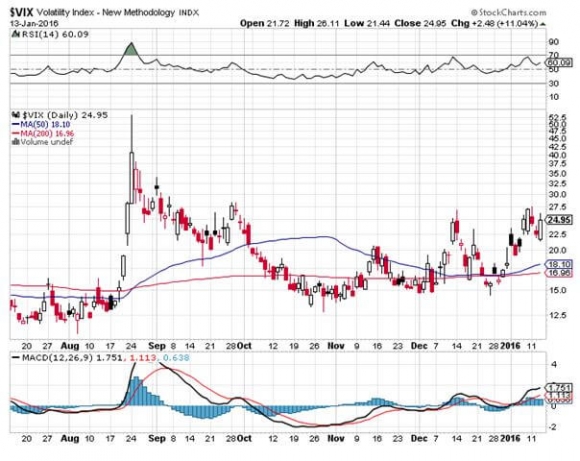
 Volatility? What Volatility?