We currently have two options positions that are deep in the money, and I just want to explain to the newbies how to best maximize their profits going into tomorrow?s January options expiration.
These comprise:
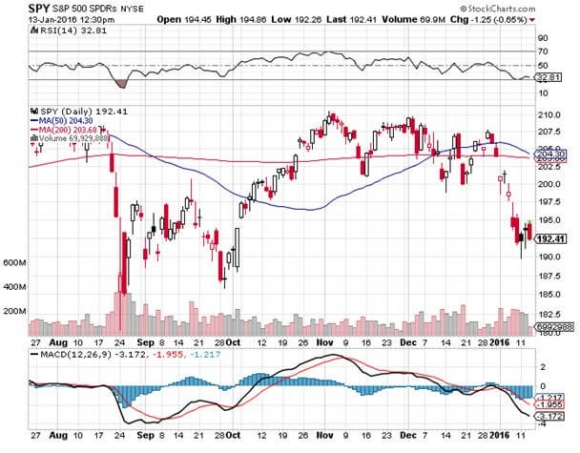
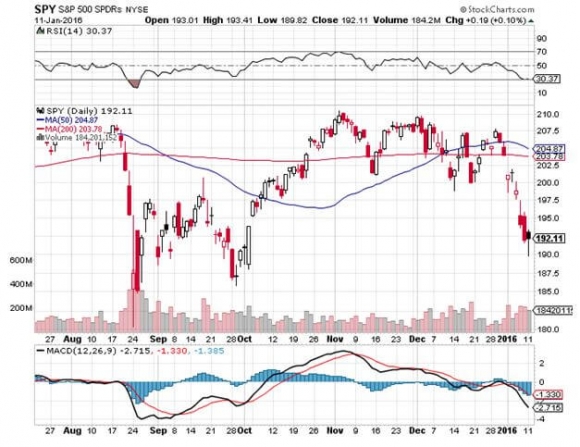
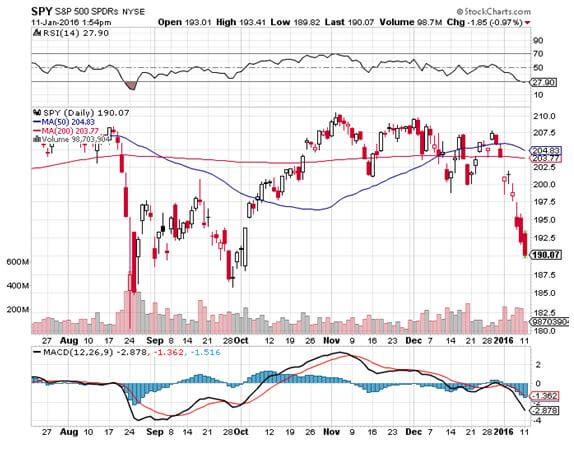
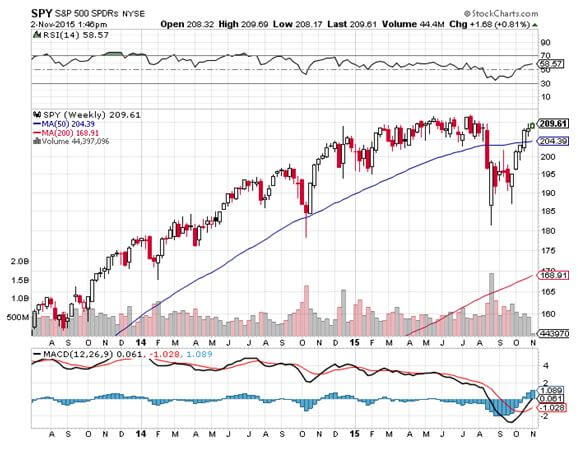
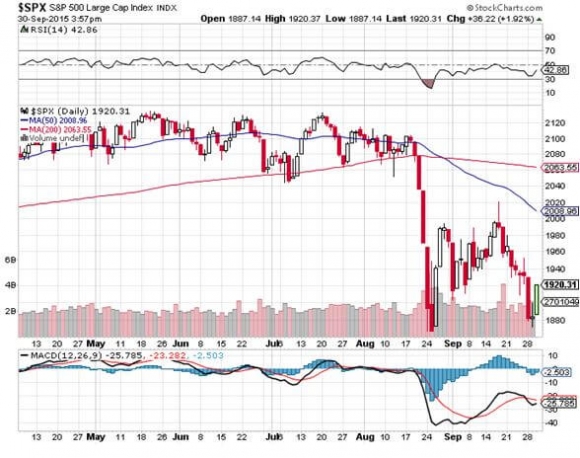
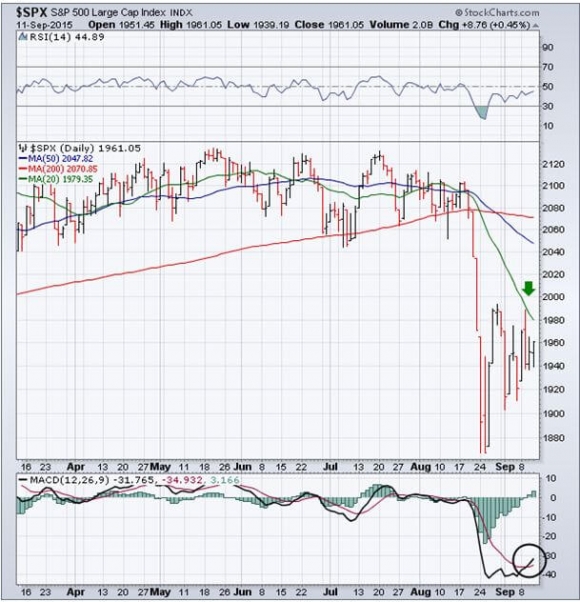
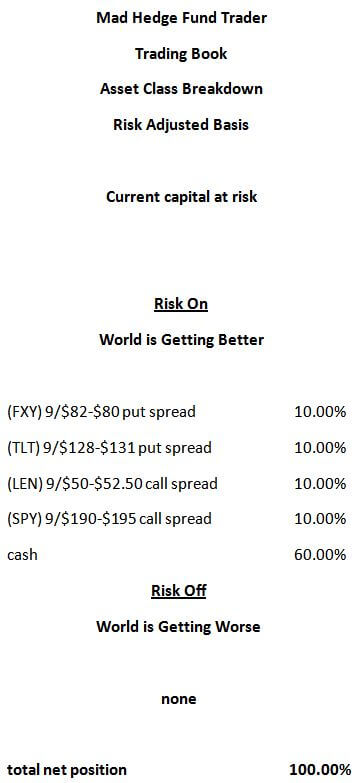
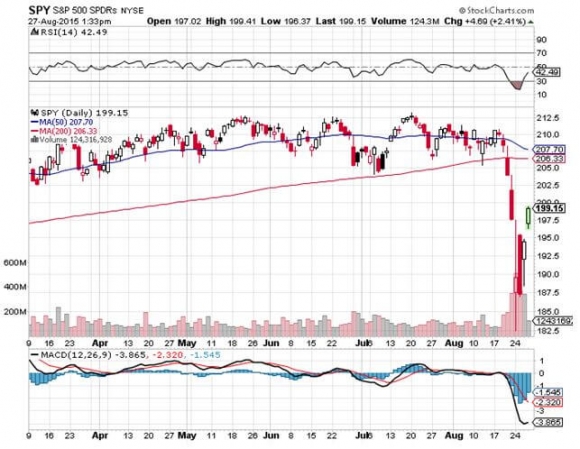
The S&P 500 SPDR?s (SPY) January $185-$190 in-the-money vertical bull call put spread with a cost of $4.58
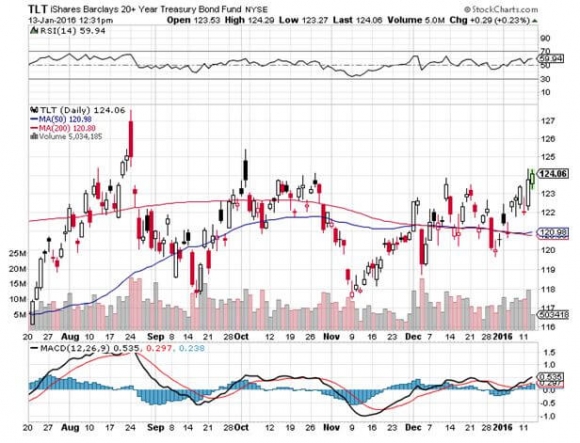
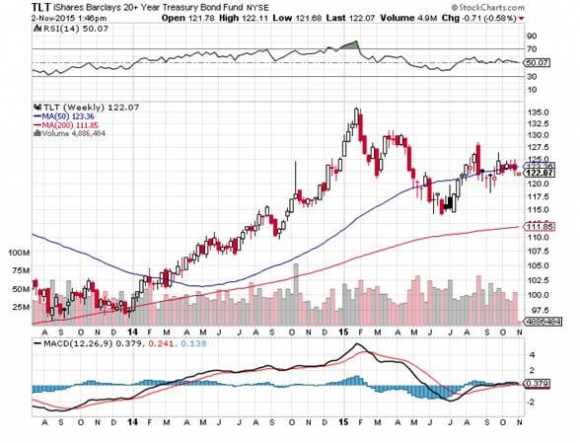
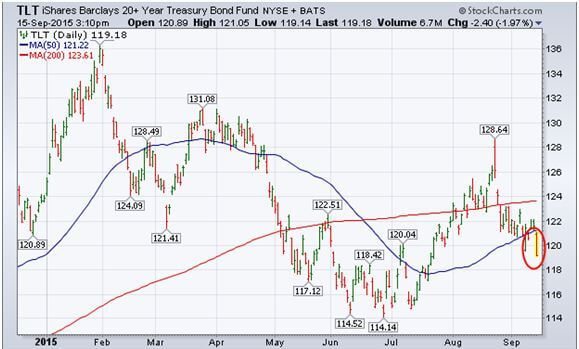
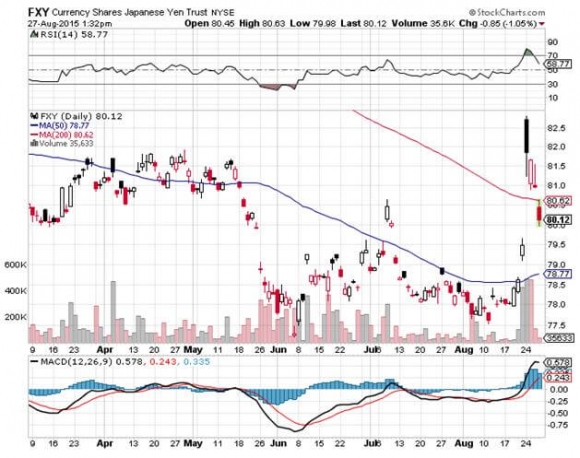
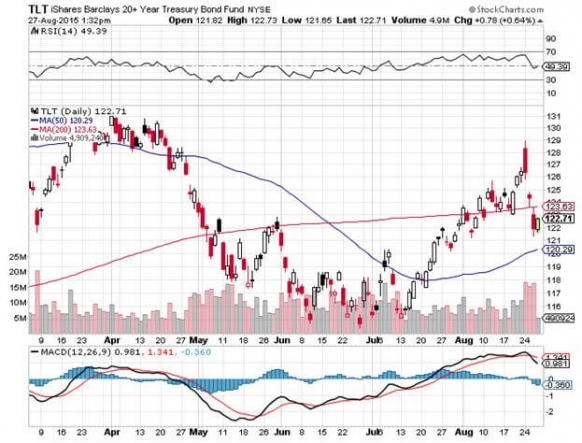
The IShares Barclay?s 20 Year+ Treasury Bond Fund (TLT) January $125-$128 in-the-money vertical bear put spread with a cost of $2.70.
Here?s the easy part:
As long as the (SPY) closes at $190 or above at the close, the position will expire worth $5.00 and you will achieve the maximum possible profit. The nine-day gain on the trade will be 9.2%.
In addition, as long as the (TLT) closes at $125 or below at the close, the position will expire worth $3.00 and you will achieve the maximum possible profit here as well. The seven-day profit will be 11.1%.
Since the bond market closes at 3:00 PM EST on Friday, don?t expect much price movement after that.
Better than a poke in the eye with a sharp stick, as they say, especially in these difficult trading conditions.
In this case, the expiration is very simple. You take your left hand, grab your right wrist, pull it behind your neck and pat yourself on the back for a job well done.
Your only problem now is to figure out how to spend your winnings.
Your broker (are they still called that?) will automatically use the long (SPY) call to cover the short (SPY) call, and the long (TLT) put to cover the short (TLT) put, entirely cancelling out the positions.
The profit will be credited to your account on the following Monday, and the margin freed up.
If doesn?t, get on the blower immediately, because broker computers sometimes make mistakes, and they will always try to blame you first.
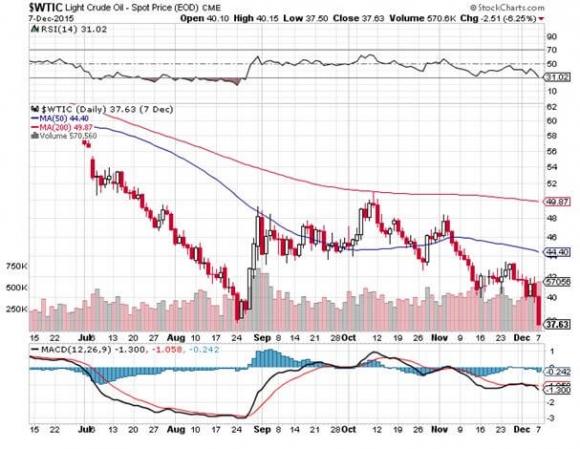
If an unforeseen event causes the (SPY) to collapse to the downside before the Friday close, such as if oil decides to crater once more, then things start to get complicated.
If the (SPY) expires slightly out-of-the-money, like at $189.90, the position can become a headache.
On the close, your short put position expires worthless, but your long put position is converted into a large, leveraged outright naked long position in the (SPY) with a cost of $185.58.
This position you do not want on pain of death, as the potential risk is huge and unlimited, and your broker probably would not allow it unless you wired in a ton of new margin immediately. It is more likely that they will execute a forced liquidation of your account.
This is to be avoided at all cost. It is not what moneymaking is all about.
Professionals caught in this circumstance then sell short a number of shares of (SPY) on expiration day equal to the short position they inherit with the expiring $185 call to hedge out their risk.
Then the long (SPY) position in the $185 calls is cancelled out by the short (SPY) position in the shares, and on Monday both disappear from their statement.
To minimize risk, traders attempt to sell these shares right at the close. As you have thousands of people attempting to do this at the same time, price action on expiration closes can be wild.
So for individuals, I would recommend just selling the January $185-$190 vertical call debit spread outright in the market if it looks like this situation may develop and the (SPY) is going to close very close to the $190 strike.
Keep in mind, also, that the liquidity in the options market completely disappears, and the spreads widen, when a security has only hours, or minutes until expiration. No one wants to be left holding the bag.
This is known in the trade as the ?expiration risk.?
Don?t worry if you lose money on this one position. Your loss will be more than offset by profits in your February $190 puts and February 187 puts which you independently bought last Friday and Monday. That will give you a generous overall profit.
The logic is the same if the (TLT) looks like it is going to close over $125 tomorrow.
One way or the other, I?m sure you?ll do OK, as long as I am watching my screens like a hawk, which I will be. If I think any action is required on your part, I will send out the Trade Alert in seconds.
One way or the other, you will make money on these trades.
Well done, and on to the next trade.