
I am once again writing this report from a first class sleeping cabin on Amtrak?s California Zephyr. By day, I have two comfortable seats facing each other next to a broad window. At night, they fold into bunk beds, a single and a double. There is a shower, but only Houdini could get in and out of it.
We are now pulling away from Chicago?s Union Station, leaving its hurried commuters, buskers, panhandlers, and majestic great halls behind. I am headed for Emeryville, California, just across the bay from San Francisco. That gives me only 56 hours to complete this report.
I tip my porter, Raymond, $100 in advance to make sure everything goes well during the long adventure, and to keep me up to date with the onboard gossip.
The rolling and pitching of the car is causing my fingers to dance all over the keyboard. Spellchecker can catch most of the mistakes, but not all of them. Thank goodness for small algorithms.

As both broadband and cell phone coverage are unavailable along most of the route, I have to rely on frenzied searches during stops at major stations along the way to chase down data points.
You know those cool maps in the Verizon stores that show the vast coverage of their cell phone networks? They are complete BS. Who knew that 95% of America is off the grid? That explains a lot about our politics today. I have posted many of my better photos from the trip below, although there is only so much you can do from a moving train and an iPhone.
After making the rounds with strategists, portfolio managers, and hedge fund traders, I can confirm that 2014 was one of the toughest to trade for careers lasting 30, 40, or 50 years. Yet again, the stay at home index players have defeated the best and the brightest.
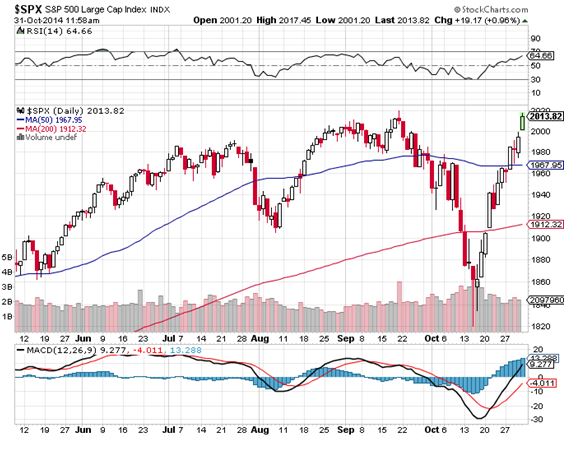
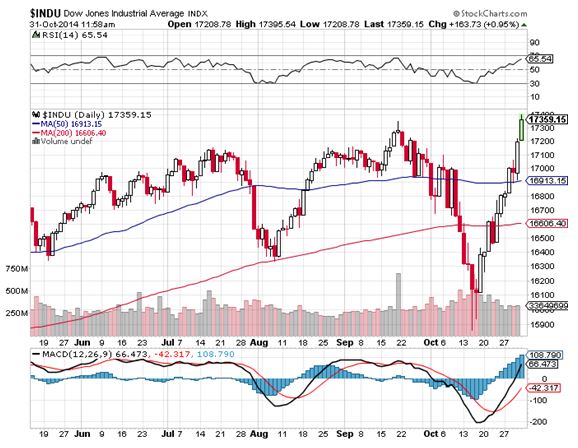
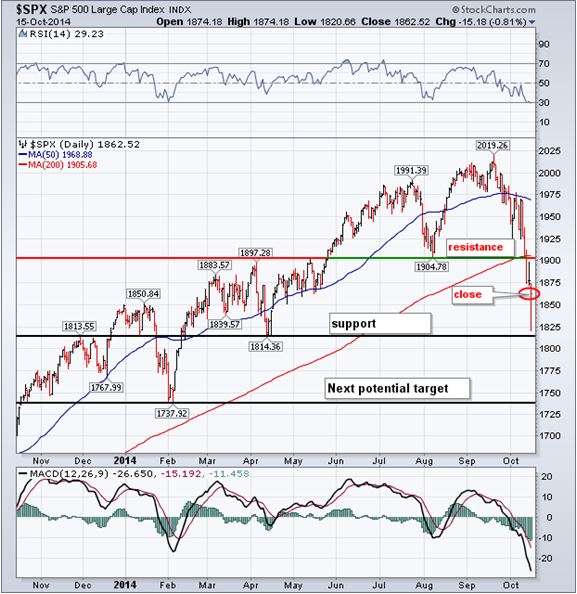
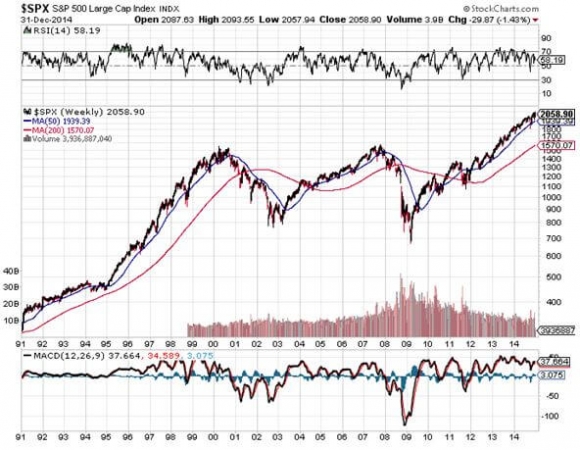
With the Dow gaining a modest 8% in 2014, and S&P 500 up a more virile 14.2%, this was a year of endless frustration. Volatility fell to the floor, staying at a monotonous 12% for seven boring consecutive months. Most hedge funds lagged the index by miles.
My Trade Alert Service, hauled in an astounding 30.3% profit, at the high was up 42.7%, and has become the talk of the hedge fund industry. That was double the S&P 500 index gain.
If you think I spend too much time absorbing conspiracy theories from the Internet, let me give you a list of the challenges I see financial markets facing in the coming year:

The Ten Highlights of 2015
1) Stocks will finish 2015 higher, almost certainly more than the previous year, somewhere in the 10-15% range. Cheap energy, ultra low interest rates, and 3-4% GDP growth, will expand multiples. It?s Goldilocks with a turbocharger.
2) Performance this year will be back-end loaded into the fourth quarter, as it was in 2014. The path forward became so clear, that some of 2015?s performance was pulled forward into November, 2014.
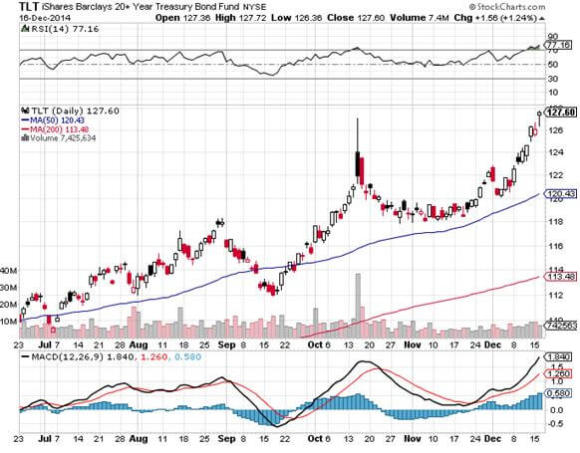
3) The Treasury bond market will modestly grind down, anticipating the inevitable rate rise from the Federal Reserve.
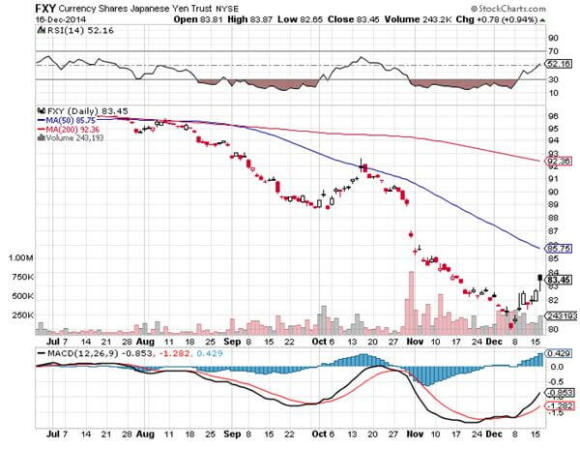
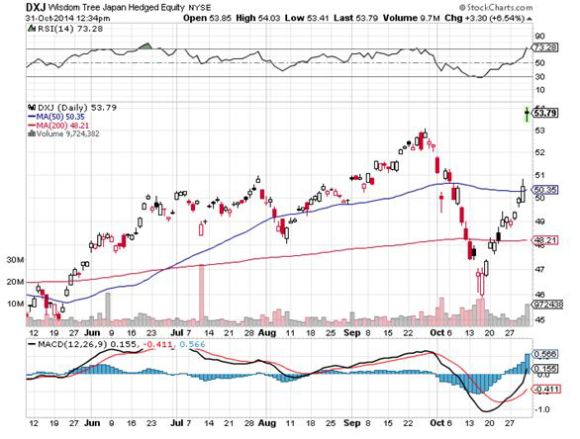
4) The yen will lose another 10%-20% against the dollar.
5) The Euro will fall another 10%, doing its best to hit parity with the greenback, with the assistance of beleaguered continental governments.
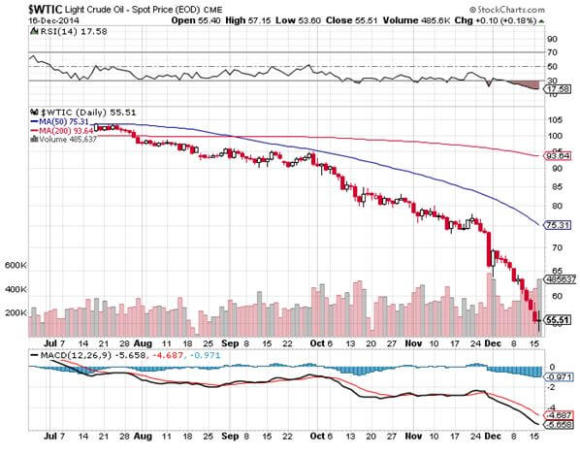
6) Oil stays in a $50-$80 range, showering the economy with hundreds of billions of dollars worth of de facto tax cuts.
7) Gold finally bottoms at $1,000 after one more final flush, then rallies (My jeweler was right, again).
8) Commodities finally bottom out, thanks to new found strength in the global economy, and begin a modest recovery.
9) Residential real estate has made its big recovery, and will grind up slowly from here.
10) After a tumultuous 2014, international political surprises disappear, the primary instigators of trouble becalmed by collapsed oil revenues.

The Thumbnail Portfolio
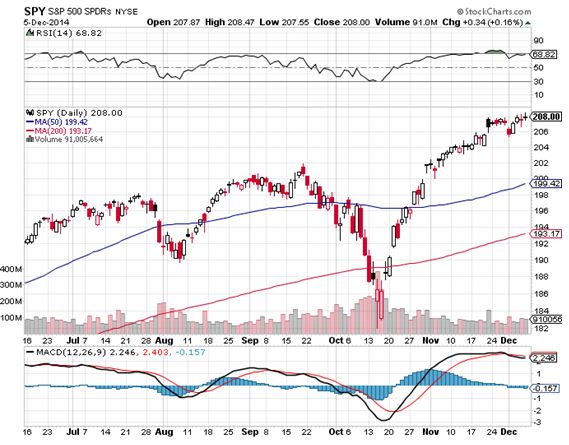
Equities - Long. A rising but low volatility year takes the S&P 500 up to 2,350. This year we really will get another 10% correction. Technology, biotech, energy, solar, and financials lead.
Bonds - Short. Down for the entire year with long periods of stagnation.
Foreign Currencies - Short. The US dollar maintains its bull trend, especially against the Yen and the Euro.
Commodities - Long. A China recovery takes them up eventually.
Precious Metals - Stand aside. We get the final capitulation selloff, then a rally.
Agriculture - Long. Up, because we can?t keep getting perfect weather forever.
Real estate - Long. Multifamily up, commercial up, single family homes sideways to up small.

1) The Economy - Fortress America
This year, it?s all about oil, whether it stays low, shoots back up, or falls lower. The global crude market is so big, so diverse, and subject to so many variables, that it is essentially unpredictable.
No one has an edge, not the major producers, consumers, or the myriad middlemen. For proof, look at how the crash hit so many ?experts? out of the blue.
This means that most economic forecasts for the coming year are on the low side, as they tend to be insular and only examine their own back yard, with most predictions still carrying a 2% handle.
I think the US will come in at the 3%-4% range, and the global recovery spawns a cross leveraged, hockey stick effect to the upside. This will be the best performance in a decade. Most company earnings forecasts are low as well.
There is one big positive that we can count on in the New Year. Corporate earnings will probably come in at $130 a share for the S&P 500, a gain of 10% over the previous year. During the last five years, we have seen the most dramatic increase in earnings in history, taking them to all-time highs.
This is set to continue. Furthermore, this growth will be front end loaded into Q1. The ?tell? was the blistering 5% growth rate we saw in Q3, 2014.
Cost cutting through layoffs is reaching an end, as there is no one left to fire. That leaves hyper accelerating technology and dramatically lower energy costs the remaining sources of margin increases, which will continue their inexorable improvements. Think of more machines and software replacing people.
You know all of those hundreds of billions raised from technology IPO?s in 2014. Most of that is getting plowed right back into new start ups, accelerating the rate of technology improvements even further, and the productivity gains that come with it.
You can count on demographics to be a major drag on this economy for the rest of the decade. Big spenders, those in the 46-50 age group, don?t return in large numbers until 2022.
But this negative will be offset by a plethora of positives, like technology, global expansion, and the lingering effects of Ben Bernanke?s massive five year quantitative easing. A time to pay the piper for all of this largess will come. But it could be a decade off.
I believe that the US has entered a period of long-term structural unemployment similar to what Germany saw in the 1990?s. Yes, we may grind down to 5%, but no lower than that. Keep close tabs on the weekly jobless claims that come out at 8:30 AM Eastern every Thursday for a good read as to whether the financial markets will head in a ?RISK ON? or ?RISK OFF? direction.
Most of the disaster scenarios predicted for the economy this year were based on the one off black swans that never amounted to anything, like the Ebola virus, ISIS, and the Ukraine.
Being continually afraid is expensive.
![Moose on Snowy Mountain]() A Rocky Mountain Moose Family
A Rocky Mountain Moose Family

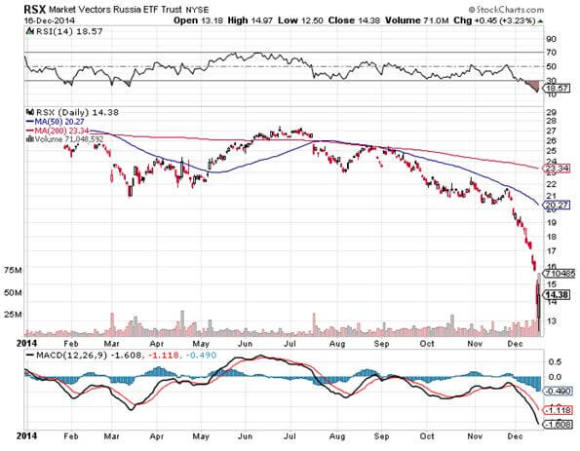
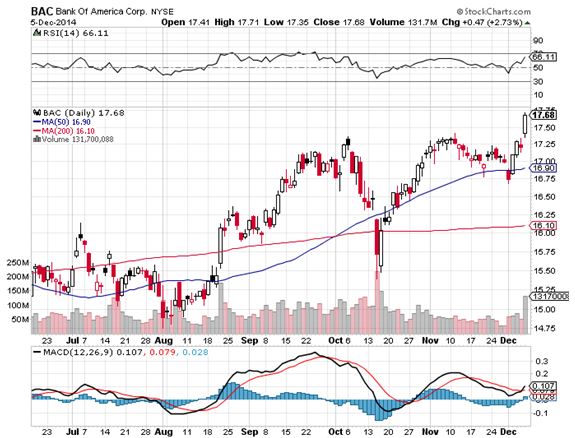
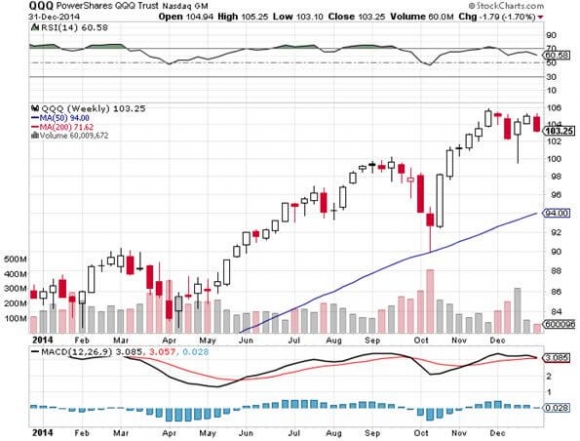
2) Equities (SPX), (QQQ), (AAPL), (XLF), (BAC), (EEM),(EWZ), (RSX), (PIN), (FXI), (TUR), (EWY), (EWT), (IDX)
With the economy going gangbusters, and corporate earnings reaching $130 a share, those with a traditional ?buy and hold? approach to the stock market will do alright, provided they are willing to sleep through some gut churning volatility. A Costco sized bottle of Jack Daniels and some tranquillizers might help too.
Earnings multiples will increase as well, as much as 10%, from the current 17X to 18.5X, thanks to a prolonged zero interest rate regime from the Fed, a massive tax cut in the form of cheap oil, unemployment at a ten year low, and a paucity of attractive alternative investments.
This is not an outrageous expectation, given the 10-22 earnings multiple range that we have enjoyed during the last 30 years. If anything, it is amazing how low multiples are, given the strong tailwinds the economy is enjoying.
The market currently trades around fair value, and no market in history ever peaked out here. An overshoot to the upside, often a big one, is mandatory.
After all, my friend, Janet Yellen, is paying you to buy stock with cheap money, so why not?
This is how the S&P 500 will claw its way up to 2,350 by yearend, a gain of about 12.2% from here. Throw in dividends, and you should pick up 14.2% on your stock investments in 2015.
This does not represent a new view for me. It is simply a continuation of the strategy I outlined again in October, 2014 (click here for ?Why US Stocks Are Dirt Cheap?).
Technology will be the top-performing sector once again this year. They will be joined by consumer cyclicals (XLV), industrials (XLI), and financials (XLF).
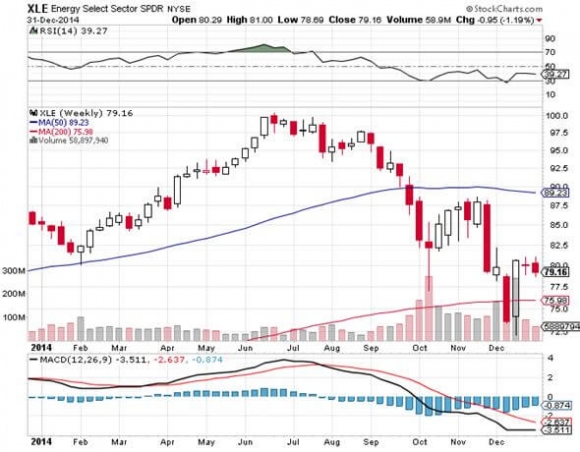
The new members in the ?Stocks of the Month Club? will come from newly discounted and now high yielding stocks in the energy sector (XLE).
There is also a rare opportunity to buy solar stocks on the cheap after they have been unfairly dragged down by cheap oil like Solar City (SCTY) and the solar basket ETF (TAN). Revenues are rocketing and costs are falling.
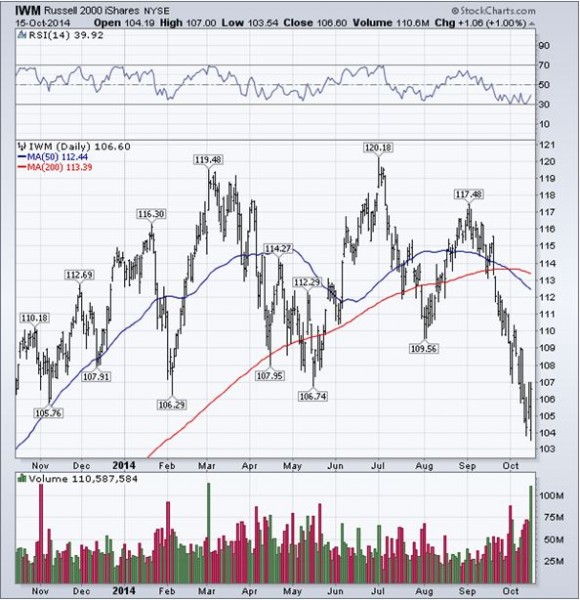
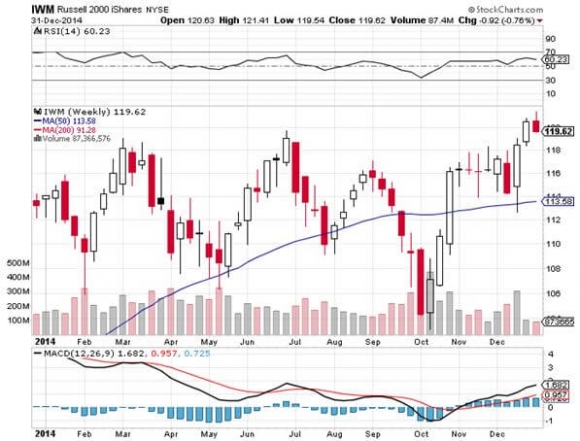
After spending a year in the penalty box, look for small cap stocks to outperform. These are the biggest beneficiaries of cheap energy and low interest rates, and also have minimal exposure to the weak European and Asian markets.
Share prices will deliver anything but a straight-line move. We finally got our 10% correction in 2014, after a three-year hiatus. Expect a couple more in 2015. The higher prices rise, the more common these will become.
We will start with a grinding, protesting rally that takes us up to new highs, as the market climbs the proverbial wall of worry. Then we will suffer a heart stopping summer selloff, followed by another aggressive yearend rally.
Cheap money creates a huge incentive for companies to buy back their own stock. They divert money from their $3 trillion cash hoard, which earns nothing, retire shares paying dividends of 3% or more, and boost earnings per share without creating any new business. Call it financial engineering, but the market loves it.
Companies are also retiring stock through takeovers, some $2 trillion worth last year. Expect more of this to continue in the New Year, with a major focus on energy. Certainly, every hedge fund and activist investor out there is undergoing a crash course on oil fundamentals. After a 13-year bull market in energy, the industry is ripe for a cleanout.
This is happening in the face of both an individual and institutional base that is woefully underweight equities.
The net net of all of this is to create a systemic shortage of US equities. That makes possible simultaneous rising prices and earnings multiples that have taken us to investor heaven.
![snowy hills]() Frozen Headwaters of the Colorado River
Frozen Headwaters of the Colorado River

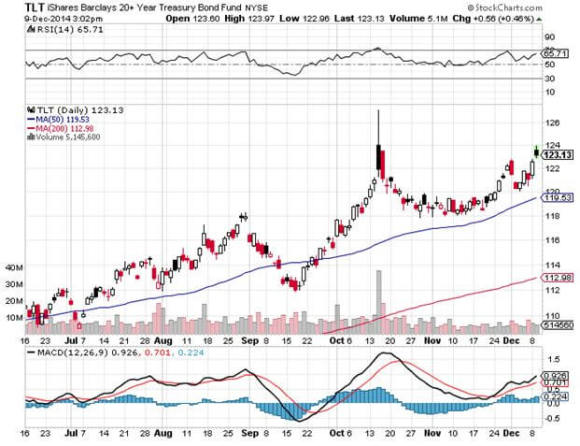
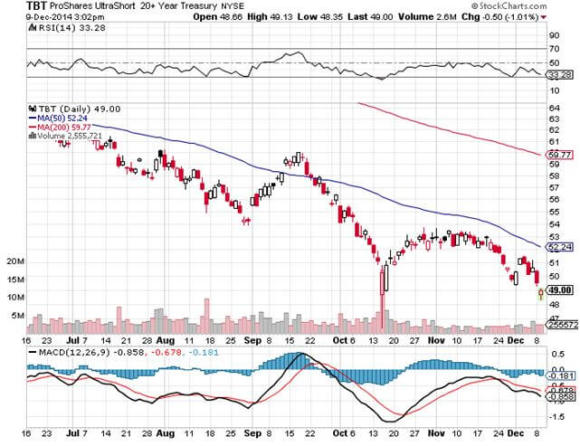
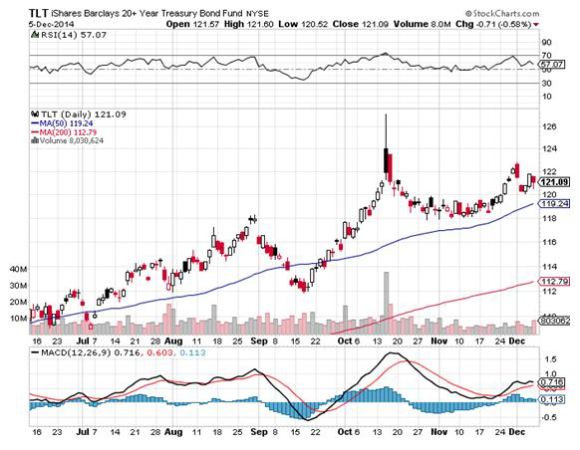
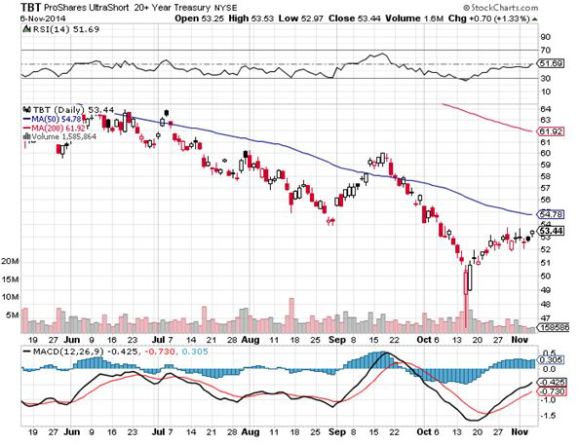
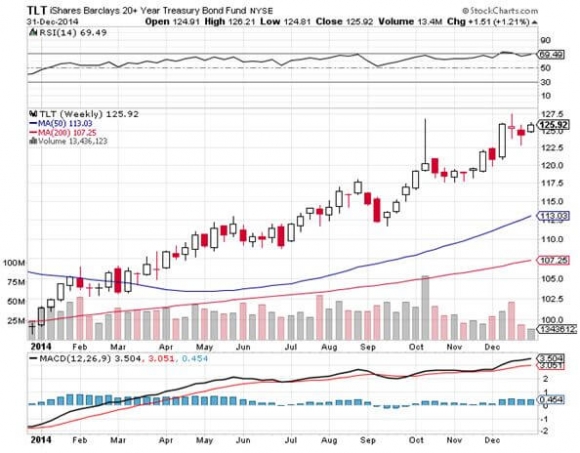
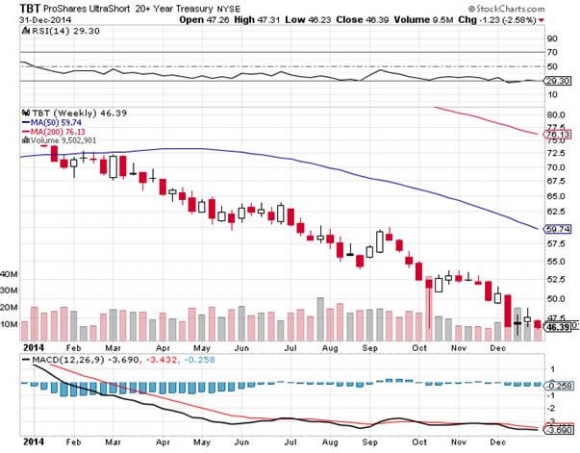
3) Bonds ?(TLT), (TBT), (JNK), (PHB), (HYG), (PCY), (MUB), (HCP), (KMP), (LINE)
Amtrak needs to fill every seat in the dining car, so you never know who you will get paired with.
There was the Vietnam vet Phantom jet pilot who now refused to fly because he was treated so badly at airports. A young couple desperate to get out of Omaha could only afford seats as far as Salt Lake City, sitting up all night. I paid for their breakfast.
A retired British couple was circumnavigating the entire US in a month on a ?See America Pass.? Mennonites returning home by train because their religion forbade airplanes.
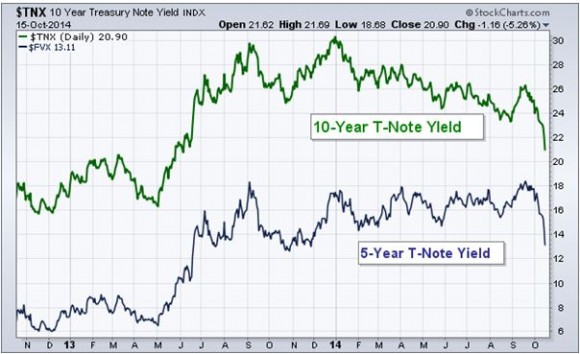
If you told me that US GDP growth was 5%, unemployment was at a ten year low at 5.8%, and energy prices had just halved, I would have pegged the ten-year Treasury bond yield at 6.0%. Yet here we are at 2.10%.
Virtually every hedge fund manager and institutional investor got bonds wrong last year, expecting rates to rise. I was among them, but that is no excuse. At least I have good company.
You might as well take your traditional economic books and throw them in the trash. Apologies to John Maynard Keynes, John Kenneth Galbraith, and Paul Samuelson.
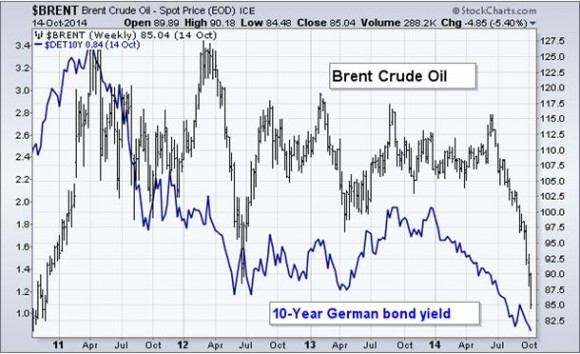
The reasons for the debacle are myriad, but global deflation is the big one. With ten year German bunds yielding a paltry 50 basis points, and Japanese bonds paying a paltry 30 basis points, US Treasuries are looking like a bargain.
To this, you can add the greater institutional bond holding requirements of Dodd-Frank, a balancing US budget deficit, a virile US dollar, the commodity price collapse, and an enormous embedded preference for investors to keep buying whatever worked yesterday.
For more depth on the perennial strength of bonds, please click here for ?Ten Reasons Why I?m Wrong on Bonds?.
Bond investors today get an unbelievable bad deal. If they hang on to the longer maturities, they will get back only 80 cents worth of purchasing power at maturity for every dollar they invest.
But institutions and individuals will grudgingly lock in these appalling returns because they believe that the potential losses in any other asset class will be worse. The problem is that driving eighty miles per hour while only looking in the rear view mirror can be hazardous to your financial health.
While much of the current political debate centers around excessive government borrowing, the markets are telling us the exact opposite. A 2%, ten-year yield is proof to me that there is a Treasury bond shortage, and that the government is not borrowing too much money, but not enough.
There is another factor supporting bonds that no one is looking at. The concentration of wealth with the 1% has a side effect of pouring money into bonds and keeping it there. Their goal is asset protection and nothing else.
These people never sell for tax reasons, so the money stays there for generations. It is not recycled into the rest of the economy, as conservative economists insist. As this class controls the bulk of investable assets, this forestalls any real bond market crash, possibly for decades.
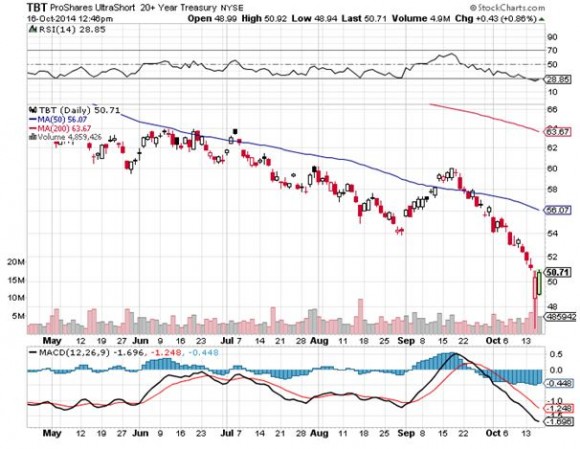
So what will 2015 bring us? I think that the erroneous forecast of higher yields I made last year will finally occur this year, and we will start to chip away at the bond market bubble?s granite edifice. I am not looking for a free fall in price and a spike up in rates, just a move to a new higher trading range.
The high and low for ten year paper for the past nine months has been 1.86% to 3.05%. We could ratchet back up to the top end of that range, but not much higher than that. This would enable the inverse Treasury bond bear ETF (TBT) to reverse its dismal 2014 performance, taking it from $46 back up to $76.
You might have to wait for your grandchildren to start trading before we see a return of 12% Treasuries, last seen in the early eighties. I probably won?t live that long.
Reaching for yield will continue to be a popular strategy among many investors, which is typical at market tops. That focuses buying on junk bonds (JNK) and (HYG), REITS (HCP), and master limited partnerships (KMP), (LINE).
There is also emerging market sovereign debt to consider (PCY). At least there, you have the tailwinds of long term strong economies, little outstanding debt, appreciating currencies, and higher interest rates than those found at home. This asset class was hammered last year, so we are now facing a rare entry point. However, keep in mind, that if you reach too far, your fingers get chopped off.
There is a good case for sticking with munis. No matter what anyone says, taxes are going up, and when they do, this will increase tax free muni values. So if you hate paying taxes, go ahead and buy this exempt paper, but only with the expectation of holding it to maturity. Liquidity could get pretty thin along the way, and mark to markets could be shocking. Be sure to consult with a local financial advisor to max out the state, county, and city tax benefits.
![Mennonites]() A Visit to the 19th Century
A Visit to the 19th Century

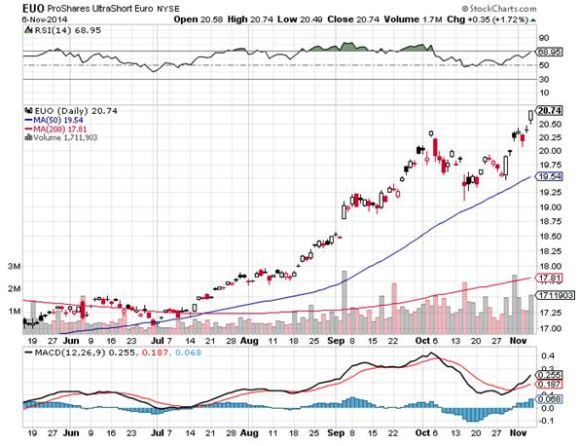
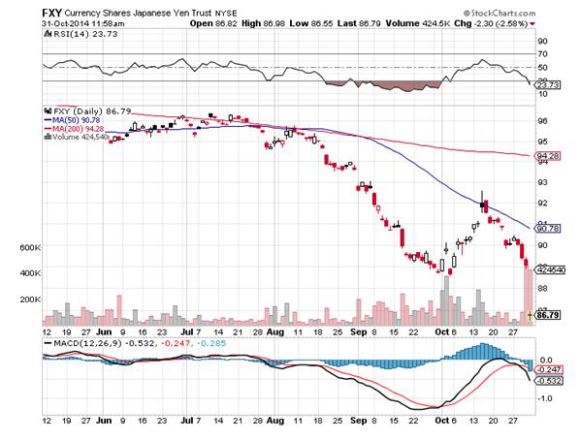
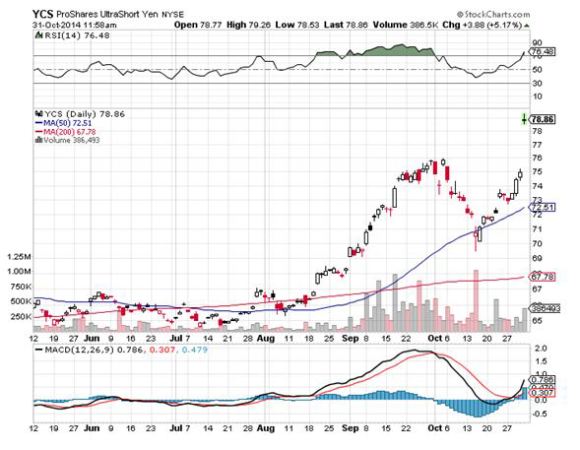
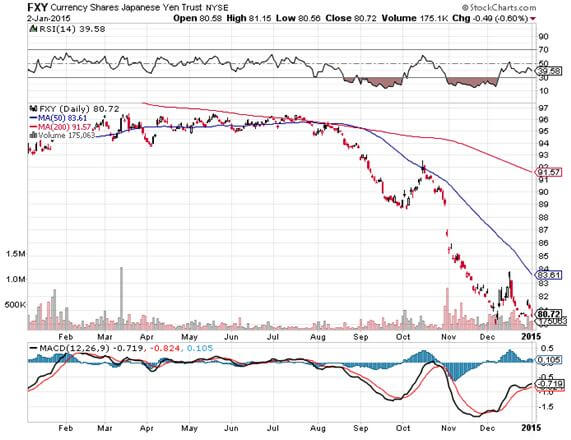
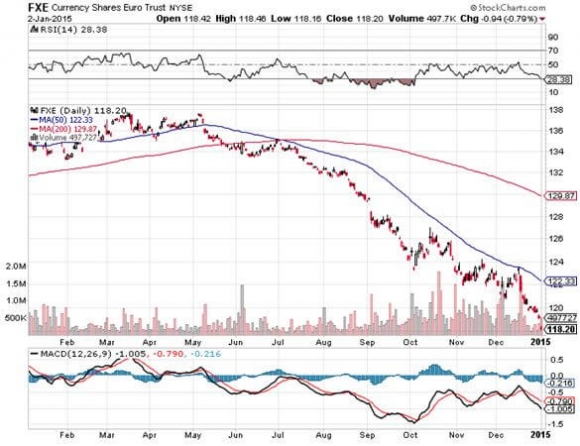
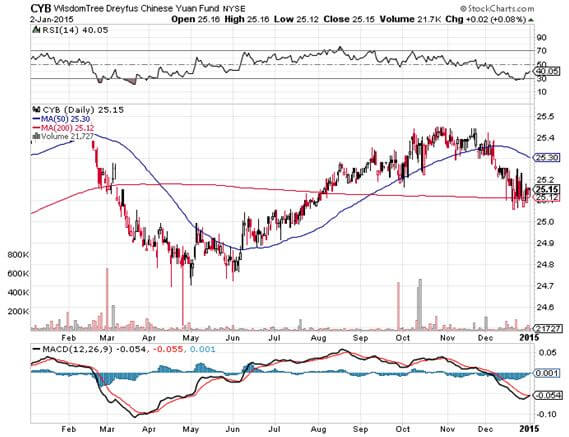
4) Foreign Currencies (FXE), (EUO), (FXC), (FXA), (YCS), (FXY), (CYB)
There are only three things you need to know about trading foreign currencies in 2015: the dollar, the dollar, and the dollar. The decade long bull market in the greenback continues.
The chip shot here is still to play the Japanese yen from the short side. Japan?s Ministry of Finance is now, far and away, the most ambitious central bank hell bent on crushing the yen to rescue its dying economy.
The problems in the Land of the Rising Sun are almost too numerous to count: the world?s highest debt to GDP ratio, a horrific demographic problem, flagging export competitiveness against neighboring China and South Korea, and the world?s lowest developed country economic growth rate.
The dramatic sell off we saw in the Japanese currency since December, 2012 is the beginning of what I believe will be a multi decade, move down. Look for ?125 to the dollar sometime in 2015, and ?150 further down the road. I have many friends in Japan looking for and overshoot to ?200. Take every 3% pullback in the greenback as a gift to sell again.
With the US having the world?s strongest major economy, its central bank is, therefore, most likely to raise interest rates first. That translates into a strong dollar, as interest rate differentials are far and away the biggest decider of the direction in currencies. So the dollar will remain strong against the Australian and Canadian dollars as well.
The Euro looks almost as bad. While European Central Bank president, Mario Draghi, has talked a lot about monetary easing, he now appears on the verge of taking decisive action.
Recurring financial crisis on the continent is forcing him into a massive round of Fed style quantitative easing through the buying of bonds issued by countless European entities. The eventual goal is to push the Euro down to parity with the buck and beyond.
For a sleeper, use the next plunge in emerging markets to buy the Chinese Yuan ETF (CYB) for your back book, but don?t expect more than single digit returns. The Middle Kingdom will move heaven and earth in order to keep its appreciation modest to maintain their crucial export competitiveness.

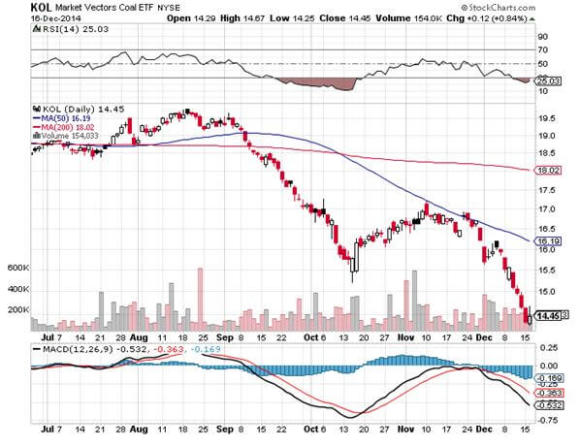
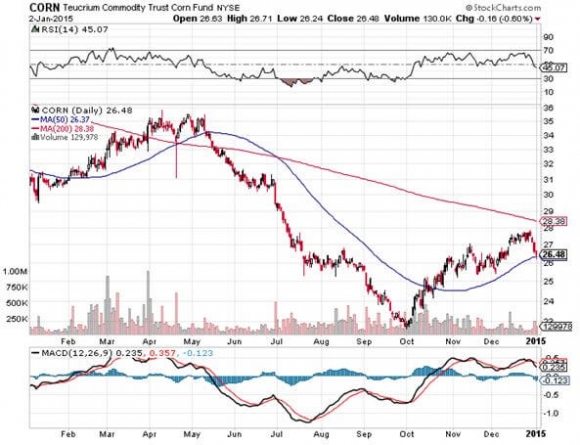
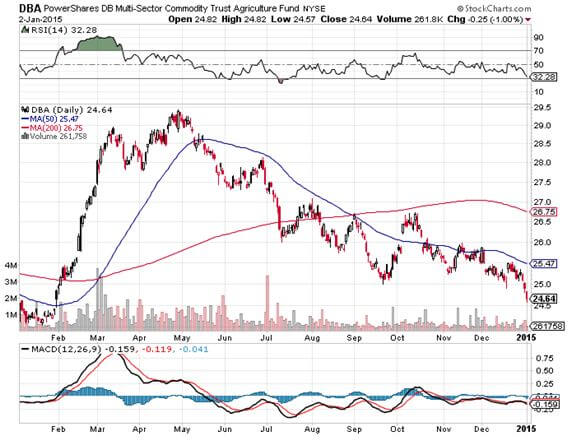
5) Commodities (FCX), (VALE), (MOO), (DBA), (MOS), (MON), (AGU), (POT), (PHO), (FIW), (CORN), (WEAT), (SOYB), (JJG)
There isn?t a strategist out there not giving thanks for not loading up on commodities in 2014, the preeminent investment disaster of 2015. Those who did are now looking for jobs on Craig?s List.
2014 was the year that overwhelming supply met flagging demand, both in Europe and Asia. Blame China, the big swing factor in the global commodity.
The Middle Kingdom is currently changing drivers of its economy, from foreign exports to domestic consumption. This will be a multi decade process, and they have $4 trillion in reserves to finance it.
It will still demand prodigious amounts of imported commodities, especially, oil, copper, iron ore, and coal, all of which we sell. But not as much as in the past. The derivative equity plays here, Freeport McMoRan (FCX) and Companhia Vale do Rio Doce (VALE), have all taken an absolute pasting.
The food commodities were certainly the asset class to forget about in 2014, as perfect weather conditions and over planting produced record crops for the second year in a row, demolishing prices. The associated equity plays took the swan dive with them.
However, the ags are still a tremendous long term Malthusian play. The harsh reality here is that the world is making people faster than the food to feed them, the global population jumping from 7 billion to 9 billion by 2050.
Half of that increase comes in countries unable to feed themselves today, largely in the Middle East. The idea here is to use any substantial weakness, as we are seeing now, to build long positions that will double again if global warming returns in the summer, or if the Chinese get hungry.
The easy entry points here are with the corn (CORN), wheat (WEAT), and soybeans (SOYB) ETF?s. You can also play through (MOO) and (DBA), and the stocks Mosaic (MOS), Monsanto (MON), Potash (POT), and Agrium (AGU).
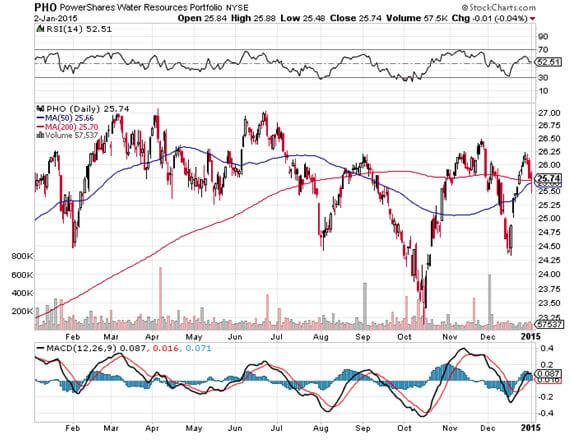
The grain ETF (JJG) is another handy fund. Though an unconventional commodity play, the impending shortage of water will make the energy crisis look like a cakewalk. You can participate in this most liquid of assets with the ETF?s (PHO) and (FIW).
![JT snow angel]() Snow Angel on the Continental Divide
Snow Angel on the Continental Divide

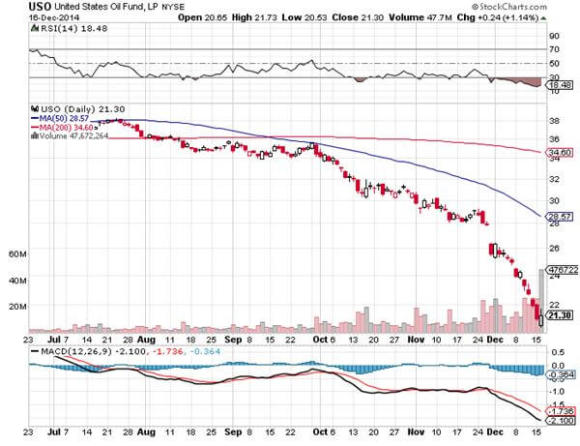
6) Energy (DIG), (RIG), (USO), (DUG), (DIG), (UNG), (USO), (OXY), (XLE), (X)
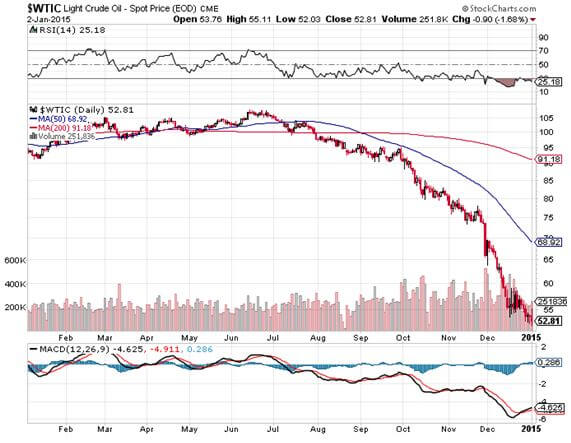
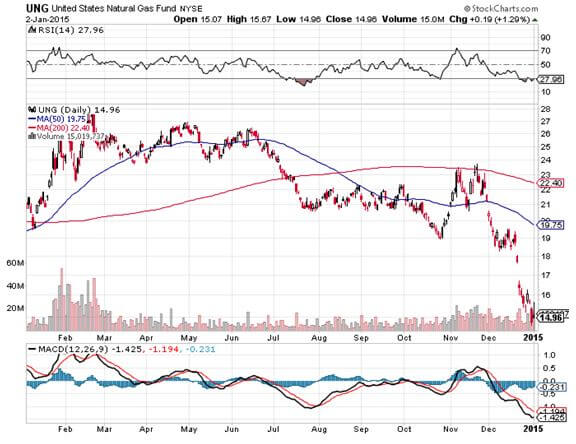
Yikes! What a disaster! Energy in 2014 suffered price drops of biblical proportions. Oil lost the $30 risk premium it has enjoyed for the last ten years. Natural gas got hammered. Coal disappeared down a black hole.
Energy prices did this in the face of an American economy that is absolutely rampaging, its largest consumer.
Our train has moved over to a siding to permit a freight train to pass, as it has priority on the Amtrak system. Three Burlington Northern engines are heaving to pull over 100 black, brand new tank cars, each carrying 30,000 gallons of oil from the fracking fields in North Dakota.
There is another tank car train right behind it. No wonder Warren Buffett tap dances to work every day, as he owns the road. US Steel (X) also does the two-step, since they provide immense amounts of steel to build these massive cars.
The US energy boom sparked by fracking will be the biggest factor altering the American economic landscape for the next two decades. It will flip us from a net energy importer to an exporter within two years, allowing a faster than expected reduction in military spending in the Middle East.
Cheaper energy will bestow new found competitiveness on US companies that will enable them to claw back millions of jobs from China in dozens of industries. This will end our structural unemployment faster than demographic realities would otherwise permit.
We have a major new factor this year in considering the price of energy. Peace in the Middle East, especially with Iran, always threatened to chop $30 off the price of Texas tea. But it was a pie-in-the-sky hope. Now there are active negotiations underway in Geneva for Iran to curtail or end its nuclear program. This could be one of the black swans of 2015, and would be hugely positive for risk assets everywhere.
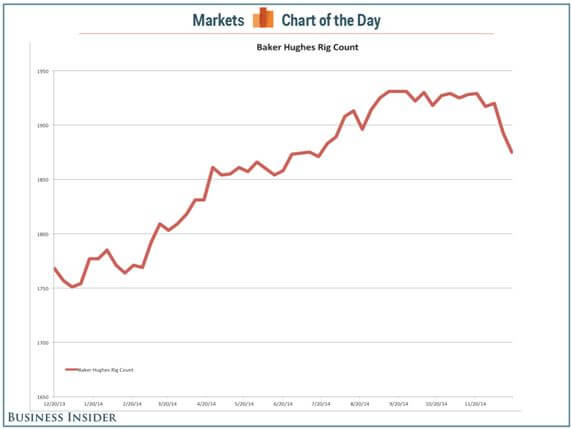
Enjoy cheap oil while it lasts because it won?t last forever. American rig counts are already falling off a cliff and will eventually engineer a price recovery.
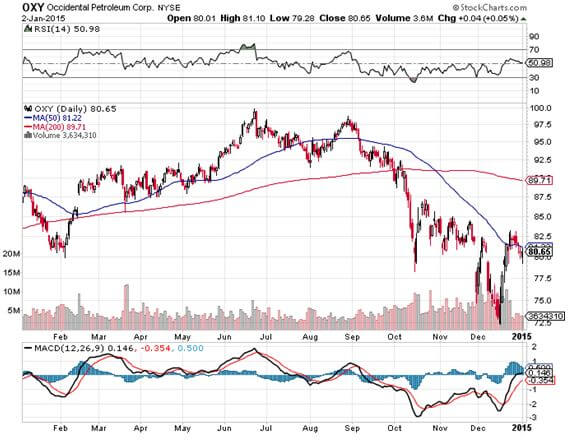
Add the energies of oil (DIG), Cheniere Energy (LNG), the energy sector ETF (XLE), Conoco Phillips (COP), and Occidental Petroleum (OXY). Skip natural gas (UNG) price plays and only go after volume plays, because the discovery of a new 100-year supply from ?fracking? and horizontal drilling in shale formations is going to overhang this subsector for a very long time.
It is a basic law of economics that cheaper prices bring greater demand and growing volumes, which have to be transported. However, major reforms are required in Washington before use of this molecule goes mainstream.
These could be your big trades of 2015, but expect to endure some pain first.

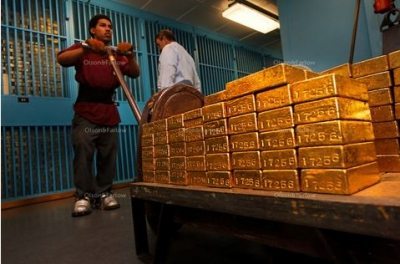
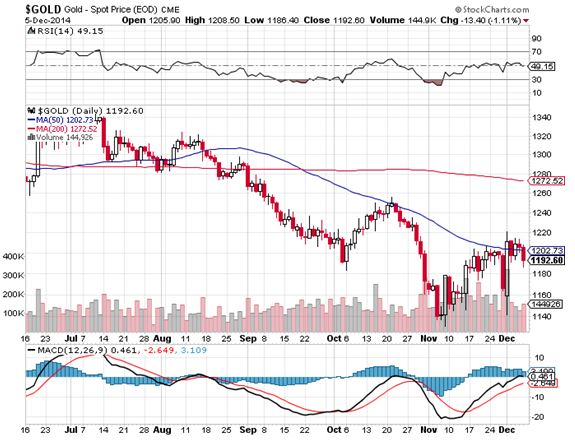
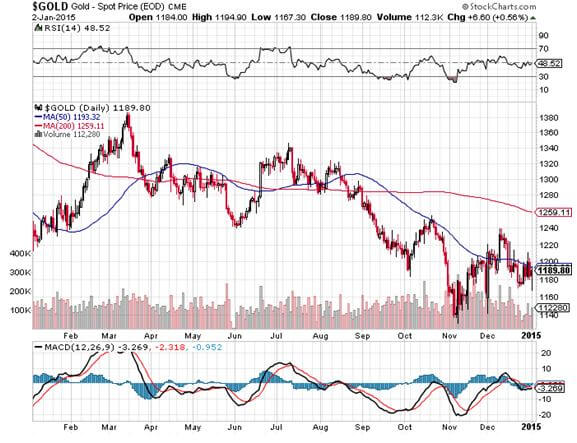
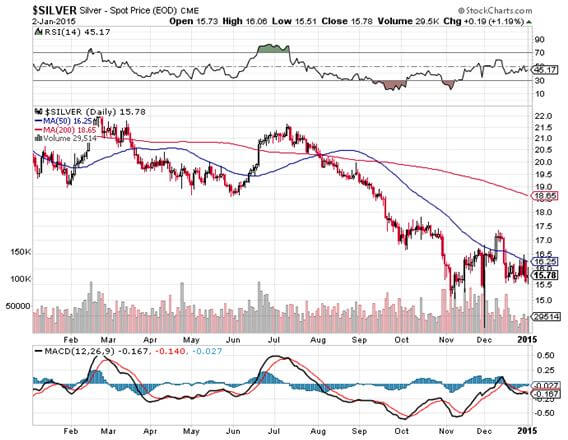
7) Precious Metals (GLD), (DGP), (SLV), (PPTL), (PALL)
The train has added extra engines at Denver, so now we may begin the long laboring climb up the Eastern slope of the Rocky Mountains.
On a steep curve, we pass along an antiquated freight train of hopper cars filled with large boulders. The porter tells me this train is welded to the tracks to create a windbreak. Once, a gust howled out of the pass so swiftly that it blew a train over on to its side.
In the snow filled canyons we sight a family of three moose, a huge herd of elk, and another group of wild mustangs. The engineer informs us that a rare bald eagle is flying along the left side of the train. It?s a good omen for the coming year. We also see countless abandoned gold mines and the broken down wooden trestles leading to them, so it is timely here to speak about precious metals.
As long as the world is clamoring for paper assets like stocks and bonds, gold is just another shiny rock. After all, who needs an insurance policy if you are going to live forever?
We have already broken $1,200 once, and a test of $1,000 seems in the cards before a turnaround ensues. There are more hedge fund redemptions and stop losses to go. The bear case has the barbarous relic plunging all the way down to $700.
But the long-term bull case is still there. Someday, we are going to have to pay the piper for the $4.5 trillion expansion in the Fed?s balance sheet over the past five years, and inflation will return. Gold is not dead; it is just resting. I believe that the monetary expansion arguments to buy gold prompted by massive quantitative easing are still valid.
If you forgot to buy gold at $35, $300, or $800, another entry point is setting up for those who, so far, have missed the gravy train. The precious metals have to work off a severely, decade old overbought condition before we make substantial new highs. Remember, this is the asset class that takes the escalator up and the elevator down, and sometimes the window.
If the institutional world devotes just 5% of their assets to a weighting in gold, and an emerging market central bank bidding war for gold reserves continues, it has to fly to at least $2,300, the inflation adjusted all-time high, or more.
This is why emerging market central banks step in as large buyers every time we probe lower prices. For me, that pegs the range for 2015 at $1,000-$1,400. ETF players can look at the 1X (GLD) or the 2X leveraged gold (DGP).
I would also be using the next bout of weakness to pick up the high beta, more volatile precious metal, silver (SLV), which I think could hit $50 once more, and eventually $100.
What will be the metals to own in 2015? Palladium (PALL) and platinum (PPLT), which have their own auto related long term fundamentals working on their behalf, would be something to consider on a dip. With US auto production at 17 million units a year and climbing, up from a 9 million low in 2009, any inventory problems will easily get sorted out.
![sunset]() Would You Believe This is a Blue State?
Would You Believe This is a Blue State?

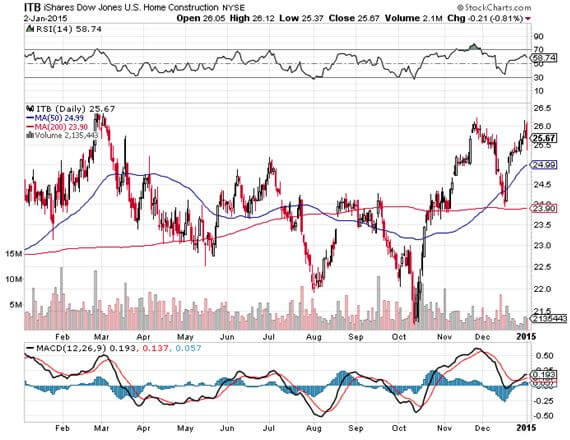
8) Real Estate (ITB)
The majestic snow covered Rocky Mountains are behind me. There is now a paucity of scenery, with the endless ocean of sagebrush and salt flats of Northern Nevada outside my window, so there is nothing else to do but write. My apologies to readers in Wells, Elko, Battle Mountain, and Winnemucca, Nevada.
It is a route long traversed by roving banks of Indians, itinerant fur traders, the Pony Express, my own immigrant forebears in wagon trains, the transcontinental railroad, the Lincoln Highway, and finally US Interstate 80.
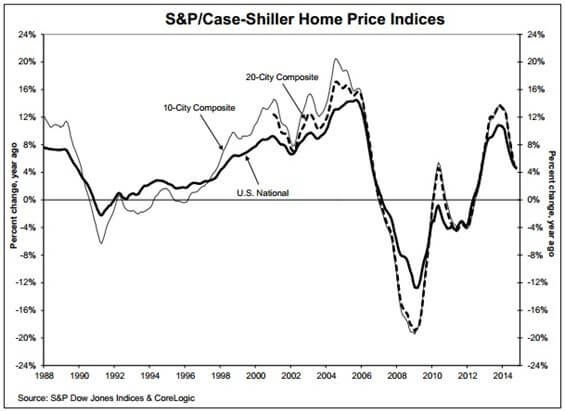
There is no doubt that there is a long-term recovery in real estate underway. We are probably 8 years into an 18-year run at the next peak in 2024.
But the big money has been made here over the past two years, with some red hot markets, like San Francisco, soaring. If you live within commuting distance of Apple (AAPL), Google (GOOG), or Facebook (FB) headquarters in California, you are looking at multiple offers, bidding wars, and prices at all time highs.
From here on, I expect a slow grind up well into the 2020?s. If you live in the rest of the country, we are talking about small, single digit gains. The consequence of pernicious deflation is that home prices appreciate at a glacial pace. At least, it has stopped going down, which has been great news for the financial industry.
There are only three numbers you need to know in the housing market: there are 80 million baby boomers, 65 million Generation Xer?s who follow them, and 85 million in the generation after that, the Millennials.
The boomers have been unloading dwellings to the Gen Xer?s since prices peaked in 2007. But there are not enough of the latter, and three decades of falling real incomes mean that they only earn a fraction of what their parents made.
If they have prospered, banks won?t lend to them. Brokers used to say that their market was all about ?location, location, location?. Now it is ?financing, financing, financing?. Banks have gone back to the old standard of only lending money to people who don?t need it.
Consider the coming changes that will affect this market. The home mortgage deduction is unlikely to survive any real attempt to balance the budget. And why should renters be subsidizing homeowners anyway? Nor is the government likely to spend billions keeping Fannie Mae and Freddie Mac alive, which now account for 95% of home mortgages.
That means the home loan market will be privatized, leading to mortgage rates higher than today. It is already bereft of government subsidies, so loans of this size are priced at premiums. This also means that the fixed rate 30-year loan will go the way of the dodo, as banks seek to offload duration risk to consumers. This happened long ago in the rest of the developed world.
There is a happy ending to this story. By 2022 the Millennials will start to kick in as the dominant buyers in the market. Some 85 million Millennials will be chasing the homes of only 65 Gen Xer?s, causing housing shortages and rising prices.
This will happen in the context of a labor shortfall and rising standards of living. Remember too, that by then, the US will not have built any new houses in large numbers in 15 years.
The best-case scenario for residential real estate is that it gradually moves up for another decade, unless you live in Cupertino or Mountain View. We won?t see sustainable double-digit gains in home prices until America returns to the Golden Age in the 2020?s, when it goes hyperbolic.
But expect to put up your first-born child as collateral, and bring your entire extended family in as cosigners if you want to get a bank loan.
That makes a home purchase now particularly attractive for the long term, to live in, and not to speculate with. This is especially true if you lock up today?s giveaway interest rates with a 30 year fixed rate loan. At 3.3% this is less than the long-term inflation rate.
You will boast about it to your grandchildren, as my grandparents once did to me.
![Bridge]() Crossing the Bridge to Home Sweet Home
Crossing the Bridge to Home Sweet Home

9) Postscript
We have pulled into the station at Truckee in the midst of a howling blizzard.
My loyal staff have made the 20 mile trek from my beachfront estate at Incline Village to welcome me to California with a couple of hot breakfast burritos and a chilled bottle of Dom Perignon Champagne, which has been resting in a nearby snowbank. I am thankfully spared from taking my last meal with Amtrak.
Well, that?s all for now. We?ve just passed the Pacific mothball fleet moored in the Sacramento River Delta and we?re crossing the Benicia Bridge. The pressure increase caused by an 8,200 foot descent from Donner Pass has crushed my water bottle. The Golden Gate Bridge and the soaring spire of the Transamerica Building are just around the next bend across San Francisco Bay.
A storm has blown through, leaving the air crystal clear and the bay as flat as glass. It is time for me to unplug my Macbook Pro and iPhone 6, pick up my various adapters, and pack up.
We arrive in Emeryville 45 minutes early. With any luck, I can squeeze in a ten mile night hike up Grizzly Peak and still get home in time to watch the season opener for Downton Abbey season five. I reach the ridge just in time to catch a spectacular pastel sunset over the Pacific Ocean. The omens are there. It is going to be another good year.
I?ll shoot you a Trade Alert whenever I see a window open on any of the trades above.
Good trading in 2015!
John Thomas
The Mad Hedge Fund Trader